Journal of Civil Engineering and Materials Application
Journal home page:
http://journals.rpp.co.ir/jcemaReceived: 09 May 2018 • Accepted: 23 August 2018
Research
doi:10.xxxxx/J.JCEMA.12020304
Evaluation and Simulation of New Roundabouts
Traffic Parameters by Aimsun Software
Hamid Shaker*, Hamid Bigdeli Rad
Department of Transportation Planning, Faculty of Civil Engineering, Iran University of Science and Technology, Tehran, Iran
*Correspondence should be addressed to Hamid Shaker, Geotechnical Engineering, Department of Civil Engineering, University of Mohaghegh Ardabili, Ardabil, Iran; Tel: +989128340967; Fax: +98; Email: [email protected].
ABSTRACT
New roundabouts are innovation and revolutionary in roundabout design, with the risk of incidents in these roundabouts far less than traditional common roundabouts. These types of roundabouts control the traffic flow at the entrance and exit of the roundabout, with the guidance of drivers to isolated lines before entering the roundabout and guidance to the spiral lines inside the roundabout as channelized. Another advantage of these roundabouts is the much more balanced division of traffic flows than traditional ones. In Iran, in view of the many problems of capacity, flow and safety of intersections and intersections, this type of roundabout can be very useful in certain conditions. In this research, how these roundabouts are compared and also the comparison of different input capacities based on the origin - destination demand matrix for new roundabouts and common roundabouts of two lanes with the help of Aimsun traffic simulation software have been investigated. For this purpose, the values of traffic indicators of delay time, density, flow, stop time and travel time of computer simulations for new roundabouts and common roundabouts have been investigated and compared. According to the demand matrix of the origin-destination models loaded in the software and comparisons done, the optimal model for the highest capacity and the lowest delay time and travel time is presented. In this simulation, 8 to 16 percent increase in traffic flow and a decrease of 34 to 59 percent for travel time and delay time in the new roundabouts is shown in comparison with the common two-lane roundabouts.
Key words: 2 Lane Roundabout, Density, Delay Time, Stop Time, Capacity, Travel Time.
Copyright © 2018 Hamid Shaker et al. This is an open access paper distributed under the Creative Commons Attribution License.
Journal of Civil Engineering and Materials Applicationis published byRaika Pajuhesh Pars; Journal p-ISSN xxxx-xxxx; Journal e-ISSN 2588-2880.
1. INTRODUCTION
n the past, the roundabouts of urban gatherings and traditional ceremonies were considered. Nowadays, the roundabouts of traffic control and the symbol of civilization are considered (1). Roundabouts are nowadays considered as a facility for the passage of vehicles. Whenever added to the input traffic to the roundabout, the roundabout control will be out of a simple oversight mode and the traffic analysis of the roundabouts will enter into a complex process (2). Failure to apply the principles of traffic engineering and accurate estimation of supply and demand in urban planning and comprehensive plans of the
roundabouts is that the increase in the curvature of the vehicle paths has a relative velocity between the devices that enter the roundabout and the moving vehicles around the roundabout. Therefore, results in a lower rate of collision between the vehicles entering and exiting (8, 9). The curvature of the vehicle paths in the two lanes concentric roundabouts leads to a complex problem. Sometimes this problem is moderated, as in the ASSHTO standard of geometric design of highways and streets (10). The guide states that "the proper speed of vehicles along the roundabout is the most important key to design" (10). In the comprehensive analysis of several roundabouts in Germany, Beryllon and Boomer conclude that line
∙∙∙∙∙∙∙∙∙∙∙∙∙∙∙∙∙∙∙∙∙∙∙∙∙∙∙∙∙∙∙∙∙∙∙∙∙∙∙∙∙∙∙∙∙∙∙∙∙∙∙∙∙∙∙∙∙∙∙∙∙∙∙∙∙∙∙∙∙∙∙∙∙∙∙∙∙∙∙∙∙∙∙∙∙∙∙∙∙∙∙∙∙∙∙∙∙∙∙∙∙∙∙∙∙∙∙∙∙∙∙∙∙∙∙∙∙∙∙∙∙∙∙∙∙∙∙∙∙∙∙∙∙∙∙∙∙∙∙∙∙∙∙∙∙∙∙∙∙∙∙∙∙∙∙∙∙∙∙∙∙∙∙∙∙
J. Civil Eng. Mater.App. 2018 (September); 2 (3): 146-158 concentric roundabout is in fact one of the major disadvantages of the old style (roundabouts), which requires the change of lines in a curve. As a result, driving speed is gradually reduced (13, 14). The focal point of the two-level roundabout is better than the traditional shape of the roundabout. However, this roundabout does not provide a simple solution to conflicting situations; a path that is the strength point of a modern single lane roundabout (8, 15, 16). The third problem of the two lanes concentric roundabout is also related to the need for line change, the use of the inner lane is weak, which has a negative impact on capacity (17). These disadvantages and problems caused the investigators to think differently in solving the problem of defect in the capacity of single lane roundabouts (18). The answer to these challenges is Turbo Roundabout, which has the following main characteristics: 1. Create one lane for at least one input;
2. The current traffic to the roundabout in each direction must be in two directions (lines) in the roundabout, and not more;
3. A smooth flow of traffic along the roundabout should assign using suitable spiral alignment;
4. Remaining barriers between the lines prevent the imposition of intolerable drivers;
5. Each section of the roundabout consists of a line in
which drivers can decide whether or not to continue their route around the roundabout;
6. At least two outgoing ways are two-way directions; 7. The radius of the roundabout is kept small;
8. The paths approaching the roundabout are at the right angles to it;
9-shielding covers the horizons;
10-High-performance floorboards provide wide roundabout widths and suitable widths for long vehicles to use from the roundabout (18).
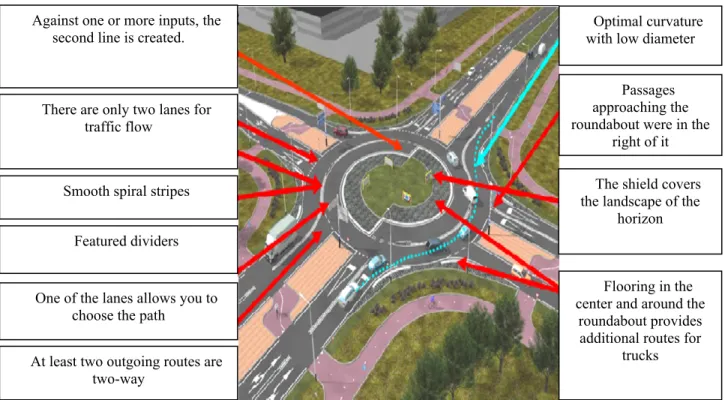
These characteristics are all represented in Figure 1. Based on the principles outlined above, a number of types of roundabouts can be created. One of these roundabouts was first called the Turbo Roundabout (18). The first turbo roundabout was built in 2000 and by 2012, 70 turbo roundabouts have been built in the Netherlands (18). The idea of the Turbo Roundabout has so far been developed in the European media, which means all modern roundabouts that were built according to the above criteria. The type of roundabouts that was originally called Turbo Roundabout is now called Base Turbo roundabouts to distinguish it from other types of roundabouts. Roundabouts with characteristics 5 and 6 are not called "Relative Turbo roundabouts” (18).
Against one or more inputs, the second line is created.
There are only two lanes for traffic flow
Smooth spiral stripes Featured dividers
Flooring in the center and around the
roundabout provides additional routes for
trucks The shield covers the landscape of the
horizon Passages approaching the roundabout were in the
right of it Optimal curvature with low diameter
One of the lanes allows you to choose the path
At least two outgoing routes are two-way
Figure 1. Turbo-roundabouts Characteristics (5)
2. METHODOLOGY
In order to estimate and compare the turbo-roundabout with respect to the common two lanes roundabout, in terms of input capacities, the four-lane roundabout functions have been defined as the traffic loading capacity and the origin-destination basis for this research.
2.1. The first type of origin-destination demand
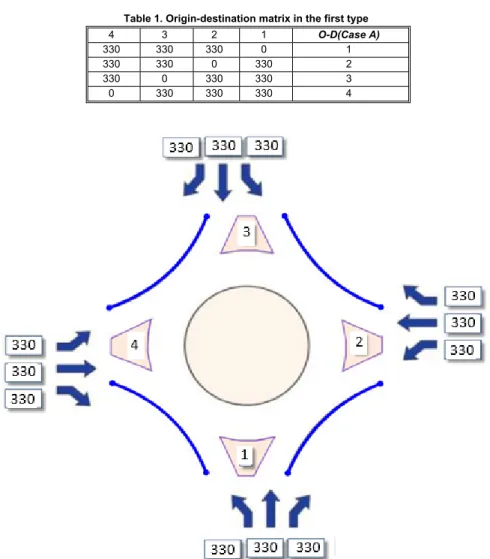
In this case, for loading and comparison between common roundabouts and Turbo roundabouts, the description of demand is considered equally between the functions of both states. In this case, the input of each of the functions is equally balanced with 330 vehicles per hour. The originator matrix of the first type is presented in Table 1. Also, in Figure 2, the division of functions and the distribution of inputs of functions are schematically
presented.
Table 1. Origin-destination matrix in the first type
4 3 2 1 O-D(Case A)
330 330 330 0 1
330 330 0 330 2
330 0 330 330 3
0 330 330 330 4
Figure 2. Explain the first type of loading the origin-destination demand (Veh/h)
2.2. The second type of the origin-destination demand
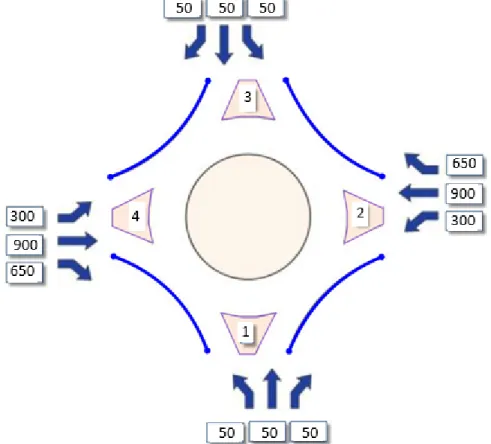
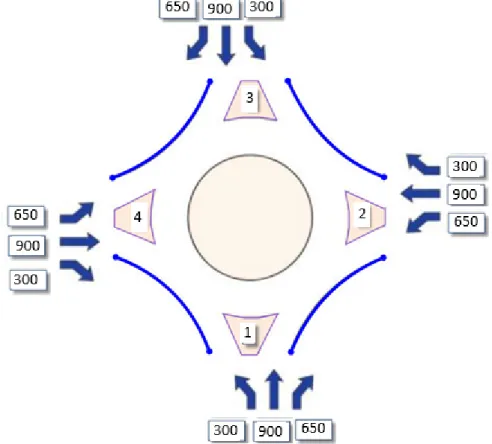
In the second type, the distribution of the origin-destination demand in the second and fourth directions has the highest input capacity. In this case, the performance of the second to fourth input is 900 vehicles per hour and the same input capacity from the fourth to the second direction is considered. Also, for the second to third approaches, 650 vehicles per hour are the second highest capacity in direction operations. In addition, third capacities are considered as the second to first direction with 300 vehicles per hour. Similarly, for the sake of this
performance, the fourth to the second entry is 900 and the fourth to the first, 650 and the fourth to the third is 300, respectively. For other entries, capacity is estimated at 50 vehicles per hour. In this case, the demand for the origin-destination is more than the loading capacity for the East-West direct approach, and in the North-South approaches, the minimum input capacity in the predicted matrix is applied. In Table 2, the states of the origin-destination are presented, also in Figure 3, a schematic representation of the distribution of these inputs for the first to fourth directions are shown.
Table 2. Origin-destination matrix in the second type
4 3 2 1 O-D(Case B)
650 50 300 0 1
900 50 0 50 2
300 0 650 50 3
∙∙∙∙∙∙∙∙∙∙∙∙∙∙∙∙∙∙∙∙∙∙∙∙∙∙∙∙∙∙∙∙∙∙∙∙∙∙∙∙∙∙∙∙∙∙∙∙∙∙∙∙∙∙∙∙∙∙∙∙∙∙∙∙∙∙∙∙∙∙∙∙∙∙∙∙∙∙∙∙∙∙∙∙∙∙∙∙∙∙∙∙∙∙∙∙∙∙∙∙∙∙∙∙∙∙∙∙∙∙∙∙∙∙∙∙∙∙∙∙∙∙∙∙∙∙∙∙∙∙∙∙∙∙∙∙∙∙∙∙∙∙∙∙∙∙∙∙∙∙∙∙∙∙∙∙∙∙∙∙∙∙∙∙∙
J. Civil Eng. Mater.App. 2018 (September); 2 (3): 146-158
Figure 3. Explain the second type of loading the origin-destination demand (Veh/h)
2.3. The third type of the origin-destination demand
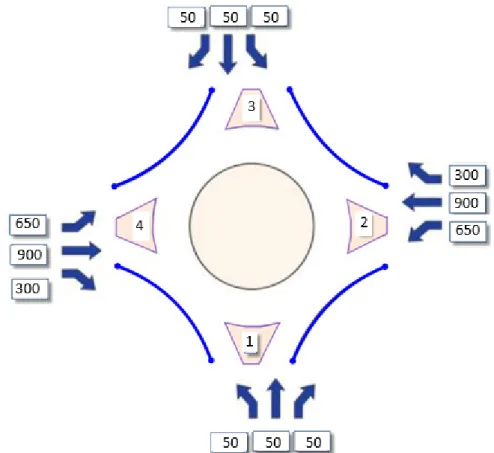
In the third case, the distribution of origin-destination demand in the second and fourth direction has the highest input capacity. In this case, the performance of the second to fourth input is 900 vehicles per hour and the same input capacity from the fourth to the second performance is considered. In addition, for the second-to-first approach, 650 vehicles per hour, the second highest capacity is in the functional branches of the roundabout. In third place, the capacity of the second to third performance capacity is also estimated at 300 vehicles per hour. Similarly, in contrast to
this performance, the fourth to second entry is 900, and the fourth to third is 650, and from the fourth to the first, 300 vehicles are inputs, respectively. For other entries, demand is estimated at 50 vehicles per hour. In this case, the demand for the origin-destination is more than the load capacity for the direct east-west approach, and in the north-south approaches, the minimum input capacity in the predicted matrix is applied. In Table 3, the mentioned origin-destination states are presented. In addition, in
Figure 4, a schematic representation of the distribution of
these inputs for the first to fourth direction is shown.
Table 3. Origin-destination matrix in the third type
4 3 2 1 O-D(Case C)
300 50 650 0 1
900 50 0 50 2
650 0 300 50 3
Figure 4. Explain the third type of loading the origin-destination demand (Veh/h)
2.4. The fourth type of the origin-destination demand
In the fourth type, as in the third case, the distribution of the origin-destination demand in the second and fourth directions has the highest input capacity. In this case, the performance of the second to fourth input is 900 vehicles per hour and the same input capacity from the fourth to the second performance is considered. In addition, for the second-to-first approach, 650 vehicles per hour, the second highest capacity is in the functional branches of the roundabout. In third place, the capacity of the second to third performance capacity is also estimated at 300 vehicles per hour. Similarly, in contrast to this
performance, the fourth to second entry is 900, and the fourth to third is 650, and from the fourth to the first, 300 vehicles are capacities, respectively. For other entries, capacity is estimated at 50 vehicles per hour. In this case, the demand for the source-destination is more than the load capacity for the direct east-west approach, and in the north-south approaches, the minimum input capacity in the predicted matrix is applied. In Table 4, the mentioned origin-destination states are presented, as shown in Figure 5, a schematic representation of the distribution of these inputs for the first to fourth functions.
Table 4. Origin-destination matrix in the fourth type
4 3 2 1 O-D(Case D)
300 900 650 0 1
900 300 0 650 2
650 0 300 900 3
∙∙∙∙∙∙∙∙∙∙∙∙∙∙∙∙∙∙∙∙∙∙∙∙∙∙∙∙∙∙∙∙∙∙∙∙∙∙∙∙∙∙∙∙∙∙∙∙∙∙∙∙∙∙∙∙∙∙∙∙∙∙∙∙∙∙∙∙∙∙∙∙∙∙∙∙∙∙∙∙∙∙∙∙∙∙∙∙∙∙∙∙∙∙∙∙∙∙∙∙∙∙∙∙∙∙∙∙∙∙∙∙∙∙∙∙∙∙∙∙∙∙∙∙∙∙∙∙∙∙∙∙∙∙∙∙∙∙∙∙∙∙∙∙∙∙∙∙∙∙∙∙∙∙∙∙∙∙∙∙∙∙∙∙∙
J. Civil Eng. Mater.App. 2018 (September); 2 (3): 146-158
Figure 5. Explain the fourth type of loading the origin-destination demand (Veh/h)
2.5. AIMSUN software simulation model of common two lane roundabouts
After drawing the two lane roundabout according to the geometric design criteria, in AutoCAD software and the simulation software, the general network and the two lane roundabout approaches were modeled in the AutoCAD software. Given that in the AIMSUN simulation software in version 8, the roundabout type is defined for definition in the performance of the passages, then the definition of the roundabout is introduced uniquely. In Figures 4-9, the view of the common two lane roundabouts model is shown in the simulator AIMSUN software. In the next step, for each type of origin-destination matrix, it is defined independently in its related models. In addition, for each scenario, loading the relevant scenario is made. After defining the above items in the software, the average number of repetitions is considered for more accurate estimation of traffic parameters. Finally, the output of the traffic parameters for each of the origin-destination matrices is extracted individually. After plotting the turbo-roundabout based on the rules of the Fortuijn's geometric design in the AutoCAD software and introducing it into simulator software, we model the overall network and approaches of Turbo-roundabout. Considering that in the AIMSUN simulation software it is not possible to describe the field network as a single and independent turbo roundabout, due to the separator constraints within the turbo roundabout and the existence of the incidence of these roundabouts in the internal reef of these types of roundabouts, cannot be represented as Independent and one-piece model. In the next step, for each type of
origin-destination matrix, it is defined independently in its related models. Also, for each scenario, the loading of the relevant scenario is made. After defining the above in the software, the average of ten repetitions is considered for more accurate estimation of traffic parameters. Finally, the output of the traffic parameters for each of the O-D matrices is extracted individually.
3. RESULT AND DISCUSSION
In this section, the results of the difference of values obtained for each of the traffic parameters are compared to each of the different roundabout types. In Table 5, Table 6,
Table 7 and Table 8, for each of the items, the source-destination matrix is presented separately for each type of roundabout of traffic parameters. In addition, the difference between the turbo- roundabout traffic indicators with the two- lane common roundabout at the end of the tables is presented. In this regard, for traffic indicators, a negative sign is indicative of the reduction of the turbo-roundabout traffic index relative to the common roundabout, and a positive sign indicating that the index is increasing compared to the common one. In Table 5, the difference in traffic indicator values for the first origin matrix is presented. In this regard, the difference between the turbo- roundabout delay time index and the common roundabout is 30.91 seconds per km less than the common roundabout. Also, the density index in turbo- roundabout is 19.16 vehicle per kilometer less than common one. The turbo roundabout flow is 259 vehicles per hour more than the common roundabout, with a stop time of 87.15 and a travel time of 38.92 seconds per km less than the common
one.
Table 5. The difference between the values of turbo- roundabout traffic indicators to the two-lanecommon roundabout in the first case of the origin-destination demand matrix
Origin-destination demand matrix First Type
Traffic Parameters Delay Time
(S/Km)
Density (Veh/Km) Flow
(Veh/h)
Stop Time (S/Km)
Travel Time (S/Km)
Two lane roundabout 164.61 42.91 3699 140.40 231.91
Turbo Roundabout 73.31 26.72 3958 53.25 139.53
Difference -91.30 -16.19 259 -87.15 -92.38
In Table 6, the difference in traffic indicator values for the second origin-destination matrix is presented. In this regard, the difference between the turbo- roundabout delay time index and the common roundabout is 53.33 s / km less than the common one. In addition, the density index in
the turbo- roundabout is lower than the 4.59 per kilometer relative to Common Roundabout. Turbo roundabout flow is 401 vehicles per hour more than the common two-lane roundabout, and the stop time is 64.87 and travel time is less than 54.77 per kilometer from the common roundabout.
Table 6. The difference between the values of turbo- roundabout traffic indicators to the two-lanecommon roundabout in the second case of the origin-destination demand matrix
Origin-destination demand matrix Second Type
Traffic Parameters Delay Time
(S/Km)
Density (Veh/Km) Flow
(Veh/h)
Stop Time (S/Km)
Travel Time (S/Km)
Two lane roundabout 280.34 54.61 3053 265.06 347.31
Turbo Roundabout 227.01 50.02 3454 200.19 292.94
Difference -53.33 -4.59 401 -64.87 -54.37
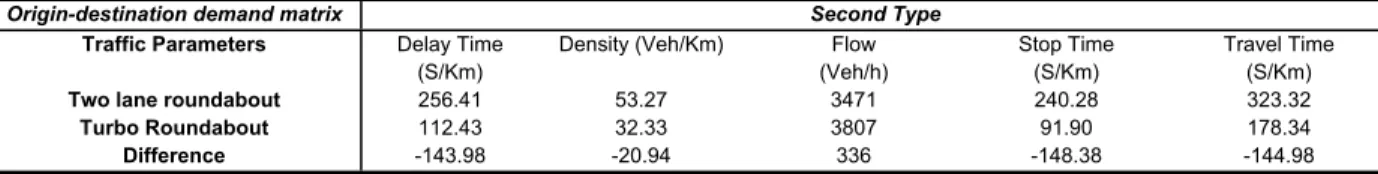
In Table 7, the difference in traffic indicator values for the second origin-destination matrix is presented. In this regard, the difference between the turbo- roundabout delay time index and the common roundabout is 143.98 s / km less than the common one. Also, the density index in the turbo- roundabout is lower than the 20.94 per kilometer
relative to Common Roundabout. Turbo roundabout flow is 336 vehicles per hour more than the common two-lane roundabout, and the stop time is 148.38 and travel time is less than 144.98 per kilometer from the common roundabout.
Table 7. The difference between the values of turbo- roundabout traffic indicators to the two-lanecommon roundabout in the third case of the origin-destination demand matrix
Origin-destination demand matrix Third Type
Traffic Parameters Delay Time
(S/Km)
Density (Veh/Km) Flow
(Veh/h)
Stop Time (S/Km)
Travel Time (S/Km)
Two lane roundabout 256.41 53.27 3471 240.28 323.32
Turbo Roundabout 112.43 32.33 3807 91.90 178.34
Difference -143.98 -20.94 336 -148.38 -144.98
In Table 8, the difference in traffic indicator values for the second origin-destination matrix is presented. In this regard, the difference between the turbo- roundabout delay time index and the common roundabout is 108.18 s / km less than the common one. In addition, the density index in the turbo- roundabout is lower than the 4.09 per kilometer
relative to Common Roundabout. Turbo roundabout flow is 273 vehicles per hour more than the common two-lane roundabout, and the stop time is 121.98 and travel time is less than 245.68 per kilometer from the common roundabout.
Table 8. The difference between the values of turbo- roundabout traffic indicators to the two-lanecommon roundabout in the fourth case of the origin-destination demand matrix
Origin-destination demand matrix Second Type
Traffic Parameters Delay Time
(S/Km)
Density (Veh/Km) Flow
(Veh/h)
Stop Time (S/Km)
Travel Time (S/Km)
Two lane roundabout 256.41 53.27 3471 240.28 323.32
Turbo Roundabout 112.43 32.33 3807 91.90 178.34
Difference -143.98 -20.94 336 -148.38 -144.98
∙∙∙∙∙∙∙∙∙∙∙∙∙∙∙∙∙∙∙∙∙∙∙∙∙∙∙∙∙∙∙∙∙∙∙∙∙∙∙∙∙∙∙∙∙∙∙∙∙∙∙∙∙∙∙∙∙∙∙∙∙∙∙∙∙∙∙∙∙∙∙∙∙∙∙∙∙∙∙∙∙∙∙∙∙∙∙∙∙∙∙∙∙∙∙∙∙∙∙∙∙∙∙∙∙∙∙∙∙∙∙∙∙∙∙∙∙∙∙∙∙∙∙∙∙∙∙∙∙∙∙∙∙∙∙∙∙∙∙∙∙∙∙∙∙∙∙∙∙∙∙∙∙∙∙∙∙∙∙∙∙∙∙∙∙
J. Civil Eng. Mater.App. 2018 (September); 2 (3): 146-158
Figure 6. Chart of the delay time for the Common Roundabout and turbo roundabout
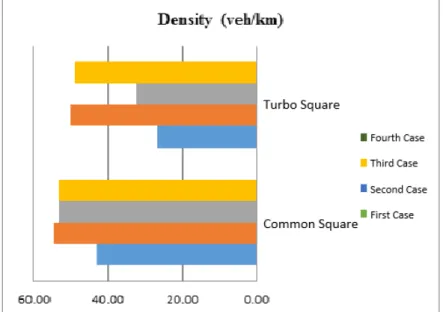
In Figure 7, the output value of computer simulation for a
common roundabout and Turbo roundabout is presented separately for the four origin - destination demand matrices. In this diagram, the highest density difference is in the
third case of demand matrix. In the second place, the first demand matrix and in the third and fourth places are the second and fourth demand matrices, respectively.
Figure 7. Chart of the density for the Common Roundabout and turbo roundabout
In Figure 8, the output of computer simulation for the common Roundabout and turbo Roundabout is separately presented for four origin - destination demand matrices. In this chart, the maximum difference is the flow in the
second case of the demand matrix. In the second place, the third demand matrix and the third and fourth places, are the fourth and first demand matrices respectively.
Figure 8. Chart of the flow for the Common Roundabout and turbo roundabout
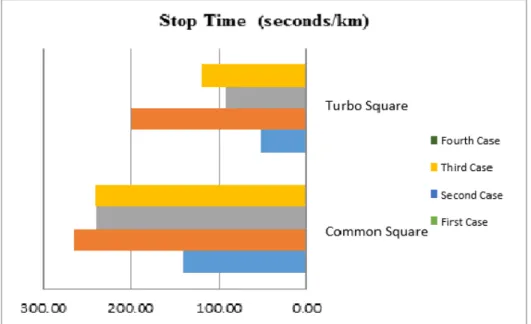
In Figure 9, the output stop time for computer simulation
for a common Roundabout and turbo Roundabout is presented separately for the four origin - destination request matrices. In this chart, the maximum difference in
stop time is in the third case of the demand matrix. In the second place, the fourth case matrix and the third and fourth places are the matrices of the first and second demand, respectively.
Figure 9. Chart of the stop time for the Common Roundabout and turbo roundabout
In Figure 10, the amount of travel time for computer
simulation for a common Roundabout and turbo Roundabout is presented separately for the four origin - destination demand matrices. In this chart, the greatest
difference is the travel time in the fourth case of the demand matrix. In the second place, the third demand matrix and the third and fourth places are the matrices of the first and second demand, respectively.
∙∙∙∙∙∙∙∙∙∙∙∙∙∙∙∙∙∙∙∙∙∙∙∙∙∙∙∙∙∙∙∙∙∙∙∙∙∙∙∙∙∙∙∙∙∙∙∙∙∙∙∙∙∙∙∙∙∙∙∙∙∙∙∙∙∙∙∙∙∙∙∙∙∙∙∙∙∙∙∙∙∙∙∙∙∙∙∙∙∙∙∙∙∙∙∙∙∙∙∙∙∙∙∙∙∙∙∙∙∙∙∙∙∙∙∙∙∙∙∙∙∙∙∙∙∙∙∙∙∙∙∙∙∙∙∙∙∙∙∙∙∙∙∙∙∙∙∙∙∙∙∙∙∙∙∙∙∙∙∙∙∙∙∙∙
J. Civil Eng. Mater.App. 2018 (September); 2 (3): 146-158
Figure 10. Chart of the travel time for the Common Roundabout and turbo roundabout
In Table 9, the values of the difference between the turbo-
roundabout traffic parameters and the common roundabout are presented. As indicated in this table, for the traffic parameters, the delay time of the origin-destination demand matrix is the third most demanded matrix from the other cases; also, for the traffic density index, the third case has the lowest value for the flow index, the second case matrix has the greatest difference compared to the matrices of other cases. For the stop time and travel time indices, the matrices of the third and fourth cases have the smallest value than the matrices of other cases. In these
tables, the traffic parameters of the origin-destination matrix of the third case outstripped the other three matrices in three main indexes. In the origin-destination matrix, the second destination, the traffic flow indicator, and in the fourth case matrix, the travel time difference is greater than the matrices of other cases. Since the origin-destination demand matrix has a higher value than the other cases, the origin-destination matrix is intended. Therefore, in the next section, the comparison graphs of each of the traffic parameters in the third case matrix of demand are presented separately.
Table 9. Comparison of Turbo-roundabout Traffic Parameters Differences with Two-Lane Common roundabout
Traffic Parameters First Case Second Case Third Case Fourth Case
Delay Time (S/Km)
-91.30 -53.33 -143.98 -108.18
Density (Veh/Km) -16.19 -4.59 -20.94 -4.09
Flow (Veh/h)
259 401 336 273
Stop Time (S/Km)
-87.15 -64.87 -148.38 -121.98
Travel Time (S/Km)
-92.38 -54.37 -144.98 -155.68
4. VALIDATION
In this research, to ensure the accuracy of the output data from simulation of the AIMSUN software, the origin-destination matrix of the predicted origin-destination in the simulation software model is loaded with the model provided by Fortuijn for turbo roundabout. The results of comparing each of the models and the percentage difference between the results of the simulation of AIMSUN software will be compared with the MSRV
model. Figure 11, Figure 12, Figure 13 and Figure 14
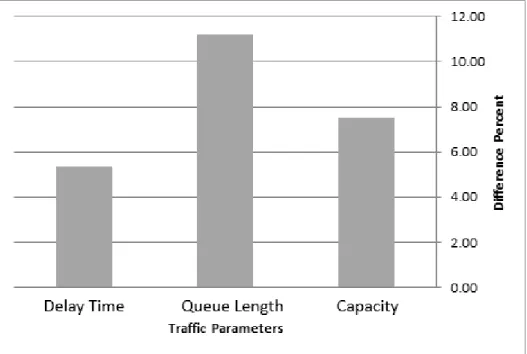
percent differences in traffic parameters, capacity, queue length and delay time are presented for the AIMSUN simulation model compared to the MSRV model. In the
Figure 11, the mentioned parameters are presented for the
origin-destination demand matrix of the first case. In these cases, the greatest difference in the queue length parameter is the 11%. In the following categories, capacity with 8% and delay time with 5% are, respectively.
Figure 11. The average percentage difference of traffic parameters for first case approaches tothe origin- destination demand matrix
∙∙∙∙∙∙∙∙∙∙∙∙∙∙∙∙∙∙∙∙∙∙∙∙∙∙∙∙∙∙∙∙∙∙∙∙∙∙∙∙∙∙∙∙∙∙∙∙∙∙∙∙∙∙∙∙∙∙∙∙∙∙∙∙∙∙∙∙∙∙∙∙∙∙∙∙∙∙∙∙∙∙∙∙∙∙∙∙∙∙∙∙∙∙∙∙∙∙∙∙∙∙∙∙∙∙∙∙∙∙∙∙∙∙∙∙∙∙∙∙∙∙∙∙∙∙∙∙∙∙∙∙∙∙∙∙∙∙∙∙∙∙∙∙∙∙∙∙∙∙∙∙∙∙∙∙∙∙∙∙∙∙∙∙∙
J. Civil Eng. Mater.App. 2018 (September); 2 (3): 146-158
Figure 13. The average percentage difference of traffic parameters for third case approaches tothe origin- destination demand matrix
In Figure 14, all averages of the percentage difference between delay time parameters, queue lengths and capacity obtained from the computer simulator model are presented with the MSRV mathematical model. In this chart, the
highest percentage difference is about 16% in the queue parameter and the least percentage difference for the capacity parameter is about 3%. The average percentage of differences is about 8%.
Figure 14. Average graph of the difference between traffic indicators for all approaches
5. CONCLUSION
According to the results of comparison of turbo- roundabout traffic indicators for the predicted origin-destination matrices for comparison, the relative improvement of the total indexes in a scale with common roundabouts is shown. The difference in the results obtained from computer simulations for common
roundabouts and Turbo Roundabout is presented in Table 10. In this table, for the delay time indicator, the demand matrix of the third, the first and the second case are prioritized, respectively. For the density index, the third case, the first case and the second case are prioritized respectively. The flow index have the second, third, and first priority respectively. Also, for the stop time index, the first case, the third case and the first case have priority.
The travel time index is also the third, first and second priority. Therefore, considering that the demand matrix of the third case has three superior indexes than other
matrices, they are in the first row for the proposal to replace the common roundabouts. In the next priorities, the first matrix and the second matrix are proposed.
Table 10. The percentage difference of turbo- roundabout traffic indicators relative to the common roundabout
Difference Percentage
Traffic Parameters Delay
Time (S/Km)
Density (Veh/Km) Flow
(Veh/h)
Stop Time (S/Km)
Travel Time (S/Km)
First Case -55.46 -37.73 7 -62.07 -39.83
Second Case -19.02 -8.41 13.13 -24.47 -15.65
Third Case -56.15 -39.31 9.68 -61.75 -44.84
Fourth Case -42.09 -7.71 6.14 -50.55 -47.93
FUNDING/SUPPORT
Not mentioned any Funding/Support by authors.
ACKNOWLEDGMENT
Not mentioned any acknowledgment by authors.
AUTHORS CONTRIBUTION
This work was carried out in collaboration among all authors.
CONFLICT OF INTEREST
The author (s) declared no potential conflicts of interests with respect to the authorship and/or publication of this paper.
REFERENCES
1. Moughtin C. Urban design: street and square: Routledge; 2007.
2. Ogundele F, Tiamiyu I, Iwara AI. Assessment of heavy metal sources across urban transportation facilities in Lagos Metropolis, Nigeria. Confluence Journal of Environmental Studies. 2017;11(2):19-26.
3. Le H, Buehler R, Hankey S. Toward Generalizability in Direct-Demand Modeling: Exploratory Models from 20 US Jurisdictions. 2018.
4. Hasnine MS, Weiss A, Nurul Habib K. Development of an employer-based transportation demand management strategy evaluation tool with an advanced discrete choice model in its core. Transportation Research Record: Journal of the Transportation Research Board. 2016(2542):65-74.
5. Bigdeli Rad H, Bigdeli Rad V. A Survey on the Rate of Public Satisfaction about Subway Facilities in the City of Tehran Using Servqual Model. Space Ontology International Journal. 2018;7(1):11-7.
6. Tarko AP. Surrogate measures of safety. Safe Mobility: Challenges, Methodology and Solutions: Emerald Publishing Limited; 2018. p. 383-405. 7. Wang L, Abdel-Aty M, Wang X, Yu R. Analysis and comparison of safety models using average daily, average hourly, and microscopic traffic. Accident Analysis & Prevention. 2018;111:271-9.
8. Kieć M, Ambros J, Bąk R, Gogolín O. Evaluation of safety effect of
turbo-roundabout lane dividers using floating car data and video observation. Accident Analysis & Prevention. 2018.
9. Fortuijn L. Turbo roundabouts: Design principles and safety performance. Transportation Research Record: Journal of the Transportation Research Board. 2009(2096):16-24.
10. Robinson B. Roundabouts: an informational guide. US Department of Transportation, Federal Highway Administration. Report FWHA-RD-00-067, Washington, 2000.
11. Mauro R, Branco F. Comparative analysis of compact multilane roundabouts and turbo-roundabouts. Journal of Transportation Engineering. 2009;136(4):316-22.
12. Ticali D, Corriere F. Turbo roundabouts: geometric design parameters and performance analysis. GSTF Journal on Computing (JoC). 2018;2(1). 13. Officials T. A Policy on Geometric Design of Highways and Streets, 2011: AASHTO; 2011.
14. Fernandes P, Coelho M, editors. Making Compact Two-Lane Roundabouts Effective for Vulnerable Road Users: An Assessment of Transport-Related Externalities. Scientific And Technical Conference Transport Systems Theory And Practice; 2018: Springer.
15. Novák J, Ambros J, Frič J. How roundabout entry design parameters
influence safety. Transportation Research Record. 2018:0361198118776159. 16. Di Mascio P, Loprencipe G, Moretti L, Corazza MV, Vivaldi S, Vincenti G. Design of the First Italian Roundabout with Jointed Plain Concrete Pavement. Applied Sciences. 2018;8(2):283.
17. Šurdonja S, Dragčević V, Deluka-Tibljaš A. Analyses of maximum-speed
path definition at single-lane roundabouts. Journal of Traffic and Transportation Engineering (English Edition). 2018;5(2):83-95.
18. Bovy PH. Zusammenfassung der schweizerischen Kreiselhandbuchs, Straße und Verkehr, Vol. 77, No. 3. Lausanne, Schweiz. 1991:129-39.