DOES BANK OPACITY ENABLE REGULATORY FORBEARANCE?
John D. Gallemore
A dissertation submitted to the faculty of the University of North Carolina at Chapel Hill in partial fulfillment of the requirements for the degree of Doctor of Philosophy in the
Kenan-Flagler School of Business.
Chapel Hill 2013
Approved by: Edward L. Maydew Robert M. Bushman Jennifer S. Conrad Wayne R. Landsman Mark H. Lang
ABSTRACT
John D. Gallemore: Does Bank Opacity Enable Regulatory Forbearance? (Under the direction of Edward L. Maydew)
Regulators are charged with closing troubled banks, but can instead practice forbearance by allowing these troubled banks to continue operating. This paper examines whether bank opacity affects regulators’ ability to practice forbearance. Opacity inhibits non-regulator outsiders from accurately assessing bank risk, potentially allowing regulators to forgo
intervention. Employing a sample of U.S. commercial banks during the recent crisis, I find that bank opacity is positively associated with a new measure of forbearance and negatively
ACKNOWLEDGEMENTS
I am grateful for the guidance of my dissertation committee: Edward Maydew (chair), Robert Bushman, Jennifer Conrad, Wayne Landsman, Mark Lang, and Doug Shackelford. I am also appreciative for helpful comments from Jeff Abarbanell, Joshua Coyne, Eva Labro, Vivek Raval, Lorien Stice-Lawrence, Kelly Wentland, and workshop participants at the 2013 EAA Doctoral Colloquium, KU Leuven, and the University of North Carolina. I gratefully
TABLE OF CONTENTS
LIST OF TABLES ……..………...vii
CHAPTER 1: INTRODUCTION ………1
CHAPTER 2: INSTITUTIONAL BACKGROUND AND CONCEPTUAL FRAMEWORK…...7
Section 2.1: Bank Supervision and Bank Closures ...………...7
Section 2.2: Regulatory Forbearance ………...9
Section 2.3: Bank Opacity and Regulatory Forbearance ...………12
CHAPTER 3: RESEARCH DESIGN ………16
Section 3.1: Bank Opacity Proxy ………...16
Section 3.2: Regulatory Forbearance Proxy………...17
Section 3.3: Estimating the Effect of Opacity on Forbearance ………..19
Section 3.4: Sample and Descriptive Statistics ………..22
CHAPTER 4: RESULTS ………...24
Section 4.1: Effect of Opacity on Forbearance ………..24
Section 4.2: Opacity, Forbearance, and Bank Connectedness ………...24
Section 4.3: Opacity, Forbearance, and Uninsured Depositors ……….26
Section 4.4: Opacity and Bank Failures ……….26
Section 4.5: Changes in Opacity ………27
Section 4.6: Fixed Effects ………..28
Section 4.7: Simultaneity: Pre-Crisis Opacity and Instrumental Variables ………...29
Section 4.9: Additional Robustness Tests ………..33
CHAPTER 5: CONCLUSION ………...35
TABLES...……….……….37
APPENDIX: VARIABLE DEFINITIONS………49
LIST OF TABLES
Table 1: Sample Selection………..37
Table 2: Descriptive Statistics ………...38
Table 3: Forbearance Proxy ………...39
Table 4: Opacity and Forbearance ……….40
Table 5: Opacity and Forbearance by Connectedness ………...41
Table 6: Opacity and Forbearance by Uninsured Deposits………42
Table 7: Opacity and Bank Failures………...43
Table 8: Changes in Opacity and Fixed Effects ……….44
Table 9: Pre-Crisis Opacity ………45
Table 10: Instrumental Variables ………...46
CHAPTER 1: INTRODUCTION
Bank regulators are responsible for monitoring the financial sector, which includes closing troubled banks. However, regulators do not always choose to close an unsound bank, and instead practice forbearance by allowing the bank to continue operating.1 The desire to practice forbearance can stem from political pressure (Mishkin 2000; Brown and Dinç 2005), potential loss of reputation (Boot and Thakor 1993; Mishkin 2000), or concerns about the health of the financial sector (Brown and Dinç 2011; Morrison and White 2013). Forbearance allows the troubled bank to potentially escalate risk-taking or continue its existing risky behavior, which can increase the ultimate cost of resolving the bank (Santomero and Hoffman 1998). However, forbearance can be a prudent regulatory choice if the bank recovers without costly intervention (Santomero and Hoffman 1998) or if closing the troubled bank would spread problems to or undermine confidence in healthy institutions (Allen and Gale 2000; Morrison and White 2013). While academics have made progress in understanding the incentives to practice forbearance, research on regulators’ ability to forbear is scarce. Specifically, there is little empirical evidence about which bank-level factors enable regulators to apply forbearance.
In this study, I examine whether bank opacity affects regulators’ ability to practice forbearance. I define bank opacity as the extent to which financial accounting information creates uncertainty about intrinsic value (Bushman and Williams 2013). Accounting information
1 In this study, I define regulatory forbearance as the decision not to close a troubled bank. This definition is
plays an important role in the monitoring of banks by non-regulator outsiders (Bushman and Williams 2012). If a bank’s weakness is evident to non-regulator outsiders (such as depositors and the public) through accounting information, regulators could feel pressured to close the bank (Rochet 2004, 2005). On the other hand, a regulator may successfully forbear on a troubled bank if it hides its problems and risk from outsiders through opacity (Bushman and Landsman 2010).
I propose and test several hypotheses. First, I investigate whether bank opacity is associated with regulatory forbearance. Second, I examine when opacity is more important for forbearance. Allen and Gale (2000) show that when banks are connected via interbank lending, liquidity shocks (such as the failure of one bank) can cause system-wide contagion. Therefore, regulatory forbearance can prevent problems at a connected bank from spreading through the financial sector. If the ability to practice forbearance is more important when the incentives to practice forbearance are stronger, then I expect that the effect of opacity on forbearance will be greater for connected banks. Next, I test whether the effect of opacity on forbearance is different for banks with a greater proportion of deposits that are uninsured.2 Compared to insured
depositors, uninsured depositors have stronger incentives to monitor banks since a troubled bank can engage in risk shifting in hopes of achieving solvency.3 Therefore, if opacity enables
forbearance by inhibiting monitoring, then I expect that the effect of opacity on forbearance will be stronger for banks with a higher proportion of deposits that are uninsured.
To examine the effect of opacity on forbearance, I exploit variation in loan loss provisioning across banks. Loan loss provisioning is arguably the most important accounting choice for banks, as it affects the volatility and cyclicality of earnings as well as the
2
I examine uninsured depositors since they are generally the largest non-insured creditor in U.S. commercial banks.
3 On the other hand, insured depositors’ payoffs are completely fixed and thus are unaffected by the closure or
informational characteristics of the financial statements relating to loan portfolio risk (Bushman and Williams 2012). Consistent with prior research, I use the extent to which a bank delays recognizing future loan portfolio deteriorations when determining its loan loss provision as a measure of opacity (Bushman and Williams 2012, 2013). Using international data, Bushman and Williams (2012) show that delayed expected loan loss recognition (DELR) is associated with dampened disciplinary pressure on risk-taking, consistent with DELR reducing bank
transparency and inhibiting monitoring by uninsured creditors and other outsiders. Vyas (2011) finds that outsiders discover information about the loss exposure of risky assets slower for firms with less timely loan loss provisions and other write-downs during the recent crisis. Banks that under-provisioned for loan losses during the crisis likely also made other opacity-increasing accounting choices, such as failing to write down assets and using discretion in the classification of assets on the balance sheet (Huizinga and Laeven 2012). Therefore, banks that delay the recognition of expected loan losses are likely opaque along multiple dimensions, and the reduced ability of non-regulator outsiders to monitor these banks can enable regulatory forbearance.
To test my hypotheses, I examine a sample of approximately 7,000 U.S. commercial banks during the recent financial crisis. This setting has several desirable features for
investigating the effect of opacity on regulatory forbearance. First, forbearance was likely to have been practiced by U.S. regulators during the crisis (Brown and Dinç 2011). Second, there were a number of bank failures during the crisis, providing variation to empirically examine forbearance.4 Third, the sample is predominantly composed of small private commercial banks with simple business models that focus on lending, making it likely that regulators were
informed about banks’ true health and risk. Fourth, the primary non-regulator stakeholders in these banks are unsophisticated depositors such as local individuals and small businesses, who may not have been able to unravel opacity. Finally, U.S. commercial banks face a relatively homogeneous regulatory and economic environment, allowing me to more easily isolate the effect of opacity on forbearance.5
I find that opaque banks experienced greater forbearance and were less likely to fail during the crisis. The positive association between opacity and forbearance is stronger within connected banks and banks that have a greater proportion of deposits that are uninsured. Finally, I conduct a number of tests intended to further identify a causal link between opacity and
forbearance. Specifically, I measure opacity before the financial crisis as well as in first differences during the crisis, use fixed effects regression, employ instrumental variables to mitigate simultaneity concerns, and examine an alternative measure of bank-level opacity. The
4
This setting allows me to examine a much larger sample of bank failures than past studies of regulatory forbearance. For example, Brown and Dinç (2011) examine 40 bank failures. In contrast, my sample consists of 258 bank failures from 2007 to 2010.
5 Additionally, data availability permits me to control for factors likely to be important in determining bank failures,
main inferences are robust to these different specifications. Overall, the results are consistent with bank-level opacity enabling forbearance.
This study has implications for the concurrent debate regarding bank transparency. A lack of transparency has often been cited as contributing heavily to the recent financial crisis, and many have argued that the financial sector cannot function properly without a sufficient amount of disclosure (Acharya et al. 2009; Dudley 2009). However, others have suggested that bank transparency is not always desirable (Gorton 2013; Dang et al. 2013). Holmstrom (2012) and Dang et al. (2012) argue that that opacity can facilitate short-term liquidity. Morrison and White (2013) show that the public disclosure (through failure) of problems at one bank can spread uncertainty to otherwise healthy banks supervised by the same regulator. Siritto (2013) demonstrates that improving transparency can lead to a greater probability of bank runs. My results add to this debate by showing that opacity appears to be an important factor in
forbearance by regulators. If it is the case that some forbearance allows troubled banks to recover without costly intervention and inhibits the spread of uncertainty to connected but otherwise healthy banks, then these results are consistent with a social benefit from opacity.
Williams 2012, 2013). While most studies in this area document benefits of timely expected loan loss recognition, my study suggests that banks that delay recognizing expected loan losses are less likely to experience regulatory intervention. Furthermore, I examine the effect of financial accounting on regulatory choices, rather than on the bank decisions such as lending and risk-taking. Finally, my study contributes to the literature on regulatory forbearance. This literature primarily focuses on regulators’ incentives to practice forbearance. In contrast, I examine a bank-level factor, opacity, which affects the regulators’ ability to successfully practice forbearance.
The paper continues as follows. Section 2 describes institutional features of my setting and the prior research on forbearance, and explains how opacity can affect forbearance. Section 3 describes the research design and sample employed in the empirical analyses. Results and
CHAPTER 2: INSTITUTIONAL BACKGROUND AND CONCEPTUAL FRAMEWORK
In section 2.1, I provide an overview of bank supervision in the United States, including the bank closure process. Section 2.2 describes prior research on the incentives to engage in regulatory forbearance. Section 2.3 explains how opacity can potentially affect regulators’ ability to practice forbearance on individual banks.
2.1 Bank Supervision and Bank Closures in the United States
The purpose of bank supervision is to maintain the stability of both the individual bank and the overall financial sector (Federal Deposit Insurance Corporation 2003; Federal Reserve 2005).6 During the recent financial crisis, there were four national bank supervisors in the United States: the Federal Deposit Insurance Corporation (FDIC), the Federal Reserve, the Office of the Comptroller of the Currency (OCC), and the Office of Thrift Supervision (OTS).7 Each bank regulator has jurisdiction over a different subset of banks. For example, the FDIC has special supervisory authority over banks with insured deposits (Federal Reserve 2005). In some cases, supervisory duties are shared with another national regulator as well as with state supervisors.
6
For example, the FDIC states that its primary mission is to “maintain stability and public confidence in the United States financial system” and that it accomplishes this through, among other functions, the “supervision and regulation of banks and thrifts.”
7 The OTS was merged into the OCC in 2011. The OTS supervised savings banks and savings and loans
Supervision of U.S. banks is accomplished using both on-site examinations and off-site monitoring (Federal Reserve 2005).8 Off-site monitoring is primarily accomplished through the analysis of financial data reported directly to the appropriate regulator by the financial
institution. Banks are required to file call reports each quarter, which contain detailed
information on the balance sheet and recent performance. Regulators focus additional attention on problem institutions identified from the analysis of data collected from on-site inspections and call reports (Federal Reserve 2005). Thus, bank supervision is based partially on data that is private to the regulator and unobservable to depositors and the public.
Since insolvent banks can continue to operate by issuing new deposits to fund old liabilities, bank regulators are charged with closing these banks in a timely manner (Brown and Dinç 2011). The Federal Deposit Insurance Corporation Improvement Act of 1991 (FDICIA) requires U.S. bank regulators to take prompt corrective action (PCA) to resolve the problems of financial institutions. The purpose of PCA is to limit regulators’ ability to delay intervention. However, U.S. regulators still have substantial flexibility as to when to close a troubled financial institution (Edwards 2011). Banks are generally deemed to be in “unsafe or unsound” condition, and thus eligible to be closed by regulators, if their tier 1 capital ratio is less than two percent. However, a regulator can allow a bank with a tier 1 ratio below two percent to continue operating if the bank has entered into a written agreement with the regulator detailing how the bank will remedy its capital situation.9 Furthermore, regulators can influence bank accounting, allowing
8 Bank inspections are thorough, and the time spent on them can extend to over two months in addition to on-site
work for poorly rated institutions (Office of Inspector General 2012). These inspections, in combination with data submitted directly to the regulator by the bank, are used by regulators to generate CAMELS ratings which classify banks according to risk exposure. Banks’ CAMELS ratings are not publicly disclosed by regulators, and constitute part of their private information set.
9 Additionally, regulators can also choose to close a bank that has a tier 1 ratio above two percent if they deem the
them to prevent banks from crossing thresholds that would require regulatory intervention and inhibiting market discipline of regulatory forbearance (Bushman and Landsman 2010).
The FDIC is the U.S. regulator responsible for the resolution of failed banks (Federal Deposit Insurance Corporation 2003). When a regulator decides to close a bank, it notifies the FDIC which devises a plan for resolving the bank and sends personnel to maintain the bank’s day-to-day operations. Eventually, the FDIC either arranges for a healthier bank to acquire the troubled bank, or it liquidates the bank, paying off all insured deposits and some portion of the uninsured deposits (Federal Deposit Insurance Corporation 2003).10
2.2 Regulatory forbearance
Although regulators are tasked with the timely resolution of insolvent financial
institutions, prior research has documented various reasons why regulators may instead practice forbearance by allowing weak banks to continue operating. First, forbearance is often discussed as a practical element of the lowest cost solution for dealing with troubled banks. Intervention is costly, and regulators can forbear on a troubled bank in order to allow the bank time to recover without having to incur these costs (Santomero and Hoffman 1998; Brown and Dinç 2011). For example, the manpower necessary to close a bank constitutes a significant cost to regulators. When the FDIC decides to close a bank, it must send a team of employees to assume the bank’s day-to-day operations. Even for small banks, this cost can be quite large: for example, in 2009, the FDIC sent a team of approximately 80 agents to take over the Bank of Clark County, which had only 100 employees (Joffe-Walt 2009). Direct costs can also include bankruptcy costs and lower asset values due to fire sales (Brinkmann et al. 1996). Many of these direct costs are likely
10 For a complete overview of the bank resolution process, see the FDIC resolution handbook:
heightened during crisis periods (Santomero and Hoffman 1998).11 However, forbearance can also increase the ultimate cost of resolving the bank, since it creates a moral hazard for bank management (Santomero and Hoffman 1998). Managers at a troubled bank have incentives to increase risk-taking since they do not share in losses but benefit from achieving solvency. The high risk strategies will likely lead to higher closure costs for the regulator if the bank fails.
Second, some research suggests that forbearance can be a prudent regulatory policy from an overall welfare perspective. The closure of a troubled bank can lead to concerns about the soundness of connected institutions. Allen and Gale (2000) show that an unanticipated liquidity shock (such as the failure of a bank) can cause system-wide contagion, as problems spread from the failed bank to other banks connected through intra-bank lending and borrowing. In the model put forth by Diamond and Rajan (2005), bank failures can be contagious because they shrink the available pool of liquidity, creating or exacerbating aggregate liquidity shortages. Morrison and White (2013) demonstrate that a similar effect can occur when banks are connected by regulator, as the failure of one institution can lead outsiders to lose confidence in other banks supervised by the same regulator. In both cases, regulators can opt to forbear on troubled banks to prevent the liquidity shock or uncertainty from spreading to the rest of the financial sector. Concerns about the general state of the banking sector can also lead regulators to practice forbearance.
Regulators may not be able, nor willing, to close the entire banking sector during a financial crisis (Santomero and Hoffman 1998). Forbearance could therefore be necessary if a large number of banks are insolvent. Brown and Dinç (2011) find that regulators are more likely to practice forbearance during crisis periods, which they refer to as the Too-Many-to-Fail effect. Furthermore, regulators may prefer forbearance if the banking sector’s problems begin to
11 For example, asset values are more likely to be depressed during a crisis period, meaning that fire sales will be
threaten the viability of the deposit insurance fund. For example, in the United States, the FDIC and the FSLIC have been known to practice forbearance in response to concerns about deposit insurance (Federal Deposit Insurance Corporation 1997; Santomero and Hoffman 1998).12
Finally, forbearance may be a result of the principal-agent problem, where regulators (the agent) do not have the same incentives as taxpayers (the principal). For example, the closure of a bank could signal to depositors and the public that the regulator is of low quality (Boot and Thakor 1993). A failed bank could lead to the regulator being blamed for poor performance, and thus by pursuing forbearance regulators can hope the situation will improve to escape culpability (Kane 1989; Mishkin 2000). Regulators also face pressure from politicians, who strongly
influence their careers and prefer the appearance of a strong banking sector (Kane 1989; Mishkin 2000; Brown and Dinç 2005). These self-interested concerns will lead the regulator to forgo closing troubled banks, even if bank closure was desirable from the perspective of the taxpayers.
While prior research has established that regulators sometimes practice forbearance, non-regulator bank stakeholders such as depositors have different incentives.13 Given the debt-like nature of their payoffs, depositors likely prefer timely intervention into troubled banks.14 Depositors place funds in a bank expecting to have the ability to withdraw them whenever they choose (Santomero and Hoffman 1998). If a bank exhibits weakness, depositors will become
12 Alternatively, the FDIC may have had stronger incentives not to forbear in order to limit losses to the deposit
insurance fund during the recent crisis.
13
I use the terms “non-regulator stakeholders” and “outside stakeholders” to refer to non-equity holders such as depositors and the general public. Note that while I generally focus on depositors, the general public may also be concerned about bank insolvency since bank weakness can spread throughout the financial sector. Thus, the general public may desire early regulatory intervention. For the purposes of this classification, I group equity stakeholders along with management, since in the small, primarily private banks I examine in this study, they likely are the same.
14 One exception is if the bank’s condition is so poor that uninsured depositors are not likely to receive any funds
concerned about their ability to withdraw funds. In the extreme, this concern about the bank’s viability can cause a run on the bank’s deposits (Diamond and Dybvig 1983). While this concern is stronger for uninsured depositors who stand to lose their funds if the bank continues to shed value, recent research suggests that even insured depositors may run from a troubled bank (Davenport and McDill 2006; Iyer and Puri 2012; Iyer et al. 2013). Furthermore, troubled banks have incentives to increase risk-taking, shifting value from depositors to equity holders
(Santomero and Hoffman 1998). Timely regulatory intervention into a troubled bank can prevent further erosion of enterprise value and minimize the loss of depositor funds.
2.3 Bank opacity and regulatory forbearance
While academics have examined the incentives to engage in forbearance, little attention has been paid to the ability to practice forbearance. One potential bank-level factor that can influence the regulators’ ability to practice forbearance is the opacity of the bank’s information environment. The third pillar of Basel II discusses market discipline, specifically the role non-regulator bank outsiders play in the supervision of financial institutions. Using the Basel II framework, Rochet (2004) and Decamps et al. (2004) analytically show that market discipline can limit forbearance. If non-regulator stakeholders act as if the bank is troubled (e.g., if depositors withdraw funds), regulators can be forced to intervene into the bank as forbearance becomes too costly for the regulator and/or government. Therefore, a regulator’s ability to engage in forbearance is a function of monitoring by non-regulator stakeholders (Rochet 2005).
Prior research indicates that while depositors monitor banks (Peria and Schmukler 2001; Iyer et al. 2013), they can be fooled by bank opacity. Iyer et al. (2013) use micro-level depositor data for a bank in India to examine whether depositors monitor banks.15 They show that after a regulatory audit found the bank to be insolvent, depositors began to withdraw funds even though the results of the audit were not publicized, which they interpret as evidence of monitoring by depositors. The audit discovered that the bank’s financial statements for the prior two years did not reflect the true extent of the bank’s problems. Noting that there was no run on deposits prior to the regulatory audit, the authors conclude that while depositors monitored the bank (evidenced by their knowledge of the supposedly private regulator audit), they were unable to deduce the bank’s problems from its previously released financial accounting information.16
This suggests that bank opacity can prevent non-regulator outsiders from effectively monitoring and therefore allow the regulator to practice forbearance.17
Other studies suggest that opacity could enable regulators to engage in forbearance. Huizinga and Laeven (2012) document that publicly traded U.S. bank holding companies increased opacity by understating loan loss provisions and other write-downs during the recent crisis. They suggest that regulators may have been complicit in allowing banks to increase
15 The authors argue that the bank they investigate is very similar to the small U.S. commercial banks examined in
this study in terms of its business model and funding (in that both primarily involve individuals and small businesses in the local area).
16 Depositors may not have run during this period because they were being compensated for their risk exposure.
However, the authors show that depositors were not receiving higher interest rates during this period, consistent with them being unaware of both the bank’s problems as well as the hiding of those problems through opacity.
17 This raises the question: why do we observe depositors (especially uninsured accounts) in opaque banks? First,
opacity so that they were not forced to intervene. Skinner (2008) provides evidence that Japanese regulators altered financial accounting standards in a way that allowed troubled banks to appear well-capitalized during its banking crisis in the late 1990s.18
In summary, if a bank exhibits risk and weakness through its financial accounting information, regulators could feel pressured to intervene in a timely manner. On the other hand, if a bank conceals its troubles through opacity, regulators should be better able to practice forbearance. This leads to the first hypothesis (stated in the alternative):
H1: Bank opacity is positively associated with regulatory forbearance
The ability to practice forbearance should matter more when the incentives to practice forbearance are stronger. As discussed in section 2.2, forbearance can be a prudent regulatory policy if the failure of one institution can lead to liquidity problems at otherwise healthy institutions that were connected financially to the troubled bank. If bank opacity enables forbearance, and regulators have stronger incentives to forbear on connected banks, then the relation between bank opacity and forbearance should be stronger for these banks. This serves as the basis for the second hypothesis (stated in the alternative):
H2: The positive association between bank opacity and regulatory forbearance is stronger for connected banks
Opacity enables forbearance by inhibiting outside monitoring. As mentioned above, uninsured depositors have strong incentives to monitor banks since troubled banks may increase risk shifting in an attempt to achieve solvency, which can erode enterprise value and depositor funds. On the other hand, insured depositors’ payoffs will not change regardless of whether the bank is closed or allowed to continue operating, and therefore insured depositors should be less
18 Blacconiere (1991) and Blacconiere et al. (1991) examine the market reaction to and use of Regulatory
likely to monitor. If opacity disguises forbearance from outside monitoring, then the opacity should play a stronger role in forbearance when a greater proportion of deposits are uninsured. This leads to the third hypothesis (stated in the alternative):
CHAPTER 3: RESEARCH DESIGN AND SAMPLE
3.1 Bank opacity proxy
I employ delayed expected loan loss recognition (DELR) as my proxy for bank opacity (Bushman and Williams 2012, 2013). DELR captures the extent to which bank managers incorporate expected future loan losses when determining the current period’s loan loss
provision. As mentioned earlier, loan loss provisioning is a key accounting choice for banks, as it affects characteristics of earnings and the informational aspects of financial statements relating to loan portfolio risk (Bushman and Williams 2012). Furthermore, delaying the recognition of expected loan losses forces the reported capital ratio to cover both expected and unexpected losses, thus decreasing transparency due to the uncertainty regarding the ability to absorb losses (Bushman and Williams 2013).19 Prior research has shown that delayed loan loss provisioning is associated with diminished outside monitoring, consistent with it reducing bank transparency (Vyas 2011; Bushman and Williams 2012). Furthermore, banks that under-provisioned for loan losses during the crisis made other opacity-increasing accounting choices (Huizinga and Laeven 2012). Thus, a bank with high DELR is likely opaque along multiple dimensions.
I follow prior literature in measuring DELR (Beatty and Liao 2011; Bushman and Williams 2013). I first estimate the following two regressions over the past 20 quarters for each bank in my sample, requiring a minimum 12 quarters of non-missing data for each bank:
(1)
19 Bank capital is generally viewed as providing a buffer against unexpected losses, while loan loss provisioning is
(2)
LLP is the bank’s loan loss provision scaled by total loans. ΔNPL is the change in
non-performing loans scaled by total loans. Tier 1 Ratio and Size are the bank’s tier 1 capital ratio and natural logarithm of total assets at the beginning of the period, respectively. EBLLP is the bank’s pre-tax earnings before the loan loss provision deduction.
Expected loss recognition (ELR) is the adjusted R-squared from model 2 minus the adjusted R-squared from model 1, and thus captures the incremental explanatory power of future and current changes in the non-performing loans ratio for the current loan loss provision. I multiply ELR by negative one to create DELR, my proxy for delayed expected loan loss recognition. I also employ High DELR, which is an indicator equal to one if DELR is greater than or equal to zero, and zero otherwise.
3.2 Regulatory forbearance proxy
While regulators generally announce when a bank is being closed, they do not publicly disclose the decision to forbear on a particular bank. Prior studies examine the likelihood of bank failure as a means of measuring regulatory forbearance; however, this approach does not capture important differences in intensity of the application of forbearance. For example, a regulator applies considerably more forbearance by choosing not to close a troubled bank than by allowing a reasonably healthy bank to stay open. Therefore, I create a continuous measure of forbearance that captures the extent to which regulators apply forbearance on a bank in the following year.
I first estimate the following regression over the entire sample:
Equation 3 models a bank failure indicator variable (Fail) as a function of the bank’s tier 1 capital ratio (Tier 1 Ratio) and non-performing loans ratio (NPL). These variables are
commonly used measures of bank health, and prior research has found them to be strong predictors of bank failure (Wheelock and Wilson 2000; Lu and Whidbee 2012). Tier 1 Ratio is the main measure of bank health used by regulators. Maintaining a tier 1 ratio below required levels is the primary reason for bank closure. Since Tier 1 Ratio can be affected by accounting discretion, I also include NPL as a proxy for the quality of the bank’s loan portfolio.20 Banks with more loans classified as non-performing have a greater likelihood of incurring losses and experiencing insolvency, since their primary assets are not generating income. From this regression, I create a predicted probability of being closed in the following year for each bank-year (Failure Probability). This predicted probability is an ex post assessment of the likelihood of failure based on observable summary measures of bank health.
My proxy for forbearance, Forbear, is measured as: { }
Intuitively, this measure captures the weakness of a bank (as measured by predicted failure probability) that is not closed in the following year. Forbear will be higher for banks with a greater predicted probability of failing in the following year, but that were ultimately not closed by regulators. On the other hand, Forbear will be lower for banks that had a low likelihood of failing in the following year and did not fail (healthy banks that did not need forbearance) and banks that ultimately failed (troubled banks on which regulators did not practice forbearance).
20 While NPL is unaffected by accruals-based earnings management, it can be affected by real earnings management.
As noted above, prior empirical studies on forbearance (e.g., Brown and Dinç (2011)) examine bank failures and interpret negative associations between the probability of failing and the variable of interest (e.g. the health of the banking sector) as forbearance. I also examine whether opacity is negatively associated with the probability of being closed by regulators during the following year, consistent with opacity enabling regulators to delay intervention.
3.3 Estimating the effect of opacity on forbearance
To examine the relation between opacity and regulatory forbearance, I estimate the following model using OLS regression:
∑ (4) As discussed above, my primary measure of regulatory forbearance is Forbear and my opacity proxy is DELR.21 To mitigate endogeneity concerns and to be consistent with recent research on transparency (Lang and Maffett 2011; Maffett 2012), I measure DELR and control variables with a lag.22 Since Forbear represents the forbearance applied to the bank in year t+1, the coefficient on DELR represents the effect of opacity on forbearance in the following year. If opacity enables forbearance, I expect that the coefficient on DELR will be positive.
I include an extensive set of control variables that likely determined bank weakness and regulatory interventions during the recent financial crisis: the natural logarithm of total assets (Size), total loans scaled by total assets (Loans), annual return on assets (ROA), the standard deviation of quarterly return on assets over the prior 12 quarters (ROA Volatility), the ratio of cash to deposits (Liquidity), the ratio of 100 percent risk-weighted assets to total risk-weighted assets (Asset Risk), the loan loss reserve scaled by total loans (Loan Loss Reserve), the loan loss
21 Since the calculation of DELR requires next quarter’s change in NPL ratio, I calculate DELR using loan loss
provision data for the 20-quarter window ending in the third quarter of year t. If I included the fourth quarter’s loan loss provision in this calculation, DELR would be missing for banks that failed early in the subsequent year.
provision scaled by total loans (Loan Loss Provision), and the percentage of the loan portfolio composed of certain loan types (Real Estate Loans, Consumer Loans, Agriculture Loans, and Commercial Loans). I also include regulator and U.S. census region fixed effects to control for incentives to practice forbearance that may vary by regulator or region.23
To examine whether the relation between opacity and regulatory forbearance is stronger for connected banks (H2), I add to equation 4 the interaction terms of DELR and measures of bank connectedness, and estimate the following regression:
∑ (5) To measure a bank’s connectedness, I employ measures that are based on (1) intra-bank financing activity and (2) size. Regulators would likely prefer to delay intervening into banks that were connected to other banks through intra-bank borrowing and lending. Allen and Gale (2000) show that liquidity shocks (such as the failure of a bank) can spread throughout the financial sector if banks are connected by lending and borrowing. Acharya et al. (2009) argue that the government bailed out Bear Stearns in 2008 because “it was a major player” in the intra-bank borrowing and lending market. Consistent with prior research, I employ intra-intra-bank
financing activity as a proxy for connectedness (Allen and Gale 2000; Brown and Dinç 2011). Intra-bank borrowing and lending is generally accomplished using repurchasing and reselling agreements, respectively. My first measure of connectedness is High BorrowLend, an indicator variable equal to one if the bank has both repurchase agreements and reselling agreements (both scaled by total assets) above the median of all banks, and zero otherwise. Connectedness is also likely increasing in size. During the crisis, it was asserted that certain banks were considered
23 I do not include Tier 1 Ratio and NPL when Forbear is the dependent variable, but I do include them when
“too big to fail” since they were so large and interconnected that their failure would be disastrous for the rest of the financial sector (Acharya et al. 2009). Therefore, I also use High Size, an indicator equal to one if the bank has total assets above the sample median and zero otherwise.
I first estimate equation 4 separately for connected banks and non-connected banks (where connectedness is measured by High BorrowLend and High Size). This allows me to hold the incentives to forbear relatively constant within each sample, and isolate the effect of opacity on the ability to practice forbearance. I estimate equation 5 over the full sample, including interaction terms between DELR and the two connectedness measures, to test whether the ability to practice forbearance as provided by opacity is more important where incentives are strongest. I predict that the coefficients on the interactions between DELR and High BorrowLend and between DELR and High Size should be positive.
To examine whether the relation between opacity and regulatory forbearance varies by the proportion of deposits that are uninsured (H3), I add to equation 4 the interaction terms of DELR and an indicator variable that captures whether the bank has a relatively greater amount of uninsured deposits, and estimate the following regression for each regulator:
∑ (6) To measure whether a bank has a relatively high proportion of uninsured deposits, I
ideally would estimate the ratio of uninsured deposits to total deposits at year-end.
the sample median as of year-end 2005, and zero otherwise. If regulators have a greater need for opacity in order to successfully forbear on banks with a higher proportion of uninsured deposits, then the coefficient on the interaction of DELR and High Uninsured should be positive.
3.4 Sample and descriptive statistics
This study employs a sample of small, primarily private U.S. commercial banks during the recent financial crisis. This setting has several advantageous features for testing the effect of opacity on forbearance. First, U.S. bank regulators likely practiced forbearance during the recent crisis (Brown and Dinç 2011). The OCC has even acknowledged that it practiced forbearance (Rapoport 2013). Second, there were a number of bank failures during this period, providing the variation needed to examine forbearance. Third, these banks have simple business models; they use depositor funds to create loans. Thus, it is likely that regulators were aware of bank risk, suggesting that the decision not to intervene is attributable to forbearance rather than ignorance. A government report issued after the crisis stated that regulators were slow to intervene in weak banks despite being aware of troubles (GAO 2011). Fourth, the dominant non-regulator
stakeholders in these banks are unsophisticated depositors, such as local individuals and small businesses, who are unlikely to be able to fully unravel opacity. Finally, banks in my sample face a relatively similar economic and regulatory environment, which allows me to better identify the effect of opacity on forbearance.
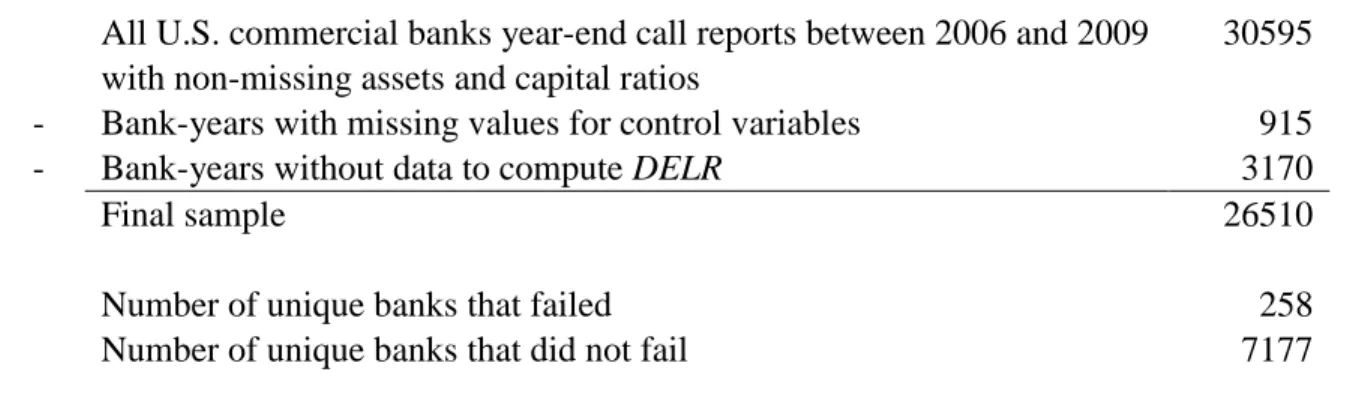
I gather call report data from the Federal Reserve Bank of Chicago website and bank failure data from the FDIC website. Accounting and regulatory data is measured annually from 2006 to 2009, and bank failures are measured from 2007 to 2010.24 To make the final sample, a bank-year observation must have non-missing values for DELR and each control variable. Table
24 I do not observe any bank failures in 2005 or 2006, and thus I measure bank failures beginning in 2007. This
1 describes the composition of the final sample. The biggest cause of sample attrition is the data requirements for the computation of DELR.25 The final sample contains 26,510 bank-years representing 7,435 unique commercial banks, 258 of which failed during the sample period.
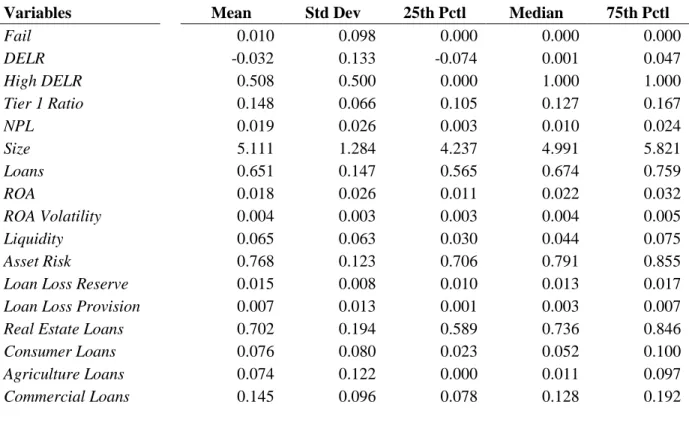
Table 2 contains the descriptive statistics for the sample.26 Approximately 1 percent of bank-years were followed by the bank’s closure. The median amount of assets in the sample is $147 million, and 92 percent of the bank-years had assets under $1 billion. Untabulated statistics show that the median loans to assets ratio in my sample is 0.67 and the median deposits to assets ratio is 0.84, consistent with the sample being mainly populated by small commercial banks focusing on a traditional “deposits and loans” business model.
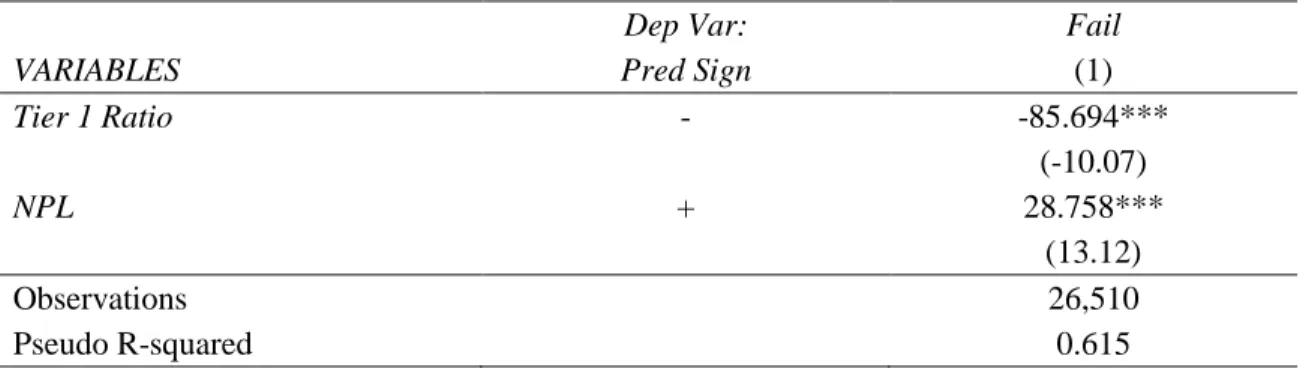
Table 3 presents the results of estimating equation 3 using logistic regression with Fail as a function of Tier 1 Ratio and NPL in panel A, and the descriptive statistics for Forbear in panel B. As shown in panel A, the coefficient on Tier 1 Ratio is negative and highly significant, indicating that banks with higher capital ratios were much less likely to fail. NPL exhibits a strongly positive coefficient, consistent with a poorer quality loan portfolio leading to a higher probability of failure.
25 Banks with missing values for DELR are generally de novo banks (commercial banks in operation for five years
or less) without a sufficient history to estimate DELR. Their failure rate during the crisis was not different from banks included in the final sample.
CHAPTER 4: RESULTS
4.1 Effect of opacity on forbearance
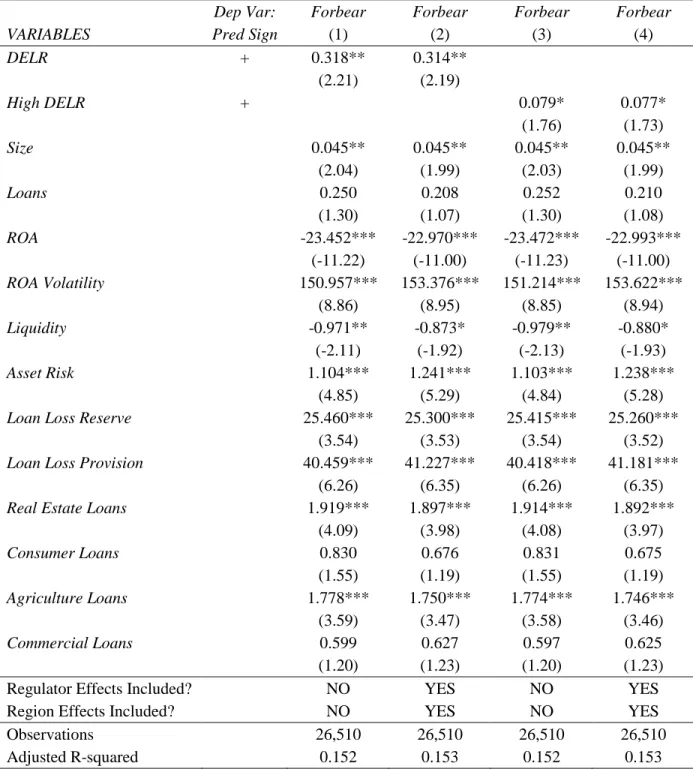
First, I test whether opacity is associated with greater forbearance (H1). Table 4 presents the estimation of equation 4 using OLS with Forbear as the dependent variable and DELR as the opacity proxy in columns 1 and 2.27 The estimation in column 1 includes the full set of control variables, and the estimation in column 2 contains both the set of control variables as well as regulator and region fixed effects. Both models have decent explanatory power (adjusted R-squared of approximately 0.15). Several variables that capture bank risk are positively associated with Forbear, including ROA Volatility and Asset Risk. Banks that were more profitable and more liquid (as measured by higher values of ROA and Liquidity) were less likely to experience forbearance. The variable of interest, DELR, exhibits a positive and significant coefficient in both models (p-value of 0.03), indicating that opacity is associated with greater forbearance. I repeat these analyses using High DELR instead of DELR in columns 3 and 4, and find similar results. Overall, the results in table 4 are consistent with opacity enabling forbearance.
4.2 Opacity, forbearance, and bank connectedness
Next, I examine whether the positive association between opacity and forbearance is stronger for connected banks, consistent with regulators preferring to forbear on connected banks (H2). This analysis is presented in table 5; panel A (panel B) displays the results employing High
27
BorrowLend (High Size) as the measure of connectedness. For brevity, only the coefficients on the variables of interest are reported. Column 1 of panel A contains the estimation of equation 4 within bank-years classified as having both high borrowing and high lending activity (High BorrowLend equal to one). DELR exhibits a strong positive association with Forbear within this subsample (p-value of 0.02). Column 2 presents the estimation of equation 4 within the
subsample of bank-years with a High BorrowLend value of zero. While DELR is positively associated with Forbear in this subsample, the coefficient is not statistically significant at conventional levels (p-value of 0.16). Finally, column 3 presents the results of estimating equation 5 over the entire sample. Both the interaction of DELR and High BorrowLend and the sum of the coefficients on DELR and the interaction term are significantly positive. The main effect of DELR on Forbear is positive but not significant, consistent with the results in column 2.
Panel B repeats the analysis in panel A using High Size as the proxy for connectedness. The results are broadly similar to those presented in panel A. DELR exhibits a positive
4.3 Opacity, forbearance, and uninsured depositors
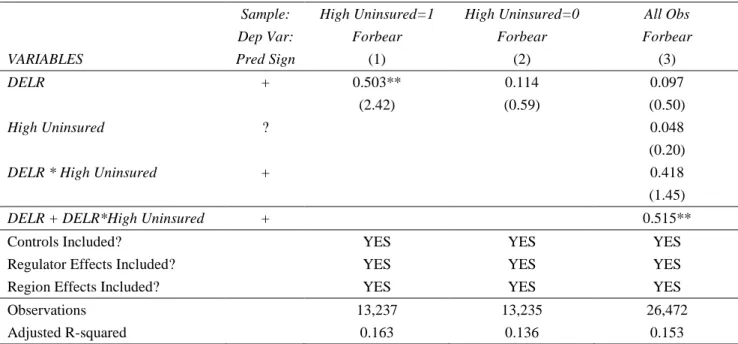
In table 6, I examine whether the effect of opacity on forbearance varies by the
proportion of deposits that are uninsured. Column 1 contains the estimation of equation 4 within bank-years that have a ratio of uninsured deposits to total deposits above the sample median (High Uninsured equal to one). The coefficient on DELR is strongly positive in this subsample (p-value of 0.02). Column 2 presents this same estimation within bank-years having a High Uninsured value of zero. While DELR is positively associated with Forbear in this subsample, the coefficient is not statistically significant. Finally, column 3 presents the results of estimating equation 6 over the entire sample. The interaction of DELR and High Uninsured is positive although not significant at conventional levels (p-value of 0.15). However, the sum of the
coefficients on DELR and the interaction term is highly significant (p-value of 0.01). Overall, the results in table 6 are consistent with opacity being an important factor in regulators’ ability to practice forbearance on banks with a greater proportion of deposits that are uninsured, since these depositors are more likely to monitor the bank.
4.4 Opacity and bank failures
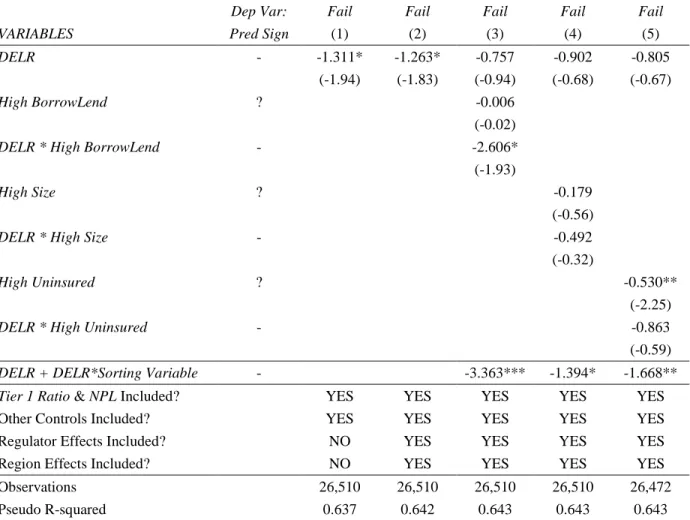
Brown and Dinç (2011) empirically examine regulatory forbearance using the incidence of bank failures. To examine the robustness of my results to this approach, I estimate versions of equations 4, 5, and 6 with Fail instead of Forbear as the dependent variable using logistic regression.28 Table 7 displays the results of these regressions; for brevity, I do not report the coefficients on the control variables or fixed effects. The model in column 1 contains the full set of control variables including Tier 1 Ratio and NPL, but does not include regulator and region fixed effects. The coefficient on DELR is negative and statistically significant (p-value of 0.05),
28 Additionally, examining bank failures confirms that DELR is not simply associated with a higher incidence of
indicating that opaque banks were less likely to fail during the crisis. DELR continues to exhibit a negative and significant coefficient when regulator and region fixed effects are added in column 2. Based on the coefficient in column 2, the average marginal effect (AME) of a one-standard deviation change in DELR is -0.1 percent, which is 10 percent of the sample mean. For comparison, the AME for a one-standard deviation change in Tier 1 Ratio (NPL) is -2.4 percent (0.3 percent) (results untabulated). Therefore, although primary measures of bank health such as Tier 1 Ratio and NPL exhibit stronger associations with the probability of failure, DELR exhibits an economically significant association with bank failures during the crisis.
I also re-estimate the analyses in tables 5 and 6 using Fail instead of Forbear. The interaction term of DELR and High BorrowLend as well as the sum of the coefficients on DELR and the interaction term are negative and statistically significant in column 3, consistent with the results in panel A of table 5. The coefficients on the interaction terms in columns 4 (DELR*High Size) and 5 (DELR*High Uninsured) are negative but not significant. However, similar to the results in panel B of table 5 and table 6, the sum of the coefficients on DELR and the interaction terms in these two columns is significantly negative. The cross-sectional results in columns 3, 4, and 5 are largely similar to those presented in tables 5 and 6. Coupled with the findings presented in tables 4, 5, and 6, these results suggest that DELR exhibits a strong positive association with Forbear and a negative association with actual bank failure. This pattern is consistent with opacity enabling regulators to allow troubled banks to continue operating.
4.5 Changes in opacity
during the crisis, as it allowed regulators to avoid intervention. This suggests that changes in opacity should affect the regulators’ ability to practice forbearance during the crisis. To examine this, I estimate three different versions of equation 4. The first three panels of Table 8 contain the results from this analysis, where only the coefficients of interest are reported for brevity. First, I replace DELR with ΔDELR, which is measured as this year’s DELR minus last year’s DELR. Panel A presents the results of estimating equation 4 with ΔDELR and other variables in levels. The coefficient on ΔDELR is significantly positive (p-value of 0.02). Second, I estimate a fully first differenced version of equation 4, where each variable is measured as the change over the current year. Panel B of table 8 contains the results from the fully first differenced specification. The coefficient on ΔDELR remains positive and significant (p-value of 0.02).29
Third, I estimate equation 4 using Fail as the dependent variable and ΔDELR as the opacity proxy. Again, I find similar results to those presented in table 7; the coefficient on ΔDELR in panel C is negative and statistically significant (p-value of 0.08). Overall, the results in table 8 are consistent with changes in opacity increasing regulators’ ability to practice forbearance.
4.6 Fixed effects
There are likely bank-level factors that could drive the choice of opacity as well as the regulator’s decision to forbear on or intervene in the bank. However, many potential correlated omitted variables would actually suggest a negative relation between opacity and forbearance. For example, bank management quality could represent a bank-level factor that affects opacity and forbearance. More capable bank managers are likely better at forecasting and recognizing expected loan losses, and regulators will be more likely to forbear on banks run by quality management since these banks will have a greater chance of recovering without costly
29 The sample size decreases for this test since Forbear is not defined before 2006 (as there were no failures in the
intervention.30 Similarly, regulators may be more confident in a bank’s ability to improve without intervention if it has a high quality internal information environment, and these banks are likely better able to provide transparency. While the fully first differenced test in panel B of table 8 suggests that unobservable bank-level characteristics are not responsible for my results, I provide additional assurance that the results above are not caused by a correlated omitted
variable by re-estimating the main forbearance regression (equation 4) using fixed effects regression. The results of this estimation are presented in panel D of table 8, where only the coefficient on DELR is presented for brevity. Despite the few observations per bank in the sample period, the coefficient on DELR remains positive and significant, suggesting that unobservable bank-level characteristics that are constant across the sample period are not responsible for the positive association between opacity and forbearance.
4.7 Simultaneity: pre-crisis opacity and instrumental variables
Since regulators can influence the choice of bank opacity, the previously documented association between opacity and forbearance could be attributed to either explicit or implicit collusion between the regulator and bank management. Prior research has shown that bank regulators have altered financial accounting at the industry level, a form of explicit collusion that enabled regulatory forbearance (Skinner 2008). Regulators can also directly affect bank-level accounting (Curry et al. 1999), and during the crisis they may have instructed banks to increase opacity to enable forbearance. Regulators could also affect opacity through implicit collusion by allowing banks to misreport without intervening (Huizinga and Laeven 2012). Since collusion suggests that regulators influence both the choice of bank opacity and forbearance, my results could be attributed to simultaneity.
30 Of course, bank management can turnover and thus bank management quality is not a permanent bank
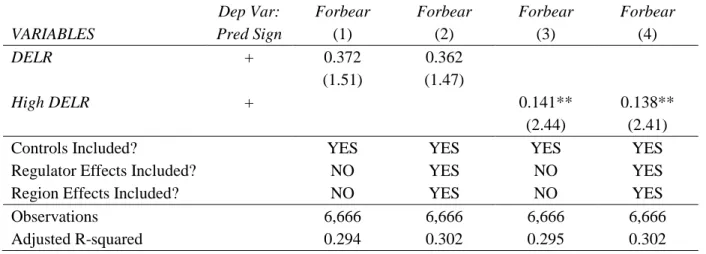
I conduct two tests to examine whether simultaneity is wholly responsible for the positive relation between opacity and forbearance. First, I examine the effect of pre-crisis opacity on forbearance and the probability of failure during the crisis. If regulators did not anticipate the crisis, then they likely did not influence pre-crisis opacity out of a desire to enable forbearance. A positive relation between pre-crisis opacity and forbearance would be consistent with opacity enabling regulators to practice forbearance. Furthermore, pre-crisis opacity likely led
non-regulator stakeholders to incorrectly assess the bank’s risk and solvency at the onset of the crisis. According to the Federal Reserve Bank of St. Louis’ crisis timeline, the first signs of the recent crisis occurred in early 2007.31 Therefore, I estimate a cross-sectional version of equation 4 measuring DELR and High DELR, as well as the rest of my control variables, at year-end 2006. I measure Forbear and Fail as the forbearance and likelihood of failure during the entire crisis period (2007 to 2010), respectively.32 The results of this analysis are presented in table 9, with Forbear (Fail) as the dependent variable in panel A (panel B). Although the coefficient on DELR is positive in panel A, it is not statistically significant at conventional levels (p-value of 0.14). However, the coefficient on High DELR is positive and statistically significant (p-value of 0.02). In the failure regressions in panel B, both DELR and High DELR exhibit strong negative
associations with the probability of failing during the crisis (p-values of 0.01 and 0.04, respectively). Assuming that regulators were not influencing pre-crisis opacity to enable
forbearance during the crisis, these results suggest that simultaneity is not wholly responsible for the positive association between opacity and forbearance. Furthermore, they are consistent with pre-crisis opacity enabling regulatory forbearance.
31
http://timeline.stlouisfed.org/
32 In this analysis, Fail is defined as an indicator variable equal to one if the bank failed during the crisis (2007 to
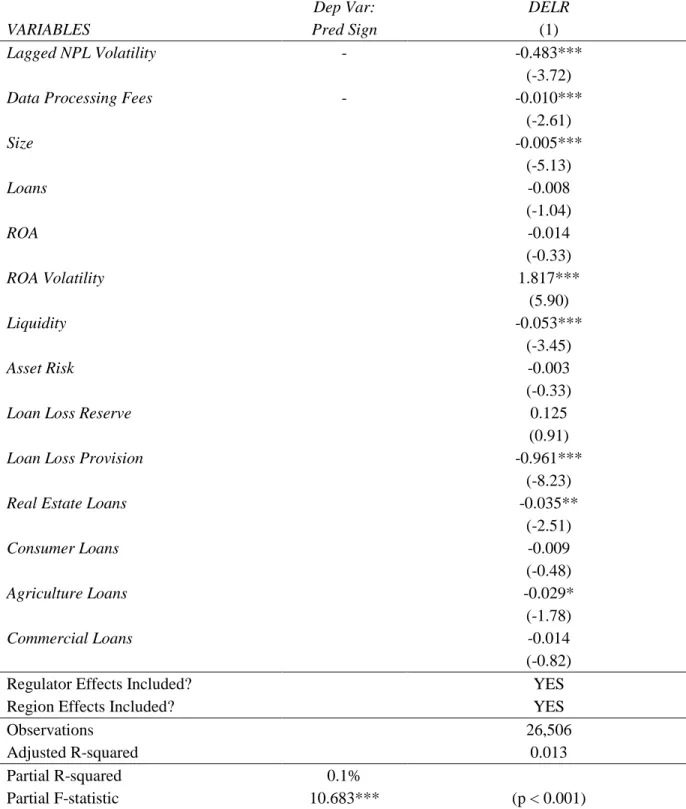
I also employ instrumental variables to mitigate endogeneity concerns. My first
instrument is Lagged NPL Volatility, which is measured as the standard deviation of NPL for the 20 quarter period from years t-3 to t-7.33 I expect that banks with greater uncertainty regarding loan portfolio quality will reserve more for future loan portfolio deteriorations. Therefore, I predict a negative association between DELR and Lagged NPL Volatility. This measure may be correlated with bank risk, which could affect forbearance and bank failure. However, I already include a more current measure of bank risk, ROA Volatility, as well as other variables that capture the riskiness of the bank’s assets (Asset Risk) and exposure to risk factors specific to the recent crisis such as the real estate market (Real Estate Loans). Furthermore, this variable is measured using only pre-crisis years, and thus will be unaffected by volatility in the
non-performing loans ratio during the crisis. My second instrument is Data Processing Fees, which is the natural logarithm of the average quarterly data processing fees in that year. I expect that banks that are engaging outside contractors for data processing services are attempting to better anticipate loan portfolio quality changes, allowing them to incorporate them in the current period’s loan loss provision. Therefore, I predict a negative association between DELR and Data Processing Fees. Banks that spend more on data processing may exhibit better performance or could be attempting to remedy poor past performance, which in turn can influence the regulator’s forbearance decision. However, I directly control for profitability (ROA) in both stages.
The first stage regression, estimating DELR as a function of the two instruments and other control variables, is presented in panel A of table 10. Both Lagged NPL Volatility and Data Processing Fees exhibit strong negative associations with DELR. The partial R-squared is 0.1 percent, and the partial F-statistic is 10.68 (p-value < 0.001). This partial F-statistic is greater than the Stock and Yogo (2001) and Stock et al. (2002) critical value for a 5 percent confidence
threshold for 20 percent size distortion, but slightly less than the critical value for a 15 percent size distortion. Thus, these two variables appear to be relatively strong instruments for DELR. Panel B of table 10 presents the second stage regression of the fitted value of DELR on Forbear. For brevity, I only report the coefficient on the fitted value of DELR, which remains positive and significant (p-value < 0.01). Compared to the OLS results, the coefficient on the fitted value of DELR is larger, but this is driven by the smaller standard deviation of the fitted variable.34 An overidentification test fails to reject the null that the instruments are not correlated with the error term in the second stage, and a Hausman test suggests that DELR suffers from endogeneity (p-value < 0.001). Overall, the results in tables 9 and 10 suggest that simultaneity is not entirely responsible for the positive relation between opacity and forbearance.
4.8 Alternative opacity measure
I employ DELR for my primary tests since prior research suggests that the underreporting of expected loan losses will reduce the ability of non-regulator stakeholders to monitor the bank (Bushman and Williams 2012) and thus enable regulators to practice forbearance. I examine the robustness of my inferences to an alternative opacity proxy which captures the propensity to use discretion in the determination of the loan loss provision to smooth earnings. Huizinga and Laeven (2012) find that banks that historically engaged in discretionary loan loss provisioning were slow to recognize losses during the crisis. Bushman and Williams (2012) find that discretionary loan loss provisioning is associated with weaker bank monitoring.
To estimate discretionary loan loss provisioning, I estimate the following two regressions over the past 20 quarters for each bank in my sample, requiring a minimum of 12 quarters of non-missing data for each bank (variables are defined in section 3.2):
(7)
(8)
Discretionary loan loss provisioning (Smoothing) is measured as the adjusted R-squared from equation 8 minus the adjusted R-squared from equation 7, and represents the incremental explanatory power of earnings before the loan loss provision (EBLLP) for the current loan loss provision. In table 11, I re-estimate equation 4 using Smoothing as the proxy for bank opacity and both Forbear and Fail as dependent variables. Consistent with opacity enabling forbearance (as well as with the results in tables 4 and 7), the coefficient on Smoothing is positive and significant when Forbear is the dependent variable (panel A) and negative and significant when Fail is the dependent variable (panel B). Furthermore, untabulated analyses show that the inferences from tables 5 through 8 are largely unaffected when employing Smoothing as the opacity proxy. The results in table 11 suggest that other aspects of bank opacity, such as discretionary loan loss provisioning, enable regulators to successfully practice forbearance. 4.9 Additional robustness tests
the Forbear distribution. To examine this hypothesis, I estimate equation 4 using quantile regression. Untabulated results show that the positive association between Forbear and DELR is strongest within the top 20 percent of the Forbear distribution.35 This finding is consistent with opacity playing a more important role in forbearance in weaker banks.36
I also examine the robustness of my results to additional control variables. Managerial ability potentially drives both the choice of opacity as well as the regulators’ decision to practice forbearance. Unfortunately, data on executive compensation, a common measure of managerial ability, is not available for my sample. Instead, I employ the natural logarithm of average quarterly salary expense as a proxy for managerial ability. Inferences are unaffected by the inclusion of this variable. My results are also robust to the inclusion of a set of control variables that more fully captures the composition of the bank’s loan portfolio (all scaled by total loans): depository loans, government loans, foreign loans, and other loans. Finally, inferences are unaffected by the inclusion of the following variables: net charge-offs, loan growth, an indicator variable that captures whether the bank is owned by a bank-holding company, and an indicator variable that captures whether the bank or its bank-holding company are publicly traded.37,38
35
I also find that the cross-sectional results in tables 5 and 6 are strongest within this portion of the Forbear
distribution (results untabulated).
36 Additionally, I examine the robustness of my results to employing a variable equal to the percentile rank of Forbear. Inferences are generally similar when estimating versions of equations 4, 5, and 6 using the ranked version of Forbear as the dependent variable, both DELR and Smoothing as opacity proxies, the full set of control variables, and bank fixed effects (results untabulated).
37
I conduct several additional robustness tests. First, Forbear is bounded below by zero. Inferences are robust to employing tobit regression instead of OLS regression. Second, estimating non-linear models with many zeroes is potentially problematic. To reduce the amount of zeroes in the failure regressions, I remove banks that both did not fail and had a low probability of failing. Inferences are unchanged when estimating the bank failure regressions after eliminating observations with a Failure Probability less than the sample median.
38 If opacity inhibits monitoring by depositors, then opaque banks should have experienced less deposit erosion
CHAPTER 5: CONCLUSION
In this study I provide evidence that one bank-level factor, opacity, is positively
associated with regulatory forbearance. Furthermore, I find that the positive effect of opacity on forbearance is stronger when (1) the regulators’ incentives to practice forbearance are greater, and (2) monitoring by creditors is likely to be greater. My results are consistent with opacity inhibiting non-regulator outsiders from assessing bank risk, thus disguising the extent to which regulators engage in forbearance. These results further our understanding of regulatory actions by identifying conditions under which regulators are more successful in practicing forbearance.
The inferences in this study have implications for the recent debate about bank
transparency. Bank opacity has been suggested as one of the contributing factors to the recent financial crisis as it prevented outsiders from understanding the health and risk of individual banks (Bank for International Settlements 2012). However, recent research suggests that bank opacity may actually be optimal (Holmstrom 2012; Dang et al. 2012; Dang et al. 2013; Siritto 2013). My results suggest that bank opacity can be desirable during a crisis period if opacity enables regulatory forbearance as a means to provide banks an opportunity to recover without costly intervention and prevent the spread of problems throughout the banking system.
The conclusions in this study are subject to several caveats. First, regulatory forbearance is inherently unobservable. This study, like prior research on this topic, uses estimates of
forbearance. In addition to examining the probability of bank failure, I develop a new measure of
TABLE 1: SAMPLE SELECTION
All U.S. commercial banks year-end call reports between 2006 and 2009 30595
with non-missing assets and capital ratios
- Bank-years with missing values for control variables 915
- Bank-years without data to compute DELR 3170
Final sample 26510
Number of unique banks that failed 258
Number of unique banks that did not fail 7177
TABLE 2: DESCRIPTIVE STATISTICS
Variables Mean Std Dev 25th Pctl Median 75th Pctl
Fail 0.010 0.098 0.000 0.000 0.000
DELR -0.032 0.133 -0.074 0.001 0.047
High DELR 0.508 0.500 0.000 1.000 1.000
Tier 1 Ratio 0.148 0.066 0.105 0.127 0.167
NPL 0.019 0.026 0.003 0.010 0.024
Size 5.111 1.284 4.237 4.991 5.821
Loans 0.651 0.147 0.565 0.674 0.759
ROA 0.018 0.026 0.011 0.022 0.032
ROA Volatility 0.004 0.003 0.003 0.004 0.005
Liquidity 0.065 0.063 0.030 0.044 0.075
Asset Risk 0.768 0.123 0.706 0.791 0.855
Loan Loss Reserve 0.015 0.008 0.010 0.013 0.017
Loan Loss Provision 0.007 0.013 0.001 0.003 0.007
Real Estate Loans 0.702 0.194 0.589 0.736 0.846
Consumer Loans 0.076 0.080 0.023 0.052 0.100
Agriculture Loans 0.074 0.122 0.000 0.011 0.097
Commercial Loans 0.145 0.096 0.078 0.128 0.192
TABLE 3: FORBEARANCE PROXY
Panel A: Forbear Regression
Dep Var: Fail
VARIABLES Pred Sign (1)
Tier 1 Ratio - -85.694***
(-10.07)
NPL + 28.758***
(13.12)
Observations 26,510
Pseudo R-squared 0.615
Panel B: Forbear Descriptive Statistics
Variable Mean Std Dev 25th Pctl Median 75th Pctl
Forbear 0.537 4.048 0.001 0.025 0.168
This table contains the estimation of equation 3 using logistic regression (panel A) and the descriptive statistics for
Forbear (panel B). In panel A, the dependent variable is Fail, which is an indicator variable equal to one if the bank failed in the next year, and zero otherwise. The independent variables are Tier 1 Ratio, the bank’s tier 1 capital ratio,