STEPPING TOWARD COLLECTIVE MINDSETS: AN INVESTIGATION OF GROUP- AND LEADER-BASED SYNCHRONY IN WORK TEAMS
Tanya Vacharkulksemsuk
A dissertation submitted to the faculty of the University of North Carolina at Chapel Hill in partial fulfillment of the requirements for the degree of Doctor of Philosophy in the
Department of Psychology (Social Psychology Program).
Chapel Hill 2013
Approved by:
Barbara L. Fredrickson Sara B. Algoe
ABSTRACT
TANYA VACHARKULKSEMSUK: Stepping toward Collective Mindsets: An Investigation of Group- and Leader-based Synchrony in Work Teams
(Under the direction of Dr. Barbara L. Fredrickson)
The keys to creating effective team performance have long been under investigation by researchers. Past research identifies social cohesion as an important precursor, but how to achieve social cohesion is lesser understood. This dissertation proposes that at the core of an effective team is synchrony—the act of moving together “as one”—which has been shown to predict a variety of psychological and social outcomes. The question of whether—and if so, how—synchrony’s benefits extend to the domain of team performance, however, remains untested. This multilevel study consists of two studies examining real undergraduate student teams working together over an academic semester.
First, Study 1 tests for construct validity of a synchrony-based relational leadership skill, called synchrony detection, hypothesized to be related to unlocking greater team synchrony. Synchrony detection is proposed to be comprised of two latent factors: pattern recognition style and emotional competency, each with three and four measures, respectively. In addition, I developed a novel measure for this dissertation called “AccuSync”, which aims to gauge an individual’s synchrony detection ability. Results of a confirmatory factor
refined synchrony detection measures. Future considerations, promising exploratory
ACKNOWLEDGMENTS
This research was supported, in part, by the Kenan Distinguished Professorship Funds, awarded to Barbara Fredrickson, at the University of North Carolina, Chapel Hill.
Many thanks to my committee chair, Barbara Fredrickson, for her enduring support and guidance, and to my committee members, Sara Algoe, Tanya Chartrand, Michael Christian, and Abigail Panter, for lending their expertise and advice throughout all stages of my dissertation research. Special thanks also to several others: Claudia Kubowicz Malhotra and Nicholas Didow for access to their course teams; Philip Gable, Judith Hall, and Jeffrey Sanchez-Burks for their generosity in sharing their respective measures used in Study 1; undergraduates Pinelopi Kyriazi and Tracy Powers for their tremendous assistance with data collection; and Kimberly Coffey for her statistical counsel.
TABLE OF CONTENTS
LIST OF TABLES……….………..………vii
LIST OF FIGURES………..………..viii
Chapter I. INTRODUCTION………...……....…..1
Synchrony: Its form and function………..……....……1
Synchrony unlocks a social process in teams…….………..…….4
Achieving greater team performance via entitativity and cohesion………..….5
Synchrony detection: A cognitive-emotional leadership skill that may unlock a social process………...…8
Goals for the current research………..10
Synchrony detection: Proposed nomological network………...…....….11
A social process model of synchrony detection, synchrony, and team performance……….…….17
II. METHOD………..………...………..19
Study 1………..………...……….19
Study 2……….………..………..26
III. RESULTS………….………..………..31
Study 1……….………..………..31
Practical application of the current findings………..………..49
Future directions………...…..50
Closing……….54
APPENDICES………..………...……67
Appendix A. Example item from the group embedded figures test…….………...…67
B. Example images used in the global-local visual processing task…….…………..67
C. Example screenshots of AccuSync videos………...68
LIST OF TABLES
Table
1. Descriptives and correlations for measured variables in study 1……….…….….56
2. Pattern matrix of extracted factors using a direct oblimin rotation……….….…..58
3. Descriptives for measured variables in study 2………..…...58
4. Correlations among measured variables in study 2……….…..58
5. Summary of fit indices for study 2 path models………...…………...…..59
6. Exploring alternative predictors of relational leadership emergence………...60
LIST OF FIGURES
Figure
CHAPTER I
INTRODUCTION
The keys to creating effective team performance have long been under investigation by researchers. Past research identifies social cohesion as an important precursor, but how to achieve social cohesion is lesser understood. I propose that at the core of an effective team is
synchrony, in which people move together “as one”. In this multilevel investigation, I
examine synchrony in a sample of student work teams. Study 1 tests the development of a new synchrony-based construct, synchrony detection, which I hypothesize to be a relational leadership skill. Then, Study 2 examines synchrony as an emergent property of teams that unlocks a social process toward greater team performance. Each of these studies builds off one another, so both will be discussed in tandem throughout each chapter of this dissertation.
I begin below with an introduction to synchrony—what it is, its function—and follow with explaining its role in unlocking a beneficial social process in work teams. Then, I will introduce synchrony detection, focusing specifically on its potential value as a leadership skill. These reviews inform my hypotheses, all of which are summed at the end of this introduction chapter.
Synchrony: Its Form and Function
moments, and a pigeon hops around in search of crumbs. A further examination, however, reveals that amidst this backdrop of randomness, instances of orderliness are abound: a flock of birds fly in formation, ants march together in their quest for food, a group of runners seemingly glide as their common pace puts them in-step with one another, and a crowd of fans shout and jump in unison cheering at a little league game. In each case, there are rich amounts of similar physical movements occurring at a common tempo, a group-level phenomenon known as synchrony. Synchrony is coordination of movement that occurs between individuals, featuring similarity of 1) form, the manner and style of movements, and
2) time, the temporal rhythm of movements (Bernieri, Reznick, & Rosenthal, 1988; Kimura
& Daibo, 2006). More specifically, synchrony is movement among a dyad or group of people in-phase with one another and/or is matching in frequency (Richardson, Garcia, Frank, Gregor, & Marsh, 2012; Clayton, Sager, & Will, 2004). So although physical movements originate from individual people, it is through interaction and holistic consideration of those movements that synchrony exists as a higher-level, collective phenomenon (Katz & Kahn, 1966).
Critically, a host of empirical studies demonstrate that moving in synchrony with others carries psychological consequences across a variety of domains: rowers who row in synchrony have elevated pain thresholds (Cohen, Ejsmond-Frey, Knight, & Dunbar, 2010), infants who show behavioral synchrony with their caretakers’ speech and emotional display patterns show more successful language acquisition (Condon & Sander, 1974) and self-control emergence (Feldman, Greenbaum, & Yirmiya, 1999) later in life, and volleyball players who practice to fast-tempo music synchronized to their movements report reduced perception of effort during practice (Szabo & Hoban, 2004). It is also known that
experimental manipulations of synchrony breed prosocial outcomes, including compassion (Valdesolo & DeSteno, 2011) and cooperation in adults (Wiltermuth & Heath, 2009; Cohen, Mundry, & Kirschner, 2013), and even preschoolers (Kirschner and Tomasello, 2010). By simply moving in a coordinated temporal fashion with others, desirable psychological and behavioral outcomes for dyads and groups arise.
Furthermore, people report greater social connection and rapport (Vacharkulksemsuk & Fredrickson, 2012), affiliation (Hove & Risen, 2009), and emotional support satisfaction (Jones & Wirtz, 2007) with people with whom they experience synchrony, thereby
highlighting the socio-relational consequences of synchrony. What’s more, in a study comparing preschool children’s ability to synchronize their drumming behavior to an external medium, they synchronized more and more accurately to a social cue (i.e., an adult human), compared to a non-social cue (i.e., audio only from a speaker or a drumming machine), further highlighting the uniquely social basis of synchrony (Kirschner &
expect that experiencing collective synchrony is associated with greater positive affect, as reported by sociological accounts (Ehrenreich, 2006). Given synchrony’s fundamentally social roots, examining its function across a variety of social relationship types has expanded our knowledge about the collective phenomenon in humans greatly.
Synchrony Unlocks a Social Process in Teams
A practical extension of synchrony’s function and consequences—both psychological and social—is to that of work teams, a context whereby a collection of three or more
individuals share a common goal, work interdependently toward it, and are mutually accountable for or are all invested in accomplishing it (Hackman, 1987; Sundstrom, DeMeuse, & Futrell, 1990). Research on the link between explicitly measured synchrony and a team’s performance is nonexistent, yet highly implicative. An overarching aim of this dissertation is to fill this research gap. As defined, synchrony is tempo-based. Less obvious, however, is the role of tempo in teams. At a macro level, time organizes the various stages of teamwork formation and maintenance, beginning from the initial stages of establishing norms to later routinized stages (Gersick, 1988). Put another way, the development process of a team takes place over a time course rather than in one isolated instance.
Upon closer inspection at a micro level, teams are guided by rhythm and tempo. For example, crew teams coordinate their rows to a tempo provided by the coxswain on board shouting commands. By rowing in perfect synchrony, the team maximizes their power and efficiency as a unit. Similarly, historical records describe how field workers would
labor, and factory workers during the Industrial Revolution. In a series of studies, Kelly and McGrath (1985) demonstrated that work teams indeed entrain production speed to the amount of time provided for completing a task. Teams were allowed either five, ten, or twenty minutes to solve anagrams; teams given less time to work accordingly solved their anagrams at a higher rate. It appears that in the same way that rowers entrain to the tempo provided by their coxswain, or the field workers to the work song tempo, Kelly and
McGrath’s teams attuned their rate of work behavior to the temporal conditions imposed upon them. And more recently, Pentland (2012) shows that conversations among team members with balanced amounts of turn-taking, listening, and nonverbal expressivity— conceivably a proxy for synchrony among the group—predict greater team success. Historical and empirical evidence thus suggests that rhythmic coordination—or, as I specifically propose, synchrony—underlies team performance.
But how? That is, as team members’ behaviors fall into rhythm with one another during the teamwork process, how are their judgments and feelings altered? The current study aims to investigate synchrony’s operative role in unlocking a social process that leads to greater team performance. Drawing on past research, I propose entitativity and social cohesion as two psychological emergent team properties—that is, group-level characteristics resulting from interaction among lower-level individual units—stemming from synchrony, that ultimately lead to greater team performance.
Achieving Greater Team Performance via Entitativity and Cohesion
group (Gaertner & Schopler, 1998). Inspired by Gestalt psychology, research demonstrates that certain perceptual cues, such as similarity and proximity, signal entitativity perception. For example, similarity in physical attributes like skin color among a group of people is known to increase attributions of entitativity (Dasgupta, Banaji, & Abelson, 1999): it’s no surprise, then, that groups like marching bands or sports teams wherein each individual dons a uniform, are more likely to be perceived as entitative. There’s also evidence that
movement-based cues are associated with entitativity. Across four studies, Lakens (2010) demonstrates a strong linear relationship between entitativity and synchronous movement, wherein participants judged videos of stick-figure pairs waving either in perfect synchrony or to one of six different rhythms deviating from perfect synchrony. Results showed that the degree to which an observer perceives entitativity of the stick-figure pairs is highly
influenced by cues of movement tempo, an effect that may be mediated by increased perceptions of common goal pursuit (Ip, Chiu, & Wan, 2006; Brewer, Weber, & Carini, 1995) or perceived similarity (Lakens, 2010, Study 3). The examples of bands marching in-step and sports teams executing plays with temporal precision again fit the bill for being entitative, given their shared movement characteristics.
and joy) or suggestive of a particular mindset (e.g., arm muscles and lifting activity) influences people’s perceptions (e.g., Neal & Chartrand, 2011; Jostmann, Lakens, & Schubert, 2009). Important for relational outcomes, past research also shows that when people experience higher degrees of psychological overlap with another person, they report higher levels of satisfaction and commitment within the assessed relationship (Aron, Norman, Aron, McKenna, & Heyman, 2000). A common measure of relational strength in work teams is known as cohesion, which I propose to be a relational consequence of
entitativity. Specifically, I propose that experiencing group synchrony represents a physical embodiment of “oneness” which enables greater perceptions of entitativity with one’s group, in turn leading to more felt cohesion1.
Importantly, social cohesion—broadly defined as positive feelings about one’s team—is associated with greater team performance (Gully, Devine, & Whitney, 1995; Losada & Heaphy, 2004). This effect is observed particularly on tasks that involve high levels of interdependence (Sundstrom, De Meuse, & Futrell, 1990), including those in virtual environments (Mason & Clauset, 2013). Furthermore, people who are more enmeshed, or “central”, in an informational advice network report greater individual job performance and satisfaction, compared to people who remain peripheral to such networks (Sparrowe, Liden, Wayne, & Kraimer, 2001; Baldwin, Bedell, & Johnson, 1997). Such feelings of cohesion can function to bolster group morale and team empowerment (Kirkman, Tesluk, & Rosen, 2004), both of which can then foster greater performance. Liking among team members also tends to lead to more open communication and agreeableness, in turn producing less conflict
1
(e.g., Jehn & Mannix, 2001; Wagner, Pfeffer, & O’Reilly, 1984). And finally, Pentland (2012) reports that low-performing teams at a major bank’s call center improved job
efficiency by a measured 20% when managers implemented a common coffee break time for all employees, conceivably creating a structured time for socializing to arise. If, according to past research, cohesion leads to greater team performance, and my predictions that synchrony enables greater perceptions of entitativity and feelings of cohesion are supported, then
synchrony may very well relate to team performance via entitativity and cohesion. The current research seeks to extend and unify these current literatures on synchrony, entitativity, cohesion, and team performance by empirically testing each link.
Synchrony Detection: A Cognitive-emotional Leadership Skill that may Unlock a Social Process
Separate lines of evidence suggest that leaders are indeed managers of their group’s physical configurations as well as their emotional tone—I propose that detecting synchrony unifies the use of both these skills at once. Pattern recognition—the act of integrating
unorganized information and identifying patterns against a background of randomness—is an important cognitive skill for leaders (Boyatzis, 1982; Spencer & Spencer, 1993). For
example, research by Wolff, Pescosolido, and Druskat (2002) on nearly 400 MBA students distributed across 48 self-managing teams finds that the cognitive skill of pattern recognition is associated with a socio-emotional ability to support and develop others in the group, which then lead to greater task coordination and perceived leadership. It is plausible that when faced with cognitive and emotional information in a work team, those who are skilled at pattern recognition are better able to usefully integrate all the information instead of ignoring it or becoming overwhelmed.
In terms of recognizing emotions among a group, emotional intelligence is a critical predictor of effective leadership, be it through a formal appointment (Rosete & Ciarrochi, 2005) or informal emergence (Cote, Lopes, Salovey, & Miners, 2010). Pescosolido (2002) finds supporting qualitative evidence that emergent leaders are skilled at facilitating
situations, responses and solutions that maintain a balanced emotional tone within the group. That is, in the same way that there are benefits to one being “intelligent” with recognizing and handling one’s own emotions, knowing whether one’s group is emotionally “on the same page” is beneficial for knowing that everyone is focused on the same goals and tasks (Mayer & Salovey, 1997; Sanchez-Burks & Huy, 2009). Exploring synchrony detection as a
of positive group behavior and social consequences, as past research finds, then being able to “see” the presence or absence of it may be a useful skill for leaders to have in order to
effectively manage their teams.
Goals for the Current Research
There are two studies in the current research, each with its own set of aims. Study 1 directly tests for the existence of a synchrony detection construct. I predict that this proposed individual-level skill is a combination of cognitive and emotional skills, and I include a variety of established constructs in Study 1 to establish convergent and divergent validity with synchrony detection. In addition, Study 1 tests a novel measure I developed for this dissertation, called “AccuSync”, which aims to gauge an individual’s ability to “see”
synchrony. This measure departs from static measures of pattern recognition style, such that it includes dynamic stimuli, mapping on to the construct of movement synchrony. Moreover, AccuSync departs from other measures of emotional competency, such that it includes expressivity at a group level rather than individual level.
Study 2 aims to determine predictive validity of the new latent construct synchrony detection in student work teams. Specifically, this study tests a unifying model of predictions about synchrony detection unlocking a social process toward greater team performance. I predict that individuals high on synchrony detection are more likely to emerge in their team as a relational leader, and be more likely to facilitate team synchrony. And, with synchrony representing a physical embodiment of “oneness”, I predict enabled psychological
leadership emergence and group synchrony. In all, results from these studies of synchrony detection will set the stage for future investigations of synchrony’s impact in organizational domains, specifically around the idea that tempos underlie team success.
Synchrony Detection: Proposed Nomological Network
Figure 1 graphically represents the proposed nomological network of synchrony detection and primary aim of Study 1. I propose that synchrony detection draws on one’s cognitive skill of recognizing patterns within one’s group, as well as one’s emotional competency skill in assessing a group’s emotional tone, as conveyed through a group’s physical movements. I hypothesize that:
(H1) Synchrony detection is a construct comprised of two latent factors: pattern
recognition style and emotional competency. Each of the following measurements is
expected to load moderately-to-highly on synchrony detection: field-dependent cognitive style, global visual processing, synchrony rating accuracy, emotional
intelligence, emotional aperture, social sensitivity, and nonverbal sensitivity.
And,
(H2) Study 1 will explore the reliability of the AccuSync measure, developed for this dissertation project to be the most direct measure of synchrony detection.
Cognitive Aspects of Synchrony Detection
In considering strictly the cognitive aspects of detecting synchrony, it helps to imagine how synchrony appears when stripped of any audio cues. What remains are simply the physical movements occurring among the collective. Important here is that the
must be attuned to the “big picture” rather than just the details. More specifically, the movements need to be perceived as an integrated configuration or pattern of several individual elements (i.e., group-level display of movements), rather than just as several individual elements (i.e., individual-level display of movements).
I draw primarily on constructs from research on cognitive processing styles to define and develop the cognitive aspects of synchrony detection, which I term pattern recognition style.
Hypothesized pattern recognition style constructs
Field-dependent/-independent cognitive style. Field-dependent or -independent
requires one to cognitively “see” the collective as an entity rather than a group of individuals. I predict a positive moderate relationship (0.3) between field-dependence and the latent
construct synchrony detection.
Global processing style. Global-local processing refers to one’s scope, or breadth, of
cognitive attention. Whereas global processing considers holistic features of a given stimuli (i.e., seeing the “forest”), local processing directs one’s attention toward the elements of a given stimuli (i.e., seeing the “trees”). Global-local processing style is typically assessed as an outcome, with past studies showing that one’s global versus local breadth of attention can be shifted via positive emotions (Gable & Harmon-Jones, 2008; Johnson, Waugh, &
Fredrickson, 2010). In this study designed to establish construct validity of synchrony detection, however, global processing style will be assessed once as a trait measure. Similar to field-dependence/-independence style, however, global-local processing style tests one’s perceptual functioning as it relates to non-social, geometric figures rather than
socio-emotionally laden stimuli. As such, I hypothesize that one’s global-local processing style is related to synchrony detection to the extent that it draws on one’s tendency to “see the forest” rather than the “trees”. I predict a positive moderate relationship (0.3) between global
processing and the latent construct synchrony detection.
Synchrony rating accuracy. As just described, measures of both
synchrony, which features a variety of 10-second video clips of collective groups of people and animals moving in- and out-of-synchrony. AccuSync is designed to be much more closely aligned to the definition of synchrony with use of dynamic stimuli, compared to stimuli used in tests of field-dependence/-independence and global-local processing, and can thus shed more light on the content of what people see when observing synchrony. I
hypothesize that one’s synchrony rating accuracy—as measured using the new AccuSync measure—is the strongest measure of synchrony detection. I predict a high positive relationship (0.5) between synchrony rating accuracy and the latent construct synchrony detection.
Emotional Aspects of Synchrony Detection
In considering the emotional aspects of detecting synchrony, what one “sees” is that each individual involved is emotionally “on the same page”, or intersubjectively engaged, with others in the moment. Individuals in synchrony with one another experience uniformity in their emotions, whether positive (e.g., crowd laughter at a comedy show), or negative (e.g., an angry mob; solemn group prayer at a funeral service), and it is essential that one notices uniformity in order to detect synchrony. Similarly, one must be able to grasp when there is a mix of positive and negative, to detect the absence of synchrony.
positive, negative, or neutral emotional memories. Data from motion capture cameras revealed that gaits while reliving positive emotions (e.g., joy, contentment) were
characterized by more expansive torsos, compared to reliving neutral emotions, and more extended necks, compared to reliving negative emotions (e.g., sadness). Thus, it is evident that the body carries valuable affective information, with useful meaning when expressed in group-level movements like synchrony. Furthermore, research on individual levels of emotional intelligence, social sensitivity, and nonverbal sensitivity suggests that there is a wide distribution in individual’s skill to read or perceive emotions in the face and body of other people. I draw on these existing bodies of research to define and develop the emotional aspect of synchrony detection, which I term as emotional competency.
Hypothesized emotional competency constructs
Emotional intelligence. Emotional intelligence is one’s ability to perceive and
understand others’ emotions, and to appropriately regulate one’s own emotions in various interpersonal situations (Mayer & Salovey, 1997). Often, emotional intelligence is linked to favorable managerial outcomes, such as greater effectiveness and likeability (Day & Carroll, 2004; Cavazotte, Moreno, & Hickmann, 2012). Given that emotions are implicated in situations of synchrony, it is expected that for one to be skilled at synchrony detection, one must also be emotionally intelligent. Emotional intelligence, however, assesses one’s understanding and use of emotion more so as it relates to one’s own behaviors. Synchrony detection, on the other hand, is conceived as a more specified branch of emotional
Emotional apertures. Another construct that I predict to be related to synchrony detection is emotional apertures. Emotional aperture departs from prior constructs of perceiving emotion at the individual level, and instead represents one’s sensitivity to emotions present among a collective (Sanchez-Burks & Huy, 2009). Thus, a person with a wide emotional aperture focuses not only on a single person’s emotional displays, but broadens their visual scope to accurately capture broader affective displays of an entire group. This is analogous to global or holistic processing, which accounts for a broader view, compared to local processing; and instead of shapes and elemental figures, people are
perceiving emotions in human faces. Importantly for interpersonal dynamics in the workplace, certain tendencies in perceiving group-level emotions—specifically, underestimation of the prevalence of negative emotions and overestimation of positive ones—hamper transformational leadership behavior (Huy, Bartel, Rees, & Sanchez-Burks,
under review). Given that both emotional apertures and synchrony are inherently
group-based, and that emotions are implied in synchrony, I predict a strong positive correlation (0.5) between emotional apertures and the latent construct synchrony detection. Emotional apertures would not be a comprehensive measure of synchrony detection, however, since emotional apertures focuses on emotions conveyed through static facial displays, whereas synchrony usually involves emotions dynamically conveyed through various channels as well.
Social sensitivity. I am also including various measures of one’s ability to accurately
widely used measure of social sensitivity, or ability to accurately perceive the emotional states of others. Past work demonstrates that autistic individuals who tend to have difficulty understanding others’ minds are lower in social sensitivity, compared to non-autistics (e.g., Baron-Cohen, 1995). I predict a positive moderate correlation (0.3) between social
sensitivity and synchrony detection.
Nonverbal sensitivity. In addition, I will be including an individual difference
measure of accurately recognizing emotions expressed through multiple channels to establish construct validity of synchrony detection. Although the Reading the Mind in the Eyes Test is a widely used and valid assessment of social sensitivity, it is limited for my current purposes, such that the static stimuli only convey emotions through the eyes, yet in actuality, multiple channels are used in communicating emotion. Thus, I will include a measure of nonverbal sensitivity in multiple channels, and predict a positive moderate correlation (0.3) between nonverbal sensitivity and the latent construct synchrony detection.
A Social Process Model of Synchrony Detection, Synchrony, and Team Performance Study 2 and its corresponding hypotheses test the predictive validity of synchrony detection in the domains of leadership and team process. In terms of leadership, I
disjointed, multi-minded manner, such leaders may detect that the team is functioning at a suboptimal level. Second, in terms of team process, I predict that experiencing alignment of one’s own behavior with the temporal rhythm of the rest of the group leads to psychological perceptions of entitativity and social feelings of cohesion, that ultimately affect group performance. Figure 2 summarizes the hypothesized paths for a multilevel model of a synchrony-driven process that leads to better team performance:
(H3) The proposed construct synchrony detection will significantly predict the likelihood of an individual emerging as a relational leader in their team.
(H4) Individuals who emerge as relational leaders in their teams will facilitate more team-level synchrony.
(H5) More team-level synchrony will lead to greater levels of team-level entitativity. (H6) More team-level synchrony will lead to better team performance.
CHAPTER II
METHOD
This chapter provides details of the measures and procedures used to collect data for testing the list of hypotheses described previously. Studies 1 and 2 build off one another, and participants are the same, although considered at different levels of analyses, in each study.
Study 1 Participant Descriptives
Participants were 233 undergraduate students (140 male, 89 female, 4 unreported) enrolled in a Marketing course. Of 217 valid self-reports, 167 were White, 19 were East Asian, 12 were South Asian, 9 were Black, and 10 belonged to a bi-racial or other category. Participants’ mean age was 20.39 years.
Each enrolled student had the option to participate in up to three hours in the laboratory to fulfill a course research requirement, wherein they received one credit of research activity toward their requirement for each hour completed. Students’ alternate option for completing their research requirement was a writing assignment from their instructor. Of the total 233 students enrolled in the course, 205 (88.0%) participated in all three laboratory hours offered, 21 (9.01%) participated in two hours, four (1.72%)
administration of different measures across multiple sessions, there are varying sample sizes reported in analyses.
Procedure
At each laboratory session, participants were seated at individual computers to complete various measures and tasks in private. All measures utilized online computer data collection procedures, except for the Group Embedded Figures Test and Profile of Nonverbal Sensitivity
which were administered as paper-and-pencil tasks. Pattern Recognition Measures
Field-dependent cognitive style. The Group Embedded Figures Test (GEFT; Witkin,
Oltman, Raskin, & Karp, 1971) measured field-dependent cognitive style. For each item of the GEFT, participants were to find a simple geometric figure within a more complex figure (example provided in Appendix A). Participants were guided through examples, and then completed two 5-minute sections, each comprised of 9 items. Lower scores represent a more field-dependent cognitive style, such that participants were unable to quickly and accurately identify the simple figures from the larger complex figure. Conversely, higher scores represent a more field-independent cognitive style, such that participants were able to identify the simple figures.
Global processing style. A global-local processing task measured global processing
images in which a T or H is made up of smaller letters, whereas local targets were those in which a T or H made up a larger letter. A small fixation cross was presented for a half-second between each target. I recorded reaction times (in millihalf-seconds) for each of 64 total trials, then calculated a global bias score based on average reaction times to identifying global targets subtracted from average reaction times to identifying local targets.
Synchrony rating accuracy. A new measure called AccuSync was developed for this
dissertation, to assess individuals’ accuracy in rating behavioral synchrony. In this task, participants watched eight different 10-second video clips of collective groups of people or animals moving in- and out-of-synchrony, such as flocks of birds, marching bands, and rowers (example screenshots provided in Appendix C). Participants rated each video on the three aspects of behavioral synchrony (Bernieri, Reznick, & Rosenthal, 1988), including simultaneous movement, tempo similarity, and coordination and smoothness. I summed ratings to represent a total synchrony score for each video. Then, I computed the absolute difference between participants’ synchrony score for each video and a group mean rating from a separate sample of 176 individuals. Finally, I calculated the average absolute difference across all eight videos to represent the participant’s final AccuSync score, with smaller scores (i.e., smaller absolute differences) representing greater synchrony rating accuracy.
Emotional Competency Measures
Emotional intelligence. To measure emotional intelligence, I used the Wong and Law
intelligence: identifying emotions (e.g., “I have a good sense of why I have certain feelings most of the time”), understanding emotions (e.g., “I have good understanding of the
emotions of people around me”), using emotions (e.g., “I would always encourage myself to try my best”), and managing emotions (e.g., “I have good control of my own emotions”). Participants used a 7-point scale (1 = “strongly disagree”, 7 = “strongly agree”) to rate themselves on each item. The average across all 16 items represented individuals’ emotional intelligence score (α =.89).
Emotional aperture. The test of emotional apertures (Sanchez-Burks & Huy, 2009;
Sanchez-Burks, Bartel, Huys, & Rees, under review) presents participants with static images of groups of four people from the torso up. For each item, an image of the group is shown for two seconds, followed by another two-second presentation of the group hearing about an organizational change event. Participants judged how much positive and negative emotions appeared in the group’s reactions using a 5-point scale (“none of the group”, “about a quarter of the group”, “about half the group”, “about three quarters of the group”, “all of the group”) for each emotion valence type. There were 17 stimuli total, ranging in emotional expression types, gender, and ethnic composition present among the group. One’s overall emotional aperture score is represented by a total percentage of the total 17 judged correctly.
Social sensitivity. Participants also completed the Reading the Mind in the Eyes Test
amused, regretful, flirtatious”). One’s overall social sensitivity score is represented by the number of the total 36 was judged correctly.
Nonverbal sensitivity. I used the short-form version of the Profile of Nonverbal
Sensitivity (PONS; Rosenthal, Hall, DiMatteo, Rogers, & Archer, 1979), called the
miniPONS (Banziger, Scherer, Hall, & Rosenthal, 2011) to measure nonverbal sensitivity. The miniPONS consists of 64 items (compared to 220 in the full version), is highly
correlated with, and demonstrates similar construct validity with the full version. In this task, participants saw a variety of video clips (lasting 2-seconds or less) of a woman
communicating using various channels, including the face, body, and/or voice only (non-English, without picture). For each video clip, participants selected between a pair of
descriptions that they believed best described the woman’s action (e.g., “admiring nature” vs. “helping a customer”; “expressing jealous anger” vs. “criticizing someone for being late”). One’s overall nonverbal sensitivity score is represented by how many items of the total 64 were judged correctly.
Personality Variables
Since synchrony detection is being conceptualized as a skill, each of the constructs within its nomological network (and corresponding measures) is measured as an ability rather than a value, trait, motive, or orientation. However, it would be useful for construct validity to also know the extent to which synchrony detection is related to individual traits found in prior research to be associated with these various abilities. To explore these relationships, the following measures were included in this study:
Analytic-holism cognitive style. Participants completed a 24-item measure of
Example items (by subscale) include: “Everything in the universe is somehow related to each other” (causality); “It is more desirable to take the middle ground than go to extremes” (attitude toward contradictions); “Future events are predictable based on present situations” (perception of change); “The whole, rather than its parts, should be considered in order to understand a phenomenon” (locus of attention). Overall scores are an average of 24 total items (α =.74).
Social approach motive. Participants completed a 4-item measure of social approach
motivation, a subscale drawn from the Social Approach and Avoidance Motives Scale (SAAMS; Elliot, Gable, & Mapes, 2006), in terms of their friendships using a 7-point scale. An example item of social approach is “In general, I am trying to move toward growth and development in my friendships”. Overall scores are an average of the four items (α = .83).
Positivity resonance. Participants completed a 12-item measure of tendency towards
positivity resonance, or positive social connection, with classroom work groups
(Vacharkulksemsuk & Fredrickson, in prep). Participants were asked to think of all their experiences in work groups for classes, and indicated how much of the time (0-100%) they generally experienced with their colleagues “flow of conversation”, and “smooth
coordination”, for example. Overall scores are an average of 12 total items (α = .88).
Emotional contagion. Participants completed a 15-item measure of emotional
Perspective-taking. Participants completed the perspective-taking subscale of Davis’s interpersonal reactivity index (IRI; Davis, 1980) using a 5-point agreement scale. Example items include: “I try to look at everybody’s side of a disagreement before I make a decision” and “I sometimes find it difficult to see things from the ‘other guy’s’ point of view [reverse-scored]”. Overall scores are an average of 7 total items (α =.82).
Self-monitoring. Participants completed a measure of one’s tendency to self-monitor
in social interactions (Snyder & Gangestad, 1986) by agreeing or disagreeing to items such as: “At parties and social gatherings, I do not attempt to do or say things that others will like.” and “I guess I put on a show to impress or entertain others.” Overall self-monitoring scores are a total number of self-monitoring-descriptive items that participants endorsed (α =.71).
Collective self-construal. Participants also completed the relational-interdependent
self-construal scale (RISC; Cross, Bacon, & Morris, 2000), a measure of the degree to which one considers his/her social groups as part of one’s self-identity. They used a 7-point
agreement scale to rate items such as “The groups I belong to are an important reflection of who I am” and “I usually feel a strong sense of pride when a group I belong to has an important accomplishment” (α =.90).
Big five personality traits. Finally, participants completed the Ten-item Personality
Inventory (TIPI; Gosling, Rentfrow, & Swann, 2003), a measure of the Big Five personality traits. Participants used a 7-point agreement scale to indicate agreement to pairs of
Study 2 Participant Descriptives
Participants were the same undergraduate Marketing students from Study 1. During this particular academic semester, there were two instructors covering a total of five different course sections. As part of the standard course curriculum, students worked in teams
comprised of 4-5 individuals over the course of an academic semester to complete three case studies and one final project together. Teams were formed either by random assignment, had their request to work with certain teammates fulfilled, or a combination of both.
Determination of Sample Size
Analyses of Study 2 include data collected in laboratory sessions (i.e., self-report ratings of team dynamics), in the classroom (i.e., individual students’ evaluations of their teammates and team experience submitted to their course instructors), and from course instructors (i.e., performance grades). As reported above, 230 of the 233 students (98.7%) enrolled in the course participated in at least one laboratory session overall. Of those 230 students, 16 (6.96%) of them were not at the laboratory session that asked students to rate their team on various characteristics. In terms of team-level response rate at this particular laboratory session, the average within-group response was 93.12% (e.g., there was a 100% response rate for a high majority of the teams). In all, there were 13 (out of 49 total) teams with missing laboratory data from at least one team member. Analyses were re-run
of 94.4% (13 out of 233 missing), creating a total of 11 teams with missing data about who these particular individual non-respondents would have nominated as relational leaders. I relied on nominations provided by other team members, so teams missing these data were included in analyses.
Data exclusions, however, were made based on individuals who did not provide permission to link their team evaluations and performance grades with their laboratory data. There was an individual permission rate of 95.3% (11 out of 233 did not provide permission, across eight total teams), resulting in a final total sample size of 41 teams (10 male, 8 all-female, 23 mixed-gender; 13 all-White, 28 mixed-race).
Procedure
As part of the course curriculum, each team worked together over the course of an academic semester to complete three case studies and one final project. Self-reported measures of team dynamics were collected in the laboratory toward the end of the semester, during the week of their final presentation. Individual students’ evaluations of their
Measures
Synchrony detection. Synchrony detection was assessed as a composite of the pattern
recognition and emotional competency measures described in Study 1.
Relational leadership emergence. Leadership emergence was assessed simply as a
binary (e.g., yes or no), based on open-ended responses to the prompt “Please provide any additional comments about this team member you think would be relevant in my [the instructor’s] evaluation of team contribution” in team member evaluations. I took a liberal approach to coding the open-ended comments: any comment that included words like “leader”, “initiative”, or “delegation” was considered a leader nomination. As such, any number of team members, from none to all members of the team, can be nominated as an informal leader. Here, specific actions that characterized their leadership was not accounted for, but rather, simply whether the team member was perceived to be a leader or not.
Example nominations included: “I think he really stepped up as a leader”, “[she] showed leadership throughout the course of the project”, and “[he] was our great organizer and
always made sure everybody was on track.” Then, to determine if nominated leaders were perceived to be relational, I calculated
the mean letter grade (i.e., A, B, C, D, F) team members assigned him/her on “recognized others’ abilities/skills” and “sensitivity for others’ needs/feelings”, both based on the
relationship management subscale of the Conger-Kunungo leadership scale (α =.84; Conger & Kanungo, 1994). Nominated leaders who received a mean grade of A- or higher were considered relational leaders.
Team synchrony. At the laboratory session toward end of the semester, participants
three team assignments and final project with. To measure synchrony, participants were asked to recall their most recent team meeting and rate their experience using Bernieri, Reznick, and Rosenthal’s (1988) measure of behavioral synchrony, including ratings of simultaneous movement, tempo similarity, and coordination and smoothness using a 7-point semantic scale. I then summed ratings of each aspect to represent a total team synchrony score (α =.77).
Entitativity. Participants self-reported their perceived team entitativity using a
four-item measure (adapted by Lakens & Stel, 2011, based on Postmes, Brooke, & Jetten, 2008). Participants used a 7-point scale (1= “not at all true of my work group” to 7 = “very true of my work group”) to rate five statements; ratings were averaged to represent overall
entitativity (α =.96). Sample items include: “In general, I feel like my group members and I are a unit” and “In general, I felt ‘as one’ with the other members of the group”.
Team cohesion. Team cohesion was assessed using Seashore’s (1954) measure of
group cohesion. Participants used a 7-point scale (1= “not at all true of my work group” to 7 = “very true of my work group”) to rate five statements about their group; ratings were averaged to represent overall team rapport (α =.93). Sample items include: “In general, the members of our group got along together very well” and “In general, our group was united in trying to reach its goal for performance”.
Group performance. I measured group performance using instructors’ assigned
course and team structure. The final team project was to write a marketing plan for a hypothetical new start-up business, and deliver a 10-minute class presentation. Each team’s project was scored out a total possible 20 points.
Positive affect. Affect was also measured as a covariate. Participants rated the mood
CHAPTER III
RESULTS
This chapter provides details of descriptive statistics of all measured variables in Study 1 and 2, along with analytic technique and results of each tested prediction. Results indicate that the current data do indeed support some of the stated predictions about synchrony and synchrony detection in work teams.
Study 1 Descriptive Statistics
are expected, given that they are similar in content of judging emotions in face and body. However, no significant correlations exist in the hypothesized direction between pattern recognition and emotional competency measures to comprise synchrony detection. Confirmatory Factor Analysis of Proposed Synchrony Detection Model (H1)
Hypothesis 1 states that synchrony detection is a construct comprised of two latent factors: pattern recognition and emotional competency. Each of the following measurements was predicted to load moderately-to-highly on synchrony detection: field-dependent
cognitive style, global visual processing, synchrony rating accuracy, emotional intelligence, emotional aperture, social sensitivity, and nonverbal sensitivity. To test my proposed model of synchrony detection, I ran a confirmatory factor analysis (CFA) with two factors—pattern recognition style and emotional competency—each with its three and four respective
measured variables. Based on a model estimated using maximum likelihood, the specified model did not converge, confirming the observed non-significant correlations and suggesting that—as measured—these ability scores do not occupy the same shared variance space.
relevant to the current investigation of synchrony detection, and will not be discussed further here.
In-depth Analysis of Measuring Synchrony Rating Accuracy (H2)
Hypothesis 2 explores the reliability of the eight-item AccuSync measure I developed for this dissertation project, predicted to be the most direct measure of synchrony detection. Based on the scores calculated—which reflect an average deviation score for each
participant, regardless of whether participants over- or under-estimated the synchrony present—an inter-item reliability analysis reveals an unacceptably low alpha (α = .427). Reliabilities are similarly poor when I create subgroups of videos based on various other characteristics (e.g., animals only, α = .150; humans only, α =.227; synchronous behaviors only, α =.275; asynchronous behaviors only, α =.404; situations of expected synchrony, α =.385; situations of unexpected synchrony, α =.370; large masses, α =.370). In its current state, then, this newly-developed measure is demonstrating poor psychometric properties. Given the low reliabilities and concerning features of AccuSync, I reran the CFA and EFA of the construct synchrony detection with just scores measuring field-dependent cognitive style, global processing bias, emotional intelligence, emotional aperture, social sensitivity, and nonverbal sensitivity (i.e., without synchrony rating accuracy), and results again do not validate synchrony detection as a construct.
Study 1 Summary
results about synchrony detection, I could not test the hypothesized pathways labeled H3 and H4 shown in Figure 2. Instead, I started with testing the hypothesized pathways stemming from team-level synchrony, as they relate to performance. Then, I returned to investigate the individual-level contributors of leadership and synchrony detection skill.
Study 2 Team Score Calculations
Hypotheses 5-8 state the following: more team-level synchrony will lead to greater levels of team-level entitativity (H5), more team-level synchrony will lead to better team performance (H6), greater levels of team-level entitativity will predict greater team cohesion (H7), and greater team cohesion will predict better team performance (H8). All constructs are conceptualized at the group level, with the idea that these constructs are emergent team properties resulting from an interactive process among the members (Kozlowski & Klein, 2000).
To test these hypotheses, I averaged responses from participants within each team in order to create team-level scores. Table 3 presents descriptive, intraclass correlations (ICCs), and rwg statistics2 of all measured team variables; Table 4 shows correlations among team-level mean-aggregate variables.
2
Synchrony’s Pathway to Performance (H5-H8)
First, I tested Hypotheses 5-8 simultaneously as one path model using all team-level aggregate scores, wherein synchrony, entitativity, cohesion, and performance subsequently predict one another, and also included a direct pathway between synchrony and performance. Results of a structural equation model, using maximum likelihood estimates in MPlus
software (Muthen & Muthen, 1998-2011), indicate that synchrony predicts entitativity (hypothesis 5; b = .30, SE = .06, p < .01), entitativity predicts cohesion (hypothesis 7; b = .76, SE = .07, p < .01), and cohesion predicts performance (hypothesis 8; b = .65, SE = .33, p < .05). Synchrony, however, does not significantly predict performance (hypothesis 6; b = .20, SE = .15, p = .17). Given these results, I ran a similar model, removing the direct pathway from synchrony to performance, and added each group’s mean-level rating of affect at their most recent team meeting, course section, group size, and team formation type as control variables. As Figure 3 shows, all aforementioned pathways remain significant, and model fit3 is excellent (χ2 = 2.16, df = 3, p = .54, RMSEA = .00, CFI = 1.00). The results of this group-level structural equation model are consistent with hypotheses, revealing that synchrony, entitativity, and cohesion as team-level aggregate scores significantly bear on one another toward team performance4.
3Each fit index provides different information about a tested model. The χ2 represents a comparison between
the model-implied structure of the data and the actual data, and hence, a non-significant χ2 value indicates a better model fit (Hu & Bentler, 1999; Barrett, 2007). The Root Mean Square Error of Approximation
(RMSEA) is another common fit index, computed based on the χ2 and degrees of freedom. In general, RMSEA values of .01, .05, and .08, indicate excellent, good, and mediocre fit, respectively (MacCallum, Browne, & Sugawara, 1996). The Comparative Fit Index (CFI) measures how much the specified model fits compared to no model at all. In general, CFI closer to 1.0 indicate better model fit, with values greater than .90 regarded as acceptable (Arbuckle & Wothke, 1999).
4
5 Alternative Models
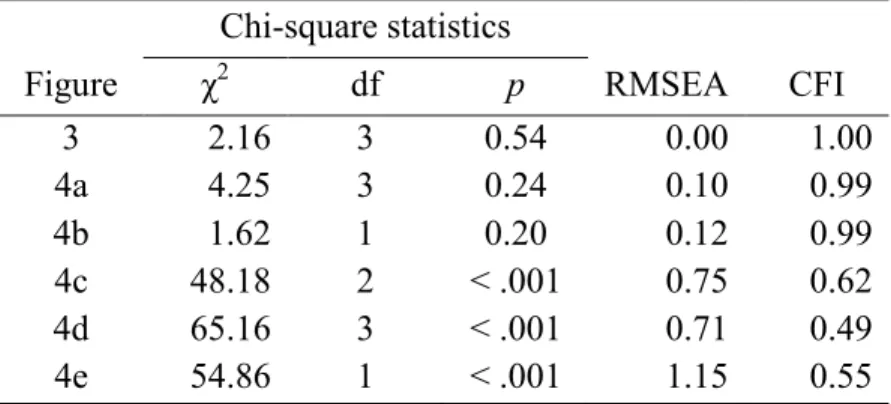
I tested five alternative models, each described below and presented correspondingly as Figures 4a-4e. A summary of all model fit indices presented in Table 5. All models control for group affect, course section, group size, and team formation type.
First, I switched the order of entitativity and cohesion in the model, such that synchrony predicts cohesion, cohesion predicts entitativity, and entitativity ultimately predicts performance. Results would shed light on whether entitativity and cohesion are interchangeable with one another, as they relate to synchrony and team performance. As Figure 4a shows, entitativity does indeed predict team performance in the same way that cohesion does, and other preceding pathways are similar to the model presented in Figure 3 too. This suggests that it is plausible that a perceived sense of group entitativity coincides with feelings of cohesion, and relate similarly to synchrony and team performance. Fit indices show good fit overall (χ2 = 4.25, df = 3, p = .24, RMSEA = .10, CFI =.99), although the RMSEA is no longer in the acceptable range. Hence, this alternative model is not nearly as good as the original model whereby entitativity precedes cohesion.
Second, given a particularly high correlation between entitativity and cohesion (r = .86, p < .01), I tested a model that collapses the two constructs into one (i.e., entitativity-cohesion). Inter-item reliability of the nine total items is high (α = .96). As Figure 4b shows, results are similar the previous model that consider entitativity and cohesion as separate constructs, such that synchrony significantly predicts entitativity-cohesion, in turn
p = .20, RMSEA = .12, CFI =.99), although the RMSEA is no longer in the acceptable range. These analyses suggest that, within the current data, entitativity and cohesion may indeed be redundant constructs that operate similarly to influence team performance whether
considered together or as distinct constructs5. In comparing whole models, though, entitativity separately predicting cohesion yields the best fit so far.
Then, I tested whether synchrony predicts entitativity and cohesion simultaneously, and if each would then in turn predict team performance. Results of this model shed light on whether entitativity and cohesion are team processes that are simultaneously active, or if order of variables really matters. As Figure 4c shows, synchrony significantly predicts both entitativity and cohesion as it did in the two models just presented. However, entitativity and cohesion now fail to independently predict team performance. Model fit is poor (χ2 = 48.18, df = 2, p < .001, RMSEA = .75, CFI =.62). This suggests that perhaps a more appropriately fitting model is one whereby either entitativity or cohesion is active in affecting team performance.
Fourth, I tested the possibility of synchrony, entitativity, and cohesion all as
simultaneous predictors of team performance. As Figure 4d shows, there is no direct impact of each of these variables on team performance, thus further highlighting the criticality of these processes working in an ordered fashion with one another to affect performance, rather than simultaneously. Model fit is poor (χ2 = 65.16, df = 3, p < .001, RMSEA = .71, CFI =.49).
5
Finally, I tested the possibility of cohesion and entitativity affecting performance through synchrony, rather than synchrony predicting the two. As Figure 4e shows, synchrony still shows no direct significant influence on team performance, nor does
entitativity or cohesion. Notably, neither cohesion nor entitativity predict synchrony, again highlighting that a sequential order underlies the relationship of these three variables, rather than simultaneous occurrence. Model fit is again poor (χ2 = 54.86, df = 1, p < .001, RMSEA = 1.15, CFI =.55).
Results of these alternative models lend further support to the original model
presented as Figure 3. Building off this team-level model, I added preceding pathways to test the remaining hypotheses.
Does Relational Leadership Predict the Team-level Model? (H4)
Hypothesis 4 states that individuals who emerge as relational leaders in their teams will facilitate more team-level synchrony. As described earlier, relational leader emergence was determined based on teammate nominations in team evaluations submitted to course instructors. Of the initial 41 leaders nominated, three did not receive the minimum grade average rating (A-) from their teammates on relational leadership characteristics, resulting in a total of 38 emergent relational leaders in 28 different teams, across the entire sample.
1.00), individuals who emerge as relational leaders show no impact on their team’s amount of synchrony (b = 11.93, SE = 35.52, p = .74). I also tested if groups characterized by relational leaders show greater amounts of team synchrony by entering a team-level sum score of relational leaders as a predictor of synchrony, and the result is similarly insignificant (b = .15, SE = .31, p = .63).
Post-hoc Exploratory Analyses
Despite null findings of relational leadership emergence predicting synchrony, the question of what predicts relational leadership still remains. Hypothesis 3 states that the proposed construct of synchrony detection will significantly predict the likelihood of an individual emerging as a relational leader in their team. However, there is no evidence for the proposed construct of synchrony detection in Study 1, thereby offering no support to H3. However, data from Study 1 can shed light on other socio-emotional individual differences that can be critical for leadership emergence. Using individual-level data collected for Study1, I tested the influence of each ability and personality variable on relational leadership emergence. In addition, since the AccuSync measure was intended to be the most direct measure of synchrony detection, I tested AccuSync scores for each video, and a composite sum score of all variables significantly correlated with the AccuSync measure (i.e., holistic perceptual style, social approach motive, emotional contagion, agreeableness; see Table 1). I used PROC GLIMMIX in SAS for this set of multilevel analyses because relational
leadership is a binary outcome and to control for team clustering (Raudenbush & Bryk, 2002). All results are presented in Table 6.
emotional competency measures, nonverbal sensitivity (measured by miniPONS)
significantly predicts relational leadership emergence (b = .14, SE = .06, p = .02). The odds ratio of 1.15 indicates that with each unit increase on the miniPONS, the odds of a person emerging as a relational leader increases by a factor of 1.15, a finding consistent with other existing evidence (e.g., Ronay & Carney, 2013). Of the personality self-report variables assessed from each individual, one’s collective self-construal significantly predicts relational leadership (b = .49, SE = .21, p = .02). The odds ratio is 1.63, indicating that with each unit increase on the CSC scale the odds of a person emerging as a relational leaders increase by a factor of 1.63, which is also consistent with past research (Hackman, Ellis, Johnson, & Staley, 1999). None of the AccuSync videos individually predict relational leadership emergence, nor the combination of its significant correlates.
I then tested for other team-level predictors of team-level synchrony, given that results did not support the hypothesis that relational leadership would predict synchrony. Table 7 features promising correlations between team-level aggregate scores of all study measures with team synchrony. First, despite its low scale reliability, team-level aggregate scores of overall AccuSync and team synchrony are significantly related (r = .33, p = .04). This suggests that people who deviate more from the pilot population mean in seeing synchrony are perhaps more prone to experiencing synchrony as a team. Moreover, since they are deviating more from the mean (in either direction), then perhaps being “accurate” renders a relationship to synchrony in an opposite way from what I proposed: instead, non-normal perceptions of synchrony in the AccuSync videos are telling of experiencing
the level of synchrony is less obvious or expected, compared to a marching band
performance, for example. Again, it is plausible that having more deviant perceptions of synchrony is telling of the degree to which teams then achieve experiencing synchrony together. Finally, there is a significant positive association between team synchrony and team levels of emotional contagion (r = .35, p = .03), thus revealing the intriguing idea that greater susceptibility to one another’s emotions in a team underlies experiencing more synchrony together.
Study 2 Summary
Study 2 provides a number of useful results. First, results illuminate an indirect relationship between a team’s recalled experience of synchrony with team performance, specifically through perceptions of entitativity and feelings of cohesion. Consistent with hypotheses, the featured model is notably composed of solely team-level variables, thereby providing an understanding for this process as an emergent one that is unique from processes guided by individual-level contributions and processes. Furthermore, with the testing of alternative models, there is evidence that variable order is important in this process toward greater team performance. Second, Study 2 results suggest that relational leadership does not have a significant role in unlocking team synchrony, which fails to support one of my
proposed hypotheses (H4). It is possible that there are underlying mechanisms that need to be uncovered to better understand the link between leadership and synchrony. Finally, despite the insignificant link between relational leadership emergence and synchrony, there is evidence for one personality variable (collective self-construal) and one emotional
CHAPTER IV
GENERAL DISCUSSION
Fostering social cohesion among teams is known to predict greater team performance; furthermore, past research shows that physically moving in-time—or synchronously—with others leads to greater feelings of social connection. This multilevel investigation focused on synchrony as a key factor in facilitating team performance. I examined the role of one’s ability to “see” synchrony, in addition to a team’s recalled experience of synchrony, in predicting team performance of students working together over the course of an academic semester.
First, Study 1 showed that my proposed construct of synchrony detection—one’s ability to detect the presence or absence of synchrony as a function of emotional and cognitive processing—does not appear to be supported by the empirical fusion of
cognitive pattern recognition style and emotional competency skill measures included in the present work. The proposed hypotheses about synchrony detection was a first among existing research to empirically examine an individual difference in being able to “see” synchrony, particularly as a potentially important and useful skill for relational leaders. The explicit breakdown of synchrony into hypothesized cognitive and emotional
I also developed AccuSync, a measure designed to assess synchrony detection. Despite results of Study 1 pointing toward weak validity and reliability of the measure, it provides guidance on appropriate modifications for a more refined measure and
definition of synchrony detection in future research. First, it is worth noting that AccuSync in this study consisted of just eight video items that, although were all
characterized by some degree of synchrony, also varied on several other dimensions (e.g., animals only, humans only, situations of expected versus unexpected synchrony). This likely contributed to the low alpha reliability, and future research will need to consider a much greater number of video items for the AccuSync measure. To illustrate, the Spearman-Brown prophecy formula (DeVellis, 2011) predicts an improved scale reliability of α = .69 if the measure includes a total 24 items, or α = .75 with 32 items. Scale reliability would continue to improve, of course, with the continued addition of video items.
Nevertheless, AccuSync in its current form demonstrates promise as it relates to other measures in the current study. For example, there are several significant negative correlations between AccuSync and other personality measures shown in the bottom half of Table 1 that can help inform what AccuSync is assessing. The significantly correlated variables—holistic perceptual style, social approach motive, emotional contagion, and agreeableness—appear to revolve around a loose theme of socio-emotional absorption, or assimilation with other people. Given that smaller AccuSync scores (i.e., smaller
future studies simply the extent to which one’s rating of synchrony in the various videos is associated with the other pattern recognition, emotional competency, and personality variables measured. One’s synchrony rating accuracy score in the current study was an average of deviations from a pilot sample’s rating of synchrony for the various videos. However, there may be value in examining participants’ raw scores of synchrony instead of their correspondence to the pilot sample. Particularly for videos like “dancers in club”, wherein the level of synchrony is less obvious or expected (compared to a marching band performance or crew team rowers, for instance), attributing more synchrony may be indicative of the degree to which one is watching the video with a broader lens that captures holistic movement or group emotion. In fact, a cursory examination of correlations shows that participants who rated the “dancers in club” video as more synchronous (based on raw, not “accuracy”, scores) are higher on emotional intelligence
(r = .13, p = .05). Similarly, high synchrony ratings of the hip-hop dance troupe
performance are significantly associated with emotional apertures (r = .17, p = .01) and social sensitivity (r = .27, p < .01), and marginally significant with emotional intelligence
(r = .12, p = .09). These correlations indeed show some relationship between the degrees
to which one sees synchrony and level of emotional competency, and in light of them, future research should continue to reexamine participants’ raw scores of synchrony ratings as they relate to other measures in this study.
synchrony, thereby indicating that affect is active in the synchrony-teamwork process. And, despite Study 1’s results not supporting my proposal for synchrony detection as a novel construct, it is evident that affect and synchronous movements are highly
intertwined. It is evident from recent research that the whole body carries valuable affective information, with useful meaning when expressed in group-level movements like synchrony. For example, building directly off of Gross et al’s (2012) research on emotional gaits, seeing a group’s synchronous positive gait from afar may indicate a socially safe situation, whereas seeing a synchronous negative gait may indicate an oncoming attack. Moreover, in observing synchrony, one likely has to trade in access to perceiving smaller units of the body, such as facial features, in order to see the whole group’s movements. This requires a fundamental shift in broadening one’s visual aperture, which draws on cognitive research on visual processing styles and pattern recognition. Taken together—and only together—the bodies of research on emotional expressions and cognitive processing styles suggest a novel way of understanding
synchrony from an observer’s perspective. Pinpointing exactly what synchrony detection is actually comprised of in terms of individual’s abilities may be a matter of discovering a more appropriate set of related constructs and measures.