Novel Genetic Variants for Cartilage
Thickness and Hip Osteoarthritis
Martha C. Castaño-Betancourt1☯, Dan S. Evans2☯, Yolande F. M. Ramos3☯, Cindy G. Boer1☯
, Sarah Metrustry4, Youfang Liu5, Wouter den Hollander3, Jeroen van Rooij1,
Virginia B. Kraus6, Michelle S. Yau7, Braxton D. Mitchell7,8, Kenneth Muir9,
Albert Hofman10,11, Michael Doherty12, Sally Doherty12, Weiya Zhang12, Robert Kraaij1,
Fernando Rivadeneira1, Elizabeth Barrett-Connor13, Rose A. Maciewicz14, Nigel Arden15, Rob G. H. H. Nelissen16, Margreet Kloppenburg17, Joanne M. Jordan5, Michael C. Nevitt18,
Eline P. Slagboom3, Deborah J. Hart4, Floris Lafeber19, Unnur Styrkarsdottir20, Eleftheria Zeggini21, Evangelos Evangelou22,23, Tim D. Spector4, Andre
G. Uitterlinden1,10, Nancy E. Lane18,24‡, Ingrid Meulenbelt3‡, Ana M. Valdes12‡, Joyce B. J. van Meurs1‡
*
1 Department of Internal Medicine, Erasmus Medical Center, Rotterdam, The Netherlands, 2 California Pacific Medical Center Research Institute, San Francisco, California, United States of America,
3 Department of Medical Statistics and Bioinformatics, Section Molecular Epidemiology. Leiden University Medical Center, Leiden, The Netherlands, 4 Department of Twins Research and Genetic Epidemiology Unit, King’s College London, London, United Kingdom, 5 Thurston Arthritis Research Center, University of North Carolina, Chapel Hill, North Carolina, United States of America, 6 Duke Molecular Physiology Institute and Division of Rheumatology. Duke University School of Medicine, Durham, North Carolina, United States of America, 7 Departments of Medicine and Epidemiology & Public Health, University of Maryland School of Medicine, Baltimore, Maryland, United States of America, 8 Geriatrics Research and Education Clinical Center, Baltimore Veterans Administration Medical Center, Baltimore, Maryland, United States of America, 9 Health Sciences Research Institute, University of Warwick, Warwick, United Kingdom, 10 Department of Epidemiology, Erasmus Medical Center, Rotterdam, The Netherlands, 11 Department of Epidemiology, Harvard T.H. School of Public Health, Boston, Massachusetts, United States of America, 12 School of Medicine, University of Nottingham, Nottingham, United Kingdom, 13 Epidemiology Division, Family Medicine and Public Health Department, University of California, San Diego, La Jolla, California, 14 Respiratory, Inflammation, Autoimmunity Innovative Medicines, AstraZeneca AB, Mo¨lndal, Sweden, 15 Nuffield Department of Orthopaedics, Rheumatology and musculoskeletal sciences, University of Oxford, United Kingdom, 16 Department of Orthopaedics, Leiden University Medical Center, Leiden The Netherlands, 17 Department of Rheumatology and Department of Clinical Epidemiology, Leiden University Medical Center, Leiden, The Netherlands, 18 University of California at San Francisco, San Francisco, California, 19 University Medical Center Utrecht, Utrecht, The Netherlands, 20 Decode Genetics, Reykjavik, Iceland, 21 Wellcome Trust Sanger Institute, Hinxton, United Kingdom, 22 Department of Hygiene & Epidemiology, University of Ioannina School of Medicine, Ioannina, Greece, 23 Department of Epidemiology and Biostatistics, School of Public Health, Imperial College London, London, United Kingdom, 24 School of Medicine, University of California, Davis, Sacramento, California
☯These authors contributed equally to this work. ‡These authors jointly supervised this work. *[email protected]
Abstract
Osteoarthritis is one of the most frequent and disabling diseases of the elderly. Only few genetic variants have been identified for osteoarthritis, which is partly due to large pheno-type heterogeneity. To reduce heterogeneity, we here examined cartilage thickness, one of the structural components of joint health. We conducted a genome-wide association study of minimal joint space width (mJSW), a proxy for cartilage thickness, in a discovery set of 13,013 participants from five different cohorts and replication in 8,227 individuals from
a11111
OPEN ACCESS
Citation: Castaño-Betancourt MC, Evans DS, Ramos YFM, Boer CG, Metrustry S, Liu Y, et al. (2016) Novel Genetic Variants for Cartilage Thickness and Hip Osteoarthritis. PLoS Genet 12 (10): e1006260. doi:10.1371/journal.
pgen.1006260
Editor: Gregory S. Barsh, Stanford University
School of Medicine, UNITED STATES
Received: March 9, 2016
Accepted: July 26, 2016
Published: October 4, 2016
Copyright: This is an open access article, free of all
copyright, and may be freely reproduced, distributed, transmitted, modified, built upon, or otherwise used by anyone for any lawful purpose. The work is made available under theCreative Commons CC0public domain dedication.
Data Availability Statement: The full results of the
discovery GWAS-analysis is now available from our website.URL:http://glimdna.org/ publicationdata.html.
Funding: This study was funded by The
seven independent cohorts. We identified five genome-wide significant (GWS,
P50×10−8) SNPs annotated to four distinct loci. In addition, we found two additional loci that were significantly replicated, but results of combined meta-analysis fell just below the genome wide significance threshold. The four novel associated genetic loci were located in/near TGFA (rs2862851), PIK3R1 (rs10471753), SLBP/FGFR3 (rs2236995), and TREH/
DDX6 (rs496547), while the other two (DOT1L and SUPT3H/RUNX2) were previously
iden-tified. A systematic prioritization for underlying causal genes was performed using diverse lines of evidence. Exome sequencing data (n = 2,050 individuals) indicated that there were no rare exonic variants that could explain the identified associations. In addition, TGFA,
FGFR3 and PIK3R1 were differentially expressed in OA cartilage lesions versus
non-lesioned cartilage in the same individuals. In conclusion, we identified four novel loci (TGFA, PIK3R1, FGFR3 and TREH) and confirmed two loci known to be associated with cartilage thickness.The identified associations were not caused by rare exonic variants. This is the first report linking TGFA to human OA, which may serve as a new target for future therapies.
Author Summary
Osteoarthritis (OA) is the most common form of arthritis and a leading cause of chronic disability in the western society affecting millions of people. OA is a degenerative joint dis-ease characterized by changes in all joint tissues, including cartilage, bone and synovium, causing chronic pain and loss of function. There are no effective therapeutic treatments available for OA and therefore finding novel biological pathways through genetic associa-tion studies can open up new treatment opassocia-tions. The number of known DNA variants associated with OA-risk is limited.
To identify new loci, we have performed a Genome Wide Association Study meta-anal-ysis on cartilage thickness, one of the joint tissues affected in OA in a total sample of more than 20,000 individuals from twelve cohorts. This analysis revealed six variants associated with cartilage thickness, four of these being novel associations, including TGFA as the most prominent one. A systematic prioritization for underlying causal genes, using diverse lines of evidence, highlighted genes underlying the disease associations, including TGFA, RUNX2 and PIK3R1. Large scale exome sequencing data (n = 2,050 individuals) indicated that there were no rare exonic variants that could explain the identified associations. This
is the first report linkingTGFAto human OA, which may serve as a new target for future
therapies
Introduction
In spite of advances in the understanding of OA, the absence of effective therapeutic targets demonstrates that a better comprehension of its causes and pathophysiological mechanisms is needed. Since genome-wide genetic studies are hypothesis-free and do not suffer from the bias of previous knowledge, they have the potential to identify novel biological pathways involved in OA. The discovery of novel genes has the potential to identify novel treatment options. In addition, more personalized medicine approaches for OA can be explored through prediction of risk for disease as well as classification of disease subtypes.
Culture and Science, the Ministry for Health, Welfare and Sports, the European Commission (DG XII), and the Municipality of Rotterdam. We are also grateful to the participating genetic studies GOGO, which was originally funded by
GlaxoSmithKline. The Exome Sequencing data set was funded by the Netherlands Genomics Initiative (NGI)/Netherlands Organisation for Scientific Research (NWO) sponsored Netherlands Consortium for Healthy Aging (NCHA; project nr. 050-060-810), by the Genetic Laboratory of the Department of Internal Medicine, Erasmus MC, and by the and by a Complementation Project of the Biobanking and Biomolecular Research
Infrastructure Netherlands (BBMRI-NL;www.
Heritability of hip OA has been estimated to be around 40–60%. However, to date only few
genetic variants have been successfully identified [1,2]. The reasons for finding only a modest
number of genetic loci associated with hip OA can be attributed partially to relatively modest
samples sizes in comparison to other complex diseases, such as myocardial infarction [3]. In
addition, phenotype heterogeneity is an important issue in OA genetics as this is well known to reduce power to robustly detect signals. The problem of heterogeneity in genetic association
studies of OA has been highlighted before [4,5] and is exemplified by the fact that the definition
of the phenotype is a combination of bone and/or cartilage features as well as clinical com-plaints. Moreover, there is growing consensus that OA can be divided into multiple sub-pheno-types each with their own etiology and risk factors. For example, it has been demonstrated that individuals with hip OA, where only cartilage degradation is involved (atrophic OA form), are linked to a different systemic bone phenotype compared to individuals with OA where bone
formation is also present [6].
As a way to overcome this, we examined a quantitative trait, which is one of the structural components of joint health, cartilage thickness, as a distinct phenotype.
Joint Space Width (JSW) is considered to be a proxy for cartilage thickness measured on hip radiographs. Minimal JSW (mJSW) has been shown to be a more reliable measure for hip joint
health compared to the classical Kellgren & Lawrence score [7]. Previously, we have
demon-strated that using only a modest discovery sample size (n = 6,000), we were able to successfully
identify a genome-wide significant association of theDOT1Llocus with mJSW as well as hip
OA [1,8]. We now aimed to perform a more powerful analysis by combining data from five
studies in the discovery phase, and subsequent replication in seven additional studies, amount-ing to a total sample size of 21,240 to identify new genes implicated in joint health usamount-ing mJSW as a proxy for cartilage thickness. Using whole exome sequence data from 2,050 individuals we screened the discovered genes for potential functional variants. Subsequently we used multiple approaches that leverage different levels of information to enforce evidence of candidate genes annotated close to the associated signals.
Results
Identification of novel genetic loci associated with cartilage thickness
Genome-wide Association analysis of mJSW of the hip with genetic variants was performed in a
discovery set that included 13,013 individuals (seeS1 TableandS1 Textfor cohort specifics) with
data on ±2,5 million genotyped or HapMap Phase II imputed SNPs. We applied extensive quality
control measures (seeS2 TableandS3 Tablefor details on quality control and exclusion criteria)
leaving a total of 2,385,183 SNPs available for association analyses. Genomic control inflation
fac-tors for the P values of the RS, TwinsUK, MrOS, and SOF GWAS were low (λ= 1.02, 1.01, 1.02
and 0.99 respectively), and the interquantile-quantile plot (S1 Fig) also indicated no residual
pop-ulation stratification due to cryptic relatedness, poppop-ulation substructure or other biases. The discovery analysis yielded eighteen independent SNPs with suggestive evidence for
association (P<110−5) with mJSW, of which five (four genetic loci) met the genome-wide
sig-nificance threshold of P-value510−8(seeFig 1). The top SNPs from these eighteen loci were
selected for replication in additional 8,227 individuals from seven different cohorts. We
observed that six of the eighteen SNPs significantly replicated (P<0.05) with the same direction
of effect (seeTable 1). When we combined discovery and replication results in a meta-analysis,
the five SNPs that met genome-wide significance in the discovery analysis became more signifi-cant and another two SNPs that replicated in independent cohorts reached suggestive evidence
(P110−6) for association in the combined meta-analysis.
associations and bone strength phenotype in MrOS’ under the grant number R01 AR051124, and the MrOS ancillary study ‘GWAS in MrOS and SOF’ under the grant number RC2 AR058973. The Study of Osteoporotic Fractures (SOF) is supported by National Institutes of Health funding. The National Institute on Aging (NIA) provides support under the following grant numbers: R01 AG005407, R01 AR35582, R01 AR35583, R01 AR35584, R01 AG005394, R01 AG027574, and R01 AG027576. The JoCo was supported in part by S043, S1734, & S3486 from the Centers for Disease Control and Prevention/Association of Schools of Public Health; 5-P60-AR30701 & 5-P60 AR49465-03 from the National Institute of Arthritis Musculoskeletal and Skin Diseases (NIAMS) of the National Institutes of Health (NIH) and Algynomics, Inc. JJ was funded for genotyping by Algynomics, Inc. The conclusions are those of the authors and cannot be attributed to the CDC. Arcogen This work was funded by the Wellcome Trust (WT098051). arcOGEN (http://www.arcogen.org.uk/) was funded by a special purpose grant from Arthritis Research UK (grant 18030). The Research Arthritis and Articular Cartilage (RAAK) cohort study was supported by the Leiden University Medical Center, the Dutch Arthritis Association, the Centre of Medical System Biology and the Netherlands Consortium for Healthy Ageing both in the framework of the Netherlands Genomics Initiative (NGI). We also acknowledge support by TreatOA funded by the European Commission framework 7 program (PF7/2007) under grant agreement no. 200800, and the European Union’s Seventh Framework Program (FP7/2007-2011) under grant agreement n˚ 259679. The set-up of the GARP study was partially funded by Pfzer. The funders had no role in study design, data collection and analysis, decision to publish, or preparation of the manuscript.
Competing Interests: The collection of GOAL
The top signal in the combined meta-analysis, rs1180992 (Table 1, Pcombined= 3.2x10⁻¹⁶), is
located in the intronic region of the previously OA associatedDOT1Lgene. This variant is very
close to and in linkage disequilibrium with rs12982744 (D’ = 1, r2= 1), which was previously
found in association with mJSW and hip OA [1,8].
TheDOT1Lsignal was followed in strength of association by rs2862851 (Pcombined=
5.2x10⁻¹¹), which is annotated to the intronic region ofTGFA(Fig 2A). Two variants near
RUNX2, rs10948155 and rs12206662, also reached genome-wide significance for association
with mJSW (Fig 2B). The two variants in the RUNX2 locus were weakly correlated (r2<0.2).
Conditional analysis, using GCTA, showed that both SNPs represented different signals (S4
Table). Finally, the last signal that reached genome-wide significance was rs10471753, an
inter-genic variant closer toPIK3R1(~450 Kb) than toSLC30A5(~750Kb) (Table 1, Pcombined=
3.810−9).
Other suggestive signals for association with mJSW at a Pcombined1x10−6including signals
with significant replication were rs496547 (p = 1.5x10⁻⁷), a downstream gene variant located 3'
ofTREHand, an intron variant annotated nearSLBP(rs2236995; p = 9x10⁻⁷). All other
addi-tional signals selected in the discovery stage did not replicate.
Association of identified loci with hip OA and other musculoskeletal
phenotypes
We examined whether the five GWS and two suggestive mJSW loci were also associated with
hip OA in a total of 8,649 cases and>57,000 controls. Detailed description of the cohorts and
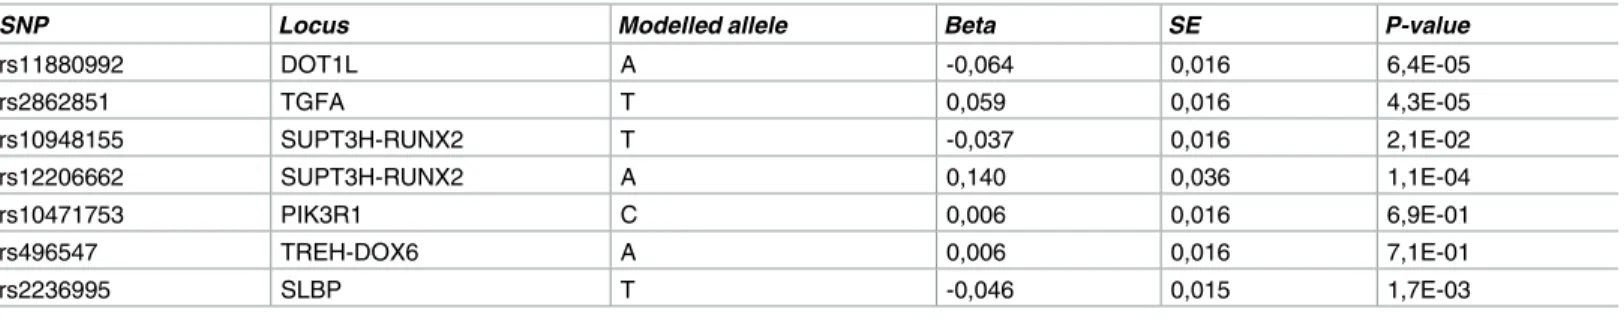
OA definitions is given inS1 Table.Table 2shows the associations found with hip OA. We
observed that five of the seven identified mJSW loci were also associated with hip OA
(p-value<0.05). Apart from the knownDOT1Llocus, the variant nearTGFAwas significantly
associated with hip OA (Table 2, P = 4.3x10⁻⁵). In addition, the SNP nearSLBPand the two
Fig 1. Manhattan plot for association of mJSW in the discovery phase. The -log10 P values, for each of the 2.5 million tests performed as part of the genome wide association of minimal joint space width of the hip (mJSW), plotted against their position per chromosome. Full results of the discovery GWAS are accessible throughwww.glimdna.org. The gray solid horizontal line corresponds to the genome-wide significant threshold (P = 5x10⁻⁸). The dotted grey line corresponds to the selection for replication threshold (P = 1x10⁻⁵).
SNPs nearRUNX2were associated with hip OA. One of the latter SNPs, rs10948155, is in high
LD with a variant (rs10948172, D’ = 0.95 and r2= 0.90) previously found in association with
hip OA in males at borderline GWS level (2). However, in our study, rs10948155 was just
mar-ginally associated with hip OA in the overall analysis (Table 2, P = 0.021). We observed the
sec-ond variant in this genomic region, an intronic variant inRUNX2, rs12206662, to have a larger
effect size (β= 0.14, P = 1.1×10⁻⁴r2= 0.09 with rs10948172).
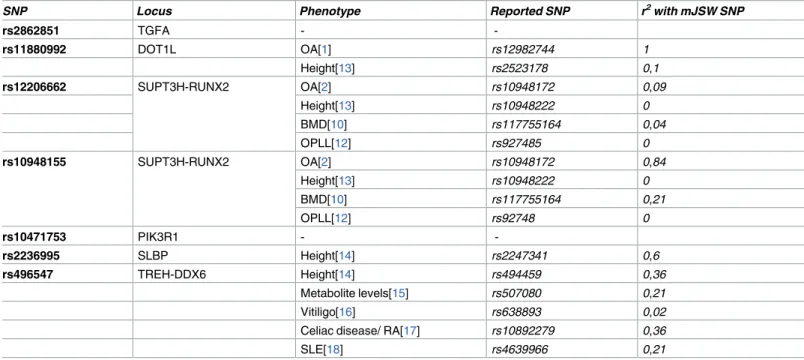
We further examined whether the identified loci were found associated with other
pheno-types in earlier reports (Table 3). Five of the seven identified mJSW SNPs mapped to loci that
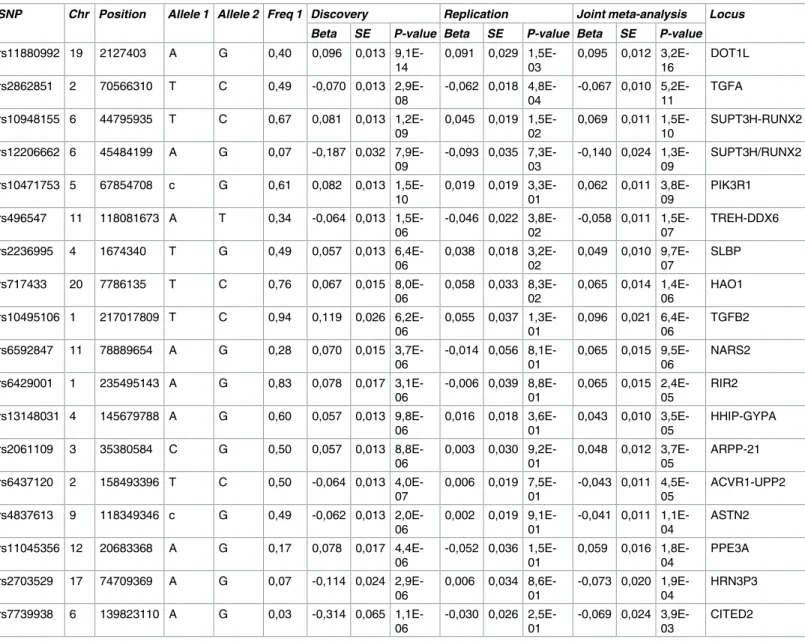
have previously been associated with other bone-related phenotypes, primarily height. How-ever, many of the identified height loci were not highly correlated with the mJSW signal (Table 3). Additional adjustment for height did not have an effect on the described association Table 1. Results from the minimal Joint Space Width genome-wide association study; discovery, replication and joint meta-analysis
SNP Chr Position Allele 1 Allele 2 Freq 1 Discovery Replication Joint meta-analysis Locus
Beta SE P-value Beta SE P-value Beta SE P-value
rs11880992 19 2127403 A G 0,40 0,096 0,013 9,1E-14
0,091 0,029 1,5E-03
0,095 0,012 3,2E-16
DOT1L
rs2862851 2 70566310 T C 0,49 -0,070 0,013 2,9E-08
-0,062 0,018 4,8E-04
-0,067 0,010 5,2E-11
TGFA
rs10948155 6 44795935 T C 0,67 0,081 0,013 1,2E-09
0,045 0,019 1,5E-02
0,069 0,011 1,5E-10
SUPT3H-RUNX2
rs12206662 6 45484199 A G 0,07 -0,187 0,032 7,9E-09
-0,093 0,035 7,3E-03
-0,140 0,024 1,3E-09
SUPT3H/RUNX2
rs10471753 5 67854708 c G 0,61 0,082 0,013 1,5E-10
0,019 0,019 3,3E-01
0,062 0,011 3,8E-09
PIK3R1
rs496547 11 118081673 A T 0,34 -0,064 0,013 1,5E-06
-0,046 0,022 3,8E-02
-0,058 0,011 1,5E-07
TREH-DDX6
rs2236995 4 1674340 T G 0,49 0,057 0,013
6,4E-06
0,038 0,018 3,2E-02
0,049 0,010 9,7E-07
SLBP
rs717433 20 7786135 T C 0,76 0,067 0,015
8,0E-06
0,058 0,033 8,3E-02
0,065 0,014 1,4E-06
HAO1
rs10495106 1 217017809 T C 0,94 0,119 0,026 6,2E-06
0,055 0,037 1,3E-01
0,096 0,021 6,4E-06
TGFB2
rs6592847 11 78889654 A G 0,28 0,070 0,015 3,7E-06
-0,014 0,056 8,1E-01
0,065 0,015 9,5E-06
NARS2
rs6429001 1 235495143 A G 0,83 0,078 0,017 3,1E-06
-0,006 0,039 8,8E-01
0,065 0,015 2,4E-05
RIR2
rs13148031 4 145679788 A G 0,60 0,057 0,013 9,8E-06
0,016 0,018 3,6E-01
0,043 0,010 3,5E-05
HHIP-GYPA
rs2061109 3 35380584 C G 0,50 0,057 0,013 8,8E-06
0,003 0,030 9,2E-01
0,048 0,012 3,7E-05
ARPP-21
rs6437120 2 158493396 T C 0,50 -0,064 0,013 4,0E-07
0,006 0,019 7,5E-01
-0,043 0,011 4,5E-05
ACVR1-UPP2
rs4837613 9 118349346 c G 0,49 -0,062 0,013 2,0E-06
0,002 0,019 9,1E-01
-0,041 0,011 1,1E-04
ASTN2
rs11045356 12 20683368 A G 0,17 0,078 0,017 4,4E-06
-0,052 0,036 1,5E-01
0,059 0,016 1,8E-04
PPE3A
rs2703529 17 74709369 A G 0,07 -0,114 0,024 2,9E-06
0,006 0,034 8,6E-01
-0,073 0,020 1,9E-04
HRN3P3
rs7739938 6 139823110 A G 0,03 -0,314 0,065 1,1E-06
-0,030 0,026 2,5E-01
-0,069 0,024 3,9E-03
CITED2
Chr: Chromosome; Allele 1: Modelled allele in the analysis; Allele 2: alternative allele; SE: standard error.
with mJSW; they showed an independent, possibly pleiotropic effect, on both traits. A particu-larly dense number of associations with different bone related phenotypes were present in the
RUNX25’ region, where variants have been associated to BMD [10], height [11], osteoarthritis
[2] and ossification of the spine [12]. Given the low LD between the variants underlying the
dif-ferent GWAS signals, it is likely that these represent independent associations.
Prioritization of genes underlying the genetic loci
We used multiple approaches that leverage different levels of information (e.g., gene expres-sion, regulatory regions, published literature, mouse phenotypes) to prioritize candidate genes
at each mJSW locus.Table 4shows the summarized results from these analyses. In addition to
the seven loci identified in the current study, we also analyzed five previously published loci for
hip OA [2].
First, we focused on two gene prioritization methods: (i) DEPICT, a novel tool designed to identify the most likely causal gene in a given locus, and identify gene sets that are enriched in
the genetic associations [21], and (ii) GRAIL which uses existing literature to identify
connec-tions between genes in the associated loci [22]. The DEPICT analysis yielded seventeen
signifi-cantly prioritized genes (FDR>0.05), from which three genes were also significantly
prioritized in the GRAIL analysis (S5 TableandS6 Table). Next, using the Online Mendelian
Inheritance in Man (OMIM) database (http://omim.org), we identified genes with mutations
implicated in abnormal skeletal growth in humans; for 50% of the loci, a skeletal syndrome
gene was present (S7 Table). Similarly, we investigated if any of the genes had a known bone
and cartilage development phenotype in mice. Very similar to the human phenotypes, the mice
knockouts of the same genes resulted in bone and cartilage phenotypes (http://mousemutant.
jax.org/) (S7 Table). Other supporting biological evidence that we gathered consisted of known
expression quantitative loci (eQTL) and nonsynonymous variants in LD (r2>0.6) with the lead
SNP of a locus (S8 TableandS9 Table), as well as expression in bone and cartilage tissue in
mice using data from the Jackson lab database (S7 Table).
To further explore which genes are possibly underlying the genetic associations identified in this study, we analyzed gene expression in a paired set of non-lesioned and OA-lesioned Fig 2. Regional association plot for the locus of rs2862851 rs12206662/rs10948155. SNPs are plotted by position in a 800-kb window versus association with mJSW (−log10 P) for A. rs2862851 (TGFA locus) and B. rs12206662/rs10948155 (SUPT3H/RUNX2 locus). The purple dot highlights the most significant SNP in discovery analysis. Blue peaks indicate recombination rates. The SNPs surrounding the most significant SNP are color coded to reflect their LD with this SNP (from pairwise r2values from the HapMap CEU). Genes, exons and the direction of transcription from the University of California at Santa Cruz genome browser are depicted. Plots were generated using Locus Zoom [9]
doi:10.1371/journal.pgen.1006260.g002
Table 2. Association of mJSW loci with Hip OA
SNP Locus Modelled allele Beta SE P-value
rs11880992 DOT1L A -0,064 0,016 6,4E-05
rs2862851 TGFA T 0,059 0,016 4,3E-05
rs10948155 SUPT3H-RUNX2 T -0,037 0,016 2,1E-02
rs12206662 SUPT3H-RUNX2 A 0,140 0,036 1,1E-04
rs10471753 PIK3R1 C 0,006 0,016 6,9E-01
rs496547 TREH-DOX6 A 0,006 0,016 7,1E-01
rs2236995 SLBP T -0,046 0,015 1,7E-03
SE: standard error
cartilage samples of the RAAK study acquired from 33 donors at the time of joint replacement
surgery for primary OA [19]. We first examined which genes are expressed in a set of seven
human healthy cartilage samples (S7 Table). Additionally, we tested which of the genes located
in 1MB region surrounding the lead SNP were differentially expressed in OA-lesioned cartilage versus non-lesioned cartilage of the same hip. Of the 152 genes that were selected, 129 genes were represented on the array. Of those, 64 genes were significantly expressed in the cartilage samples. For eight of the twelve loci, we found genes that were differentially expressed in OA
lesioned cartilage versus non-lesioned cartilage (Table 4,S10 Table). Differential expression in
cartilage healthy vs OA affected cartilage was performed likewise (S10 Table), while additionally
adjusting for sex and age. Given the relatively small number of healthy samples (n = 7) with large age range these data are less robust and we did not use these data in gene prioritization.
For each gene a prioritization score was computed, based on equally weighting of the ten
lines of evidence (Table 4). Following this approach,RUNX2is highly likely to be the causal
gene associated withrs12206662and rs10948155. Similar strong evidence is found forrs788748
(IGFBP3)andrs10492367(PTHLH). In addition, suggestive evidence for a causal gene is found
for the following: rs10471753 (PIK3R1), rs835487 (CHST11), rs2862851 (TGFA), rs6094710
(SULF2), rs9350591 (COL12A1)and rs11177 (GNL3). However for some loci the current
evi-dence is ambiguous, suggesting more than one gene as the potentially causal one;rs2236995
(FGFR3 or SLBP), rs11880992 (GADD45BorDOT1L) and rs496547(KMT2A or UPK2)(Table 4).
Exome sequencing of prioritised genes
In 2,628 individuals from the Rotterdam Study, exome sequencing was performed at a mean depth of 55x. Of those, 2,050 individuals also had mJSW and hip OA phenotype data. Baseline characteristics of those individuals were similar to the source population, mean age was 67.3 years, 57% of the individuals were female and mean of mJSW was 3.81 mm (SD 0.82). Details
of the experimental procedure and variant calling are given in the supplementary material (S2
Text). Only the variants with a minimal allele count of three in the total population were
Table 3. Association of mJSW loci with previously reported phenotypes
SNP Locus Phenotype Reported SNP r2with mJSW SNP
rs2862851 TGFA -
-rs11880992 DOT1L OA[1] rs12982744 1
Height[13] rs2523178 0,1
rs12206662 SUPT3H-RUNX2 OA[2] rs10948172 0,09
Height[13] rs10948222 0
BMD[10] rs117755164 0,04
OPLL[12] rs927485 0
rs10948155 SUPT3H-RUNX2 OA[2] rs10948172 0,84
Height[13] rs10948222 0
BMD[10] rs117755164 0,21
OPLL[12] rs92748 0
rs10471753 PIK3R1 -
-rs2236995 SLBP Height[14] rs2247341 0,6
rs496547 TREH-DDX6 Height[14] rs494459 0,36
Metabolite levels[15] rs507080 0,21
Vitiligo[16] rs638893 0,02
Celiac disease/ RA[17] rs10892279 0,36
SLE[18] rs4639966 0,21
Table 4. Prioritize d genes for Osteoarthr itis loci. Biological and databa se eviden ce was collected to identify the causal gene in each investiga ted osteoarthrit is associated locus. Locus gene sets were constructed by taking a region of 500 Kb upstream and 500Kb downstr eam of the lead SNP of that locus (1MB locus region), in total we analyzed 152 genes. The table summariz es the biological evidence for each osteoarthri tis associated locus: 1) Nearest located genes; 2) DEPICT gene prioritizat ion results, only genes that were signifi-cantly prioritized (FDR < 0.05) are listed; 3) GRAIL results, only nominal significa nt results are listed (P < 0.05); 4) Mouse cartilage or bone gene expressio n; 5) Bone or cartilage devel-opment phenotype in mouse. Mouse expressio n and phenotype data were obtaine d from the Jackson lab database ( http://ww w.inform atics.jax.o rg/ ); 6) Human cartilage tissue gene expressi on; 7) differentia lgene expressio n between OA-lesion ed cartilage tissue and non-lesione d cartilage tissue [ 19 ]; 8) OMIM phenotype; 9) eQTL evidence [ 20 ]; 10) Nonsyn on-ymous variants in LD > 0.6 with lead SNP. All evidence for each gene is summariz ed, genes with the highest number of different types of evidence are reported. Nearest Genes PIK3R1 KLHL42 PTHLH CDC5L; SUPT3H GNL3 DOT1L RUNX2 SLBP TGFA TRH; DDX6 ZMYND8 ; NCOA3 IGFBP3 CHST11 FILIP1; SENP6 GRAILresults Gene PTHLH SULF2 IGFBP3 GRAIL P-value 6,46E-03 2,40E-02 4,37E- 03 DEPICTResults Gene PIK3R1 KLHL42 RUNX2 RUNX2 VAX2 UPK2 IGFBP3 CHST11 DEPICT P-value 7,35E-05 5,03E-03 1,51E-0 3 1,51E-03 8,85E- 04 3,81E-03 2,37E- 03 1,04E- 03 NSv ariants nr. variants -8 1 -1 -Gene
-GNL3; NEK4; STAB1; SPCS1; ITIH1
DOT1L -NCOA3 -eQTL Gene -SUPT3 H NT5DC2 AP3D1 -SLBP -cis-eQTL P-value -4,16E-2 2 1,07E-10 1,10E-15 -6,75E-10 -eQTL tissue -Blood blood Blood -Blood -OMIM Gene PIK3R1 PTHLH RUNX2 -RUNX2 FGFR3 -KMT2A -OMIM Disorder SHORT syndrome Brachy -dactyly
Cleido— cranial dysplas
ia
-Cleido— cranial dysplas
ia
skeletal dysplasi
a
-Wiedemann- Steiner syndrome
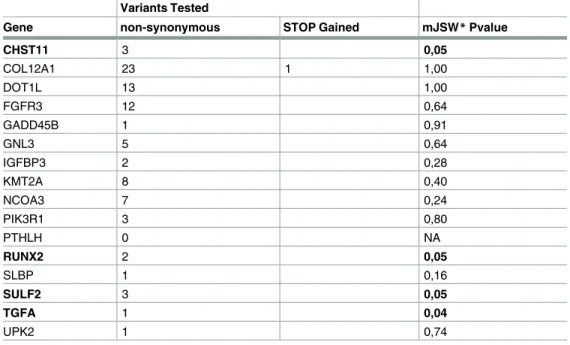
selected for analysis. Within the sixteen prioritized genes, a total number of 158 variants were identified in the protein-coding region, of which 85 were non-synonymous and one was a
stop-gain mutation (Table 5,S11 Table).
We first performed a single variant test, where we tested each of the 86 variants changing
the amino-acid sequence for association with the mJSW trait (S11 Table). We observed four
nominal significant associations, with rare variants inSULF2,TGFA,RUNX2andFGFR3.
None of these rare exonic variants explained the original association between the GWAS hit
and mJSW or hipOA when tested in a multivariate model (S12 Table). Next, we performed a
burden test (SKAT) [23], to investigate whether the cumulative effects of the variants present
in the sixteen selected genes were associated to mJSW, while adjusting for age and gender (Table 5). We observed a nominal significance burden test (p<0.05) forTGFA,SULF2,
CHST11andRUNX2for mJSW. However, none of these findings reached significance after correction for multiple testing.
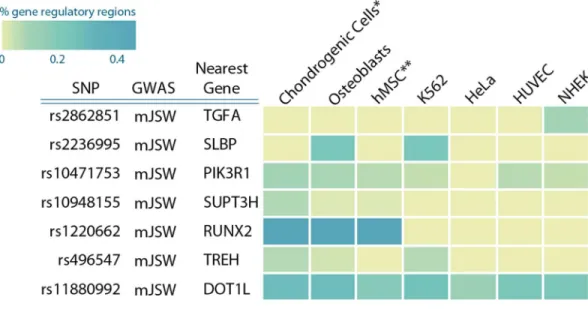
mJSW associated SNPs in regulatory regions
For most of the loci, no obvious protein-coding variants were found that could explain the associations. In previous studies it was shown that disease-associated variants are enriched in
regulatory DNA regions [24,25]. We therefore examined whether the identified DNA variants
(or SNPs in high LD) resided in chondrocyte and/or osteoblast specific enhancer regions, using
data from ENCODE and ROADMAP [26–28]. To this end, we compared CHIP-seq signals
from five different chromatin state markers (H3K4me3, H3K4me1, H3K36me3, H3K27me3, H3K9me3) in chondroblasts and osteoblasts to four cell lines from another origin. Together, these chromatin state markers identify promoter and enhancer activity in each of the cell lines.
With the exception ofrs2862851,we observed that for all mJSW genetic loci, SNPs in high LD
were located in cell regulatory regions in chondroblast and/or osteoblast cells (seeFig 3for an
overview andS13–S18Tables for each locus).
Table 5. Association between protein coding variants identified by exome-sequencing and mJSW.
Variants Tested
Gene non-synonymous STOP Gained mJSW*Pvalue
CHST11 3 0,05
COL12A1 23 1 1,00
DOT1L 13 1,00
FGFR3 12 0,64
GADD45B 1 0,91
GNL3 5 0,64
IGFBP3 2 0,28
KMT2A 8 0,40
NCOA3 7 0,24
PIK3R1 3 0,80
PTHLH 0 NA
RUNX2 2 0,05
SLBP 1 0,16
SULF2 3 0,05
TGFA 1 0,04
UPK2 1 0,74
*A burden test was performed to test the association between the protein-coding variants in the candidate genes and mJSW
Discussion
Only a modest number of genetic variants has been successfully identified through genome-wide association studies for OA This can in part be explained by the phenotypic heterogeneity of OA. Therefore, we used mJSW, a proxy for cartilage thickness in the hip joint, as one of the structural components of joint health. An additional advantage of this phenotype is its continu-ous nature, which increases power compared to a dichotomcontinu-ous trait, such as OA-status. We identified six independent loci associated with cartilage thickness in the hip joint, of which four
surpassed genome-wide significance (TGFA,PIK3R1,SUPT3H-RUNX2,DOT1L) and two were
suggestive for association with mJSW (SLBP/FGFR3,TREH-DDX6). Four of these loci (TGFA,
SUPT3H-RUNX2,DOT1LandFGFR3) were also associated with hip OA.
The fact that we were able to identify six loci with the current sample size (13K individuals in the discovery) indicates that cartilage thickness is a phenotype providing a better yield in number of discoveries than the efforts ran with traditional composite radiographic scores. As a comparison, the largest GWAS study up to now, arcOGEN with 7,4K cases and 11K controls as discovery, yielded one locus in the overall analysis, and seven additionally in a number of stratified analyses. Interestingly, in the current manuscript we report on rs10948155, which is
in high LD (r2>0.8) with a locus from arcOGEN which was only marginally associated (p
below genome-wide significance threshold) with OA in males only [2]. By using a cartilage
spe-cific endophenotype, evidence for this locus is elevated here to genome-wide significance in the total population, underscoring the increased power when more specific endophenotypes are used. Endophenotypes are quantifiable biological traits intermediate in the causal chain between genes and disease manifestation (in this case osteoarthritis). JSW can be precisely
measured throughout the life of individuals [7] and also displays variation in normal subjects.
Therefore, mJSW may be more tractable for the genetic dissection of OA.
Across the cohorts in this manuscript, mJSW has been measured in different ways, using both hand measured JSW on radiographs as well as (semi) automatic software which could Fig 3. mJSW and OA associated variants are co-localized with potential gene regulatory markers. We examined the epigenetic histone marks in Chondrogenic cells, osteoblasts, hMSC, K562, HUVEC, HeLA and NHEK cells. This heatmap of the percentage of variants in gene regulatory regions (enhancer/promoter associated regions) in high LD (r2>0.8) with lead GWAS SNP. Enrichment was calculated according [25].
have added some noise to the overall meta-analysis. Future cross-calibration of JSW measure-ments might aid in a more precise measurement and additional power to pick up genetic loci.
To the best of our knowledge, we are the first to scrutinize exome variants in relation to OA identified by large scale re-sequencing. We did not find low frequency exonic variants in any of the prioritized genes that could explain the observed associations with mJSW. We do have to keep in mind that the power of the exome sequencing effort is smaller than the original discov-ery analysis. We were unable to examine variants with allele frequencies below 0,07%. In addi-tion, for rare or low allele frequencies, we only had power to detect relatively large effect sizes. For example, we had 80% power to detect a beta of 0,7 mm (almost 1SD) difference for a vari-ant with 1% allele frequency. However, we tested all of the discovered exome varivari-ants in a mul-tivariate analysis, and found that the novel identified rare exome variants did not affect the association between the GWAS-identified variants and mJSW in the same sample. This sug-gests that the associations between mJSW and the identified SNPs are not explained by rare exonic variants and likely exert their effects through regulation of expression. Indeed, support-ing this hypothesis, we found that many these variants (or SNPs in LD) were annotated in regions that were annotated as regulatory active in chondroblastic and/or osteoblastic cells. However, more work is needed to examine the exact biological mechanism underlying the identified genetic loci.
TGFA(Transforming Growth Factor Alpha,rs2862851)was the strongest novel locus
asso-ciated with cartilage thickness and hip OA.TGFAhas been suggested to be involved in
endo-chondral bone formation in mice, specifically the transition from hypertrophic cartilage to bone
[29]. Recent,TGFAhas also been implicated in the degeneration of articular cartilage during OA
in rats [30]. Our results now imply a relationship between TGFA and human OA. In addition to
the genetic association, we also show that TGFA expression is higher in human OA affected ver-sus non-lesioned cartilage, possibly indicating that TGFA has a role in cartilage remodeling.
Functional characterization of the TGFA- associated locus by an examination of the histone methylation marks representing promoter or enhancer activity, did not reveal an obvious expla-nation for the functional impact of the SNP. However, the examined histone mark data represent unstimulated cells, and it is anticipated that the promoter and enhancer activity change upon stimulation of the cells. It is becoming more clear that effects of SNPs can be stimulus and context dependent, as has recently been shown for human monocytes, where many regulatory variants
display functionality only after pathophysiological relevant immune stimuli [31].
The identifiedSUPT3H-RUNX2locus contains two variants, rs12206662 and rs10948155,
which are partially independent of each other. Where rs12206662 is located in the first intron
of theRUNX2gene near the second transcription start site (the so-called P2 promoter),
rs10948155 is located more than 500kb away fromRUNX2betweenCDC5LandSUPT3H.
However, rs10948155 is in high linkage disequilibrium with SNPs near in the P2 promoter and
SNPs located in chondroblast specific enhancer regions (S16andS17Tables).Possibly, these
enhancer regions regulateRUNX2gene expression during endochondral differentiation.
RUNX2(Runt-related transcription factor 2) is a master transcription factor for controlling
chondrocyte hypertrophy and osteoblast differentiation [32]. Previous genome-wide
associa-tion studies have identified variants in theSUPT3H-RUNX2locus associated with other bone
and cartilage related phenotypes including height [14], bone mineral density [10] and
ossifica-tion of the posterior longitudinal ligament of the spine [12]. All these previously published loci
are independent of the two mJSW SNPs identified in the current study. We hypothesize that
the SNPs are located in long-range enhancers, which regulateRUNX2gene expression during
endochondral differentiation via a chromatin-loop mediating protein.
We have also identified rs10471753, withPIK3R1(Phosphoinositide-3-Kinase, Regulatory
with mJSW. Mutations in this gene are known to cause the SHORT syndrome, which is a rare multisystem disease with several manifestations including short stature, hernias, hyper
extensi-bility and delayed dentition [33].Taken together with the fact thatPIK3R1is differentially
expressed in OA affected cartilage, these results identifyPIK3R1as the most likely causal gene.
Another possibility is that notPIK3R1but rather a long-non-coding RNA (lncRNA),
lnc-PIK3R1-4:1, is causal, since a variant in LD with the lead SNP is located in the predicted tran-scription start site of this lncRNA potentially affecting its expression. Although conserved in
mice and zebrafish, thus far no function has been ascribed to this lncRNA [34].
We confirmed a locus previously associated with cartilage thickness, theDOT1Llocus. Our
identified SNP,rs11880992is in high LD with the previously reported SNPrs129827744, and
both are associated with cartilage thickness and hip OA [1]. Despite the previously presented
suggestive evidence for involvement of DOT1L in chondrogenic differentiation,DOT1Ldid
not receive a high score in our systematic prioritization study; the geneGADD45B, located in
the region 500Kb downstream of the lead SNP, received a similar score. GADD45B is a
tran-scriptional co-factor for C/EBP-β, a master regulator of chondrocyte differentiation [35]. Thus,
it remains unclear which gene or genes in this locus contribute to the cartilage phenotype.
Fur-ther research is needed to determine wheFur-therDOT1Lis the true causal gene in this locus.
Our analyses suggest that the majority of prioritized genes in hip OA associated loci are
involved in cartilage and bone developmental pathways; includingTGFA,RUNX2,FGFR3,
PTHLH,COL12A1and others that seem to affect bone and/or cartilage development such as
PIK3R1andKMT2AWe hypothesize that the mJSW and OA associated variants influence gene expression regulation. The dysregulation of these genes and mechanisms during develop-ment may, later in life, result in an increased risk for OA.
The identified mJSW SNPs are associated with hip OA, but not with knee OA. We have ana-lysed the identified SNPs also for association with knee OA in the TREAT-OA meta-analysis
dataset [36], but found no association. This observation fits in the overall finding that many of
the identified genetic loci for OA seem to be site-specific [37], and support the hypothesis that
the aetiology of OA is different in each joint. Nevertheless, this observation can still be a result
of low power in the GWAS studies that have been done for OA till now [38], and final
conclu-sions on this aspect cannot be drawn at this point.
This is the first report linking TGFA to human OA most likely by affecting mJSW. It may serve as a new target for future therapies. We have identified multiple mJSW associated loci which have previously been associated with other bone and cartilage related phenotypes such as bone mineral density and height, displaying a possible pleiotropic effect for the analysed traits. It will be important to understand how mJSW and OA associated variants can affect the developmental processes that regulate morphometry of the hip joint, including the formation of articular cartilage. Therefore further expression and functional studies are warranted of genes identified to be associated with hip OA phenotypes.
Materials and Methods
Ethics statement
The participating studies were approved by the medical ethics committees of all participating centres, and all participants gave their written informed consent before entering the study
Discovery GWAS, replication and meta-analysis
residuals from linear regression. Cohort description and details of the single GWAS studies are
given inS1 TextandS1 Table. The 6 cohorts used in the discovery stage were combined in a
joined meta-analysis using inverse variance weighting with METAL [39]. Genomic control
cor-rection was applied to the standard errors and P-values before meta-analysis. SNPs with a P
value<= 5×10⁻⁶were selected for replication. The top SNPs for each independent locus were
taken for replication in seven studies: the Genetics of Osteoarthritis and Lifestyle (GOAL) study, the Chingford study, CHECK (Cohort Hip & Cohort Knee), Genetics osteoARthritis and progression (GARP) study, the Genetics of Generalized Osteoarthritis (GOGO), the John-ston County Osteoarthritis Project (JoCo) and additionally the Nottingham OA case-control study for association with Hip OA (see Supplemental material for detailed information of the cohorts). Association of the SNPs with mJSW was additionally adjusted for height to test its independence. Secondary analyses included: association of the top SNPs with hip OA using logistic regression analysis (age and gender adjusted and by study centres an/or relatedness when it was pertinent). We used conditional analyses to investigate whether there are any inde-pendent signals in the identified associated loci, which were implemented using GCTA-COJO
analysis [40].
Phenotype description of minimal Joint Space width (mJSW)
The mJSW was assessed at pelvic radiographs in anteriorposterior position. The mJSW was measured in mm, along a radius from the center of the femoral head, and defined as the short-est distance found from the femoral head to the acetabulum. Within the Rotterdam Study, we used a 0.5 mm graduated magnifying glass laid directly over the radiograph to measure the
minimal joint space width of the hip joints [41]. Within SOF and MrOS, a handheld caliper
and reticule was used to measured mJSW to the nearest 0.1mm between the acetabular rim and
proximal head of the femur [42]. For CHECK, mJSW was measured semi-automatic with the
Software tool HOLY [43].
Phenotype description of radiographic hip OA
Radiographic hip OA was defined in the RS-I, RS-II, RSIII, Twins-UK, Chingford, and JoCo
studies using Kellgren and Lawrence (K/L) scores. Hip OA cases were defined as a K/L score2
on either side of the hip or THR due to OA. Hip OA controls were defined as no THR for OA
and K/L score1 and JSN1. In MrOS and SOF cohorts, radiographic hip OA case-control
was defined by a modified Croft grade, as previously described [44], where cases were defined as
a Croft score2 on either side of the hip or THR due to OA and controls were defined as a
Croft score1 on both sides of the hip and no THR. Hip OA cases in the GOAL and
Notting-ham OA studies were defined by having THR, and controls were radiographically free of hip OA,
as previously described [45]. In GARP, hip osteoarthritis was defined as pain or stiffness in the
groin and hip region on most days of the preceding month in addition to femoral or acetabular osteophytes or axial joint space narrowing on radiography or prosthesis due to osteoarthritis. In
GOGO, hip OA was defined as KL grade>= 2, or minimal joint space width<= 2.5 mm, or the
combination of joint space narrowing grade>= 2 and any osteophyte of grade>= 1, or history
of joint replacement for OA. In JoCo, hip OA cases were defined as KL grade>= 2 or THR in at
least one hip. Hip OA controls were defined as KL grade<= 1 in both hips.
Gene prioritization analysis
locus. We analysed 152 genes in 13 independent loci associated with minimal joint space width in the hip joint (mJSW) for 7 loci, hip OA for 4 loci, total joint replacement (TJR) for 1 locus
and total hip replacement (THR) for 1 locus [2]. We analysed the following biological evidence
for each gene at all loci; Nearest located genes: Taken from the UCSC genome browser,
GRCh37/hg19 [46]. DEPICT gene prioritization: Data-driven Expression-Prioritized
Integra-tion for Complex Traits, a novel tool designed to identify the most likely causal gene in a given
locus and to gene sets that are enriched in the genetic associations [21]. DEPICT was used to
prioritize genes in a 1 MB region around the found SNPs that were significant associated with the osteoarthritis phenotype, taking a region of 500 Kb upstream and 500Kb downstream of the lead SNP of that locus. Gene prioritization analysis was performed to directly investigate functional similarities among genes from different associated regions, significance was defined
by false discovery rate (FDR5%). GRAIL gene prioritization: Gene Relationships Across
Implicated Loci (GRAIL), was used to determine connectively between genes across OA
impli-cated loci based on literature associations [22]. A GRAIL analysis was performed on 10
inde-pendent OA associated loci, based on existing literature in PubMed till August 2014. Mouse gene expression and phenotype: For each investigated gene, expression in mouse bone and/or cartilage tissue during several developmental stages as well as for adult tissue was determined
using data from the Jackson lab database (http://www.informatics.jax.org/). In addition mouse
phenotype data was also obtained for each gene. OMIM phenotype: Using the Online Mende-lian Inheritance in Man (OMIM) database we examined which genes were involved in
abnor-mal skeletal growth syndromes when mutated (http://omom.org). Expression quantitative trait
loci: eQTL information was taken from the Blood eQTL browser (http://genenetwork.nl/
bloodeqtlbrowser/) and the eQTL browser (http://www.ncbi.nlm.nih.gov/projects/gap/eqtl/ index.cgi) using the lead SNP in each locus [20]. Non-synonymous variants: Last we
deter-mined if there were any nonsynonymous variants in LD (r2>0.06) with the lead SNP of a
locus, using HaploReg V2 and the SNP Annotation and Proxy Search (SNAP) tools [47,48].
For each gene we assigned a score based on equally weighted lines of evidence.
Human cartilage gene expression
We have used cartilage samples from the RAAK study to study gene expression in preserved
and affected cartilage from individuals undergoing joint replacement [19]. The ongoing
Afterin vitrotranscription, amplification, and labeling with biotin-labeled nucleotides (Illu-mina TotalPrep RNA Amplification Kit) Illu(Illu-mina HumanHT-12 v3 microarrays were hybrid-ized. Sample pairs were randomly dispersed over the microarrays, however each pair was measured on a single chip. Microarrays were read using an Illumina Beadarray 500GX scanner and after basic quality checks using Beadstudio software data were analyzed in R statistical pro-gramming language. Intensity values were normalized using the “rsn” option in the Lumi-package and absence of large scale between-chip effects was confirmed using the Globaltest-package in which the individual chip numbers were tested for association to the raw data. After
removal of probes that were not optimally measured (detectionP>0.05 in more than 50% of
the samples) a paired t-test was performed on all sample pairs while adjusting for chip (to adjust for possible batch effects) and using multiple testing correction as implemented in the “BH” (Benjamini and Hochberg) option in the Limma-package. Analyses for differential expression between OA and healthy and between preserved and healthy cartilage was per-formed likewise, adjusting in addition for sex and for age.
Exome sequencing
Exome sequencing was performed in 2628 individuals from the Rotterdam Study the average mean coverage was 55x, corresponding to approximately 80% of the targeted regions covered
by at least 20 reads. The exome sequencing was performed in house (HuGe-F,www.glimDNA.
org). Details of the technical procedure and variant calling are given inS2 Text. We tested the
exome variants for association with mJSW and/or hip OA in two ways. Each individual variant was tested for association with mJSW using the single variant option within RV-test, while adjusting for age and sex. In addition, we did a burden test for each of the selected genes by using SNP-set kernel association test (SKAT-O). SKAT aggregates individual score test
statis-tics of SNPs in a SNP set and computes SNP-set level p-values for a gene [23].
Visualization of the regulatory landscape of mJSW associated loci
For each of the top mJSW GWAS associated SNPs the LD region was determined using the
1000G Phase 1 population using the Haploreg tool [47]. The LD threshold was set at r20.8.
For each of these SNPs it was determined if the variant was located in a potential enhancer
region using the Roadmap consortium reference epigenomes data set [27]. Heatmaps were
constructed by calculating the percentage of variants in LD with the top mJSW GWAS found SNP located in enhancer regions as defined by the Roadmap epigenome chromatin states. The
reference epigenomes were downloaded from the official data portal accompanying [27].
Refer-ence epigenome data was used from mesenchymal stem cell derived chondrocyte cultured cells, Osteoblast, Bone marrow derived cultured mesenchymal stem cells, K562, HUVEC, HeLA and NHEK cells. Reference epigenomes were chromatin state models based on ChIPseq data of 5 core histone marks (H3K4me3, H3K4me1, H3K36me3, H3K27me3, H3K9me3) and an additional H3K27ac histone mark, the Roadmap expanded 18-state model.
ChIPseq data of mesenchymal stem cell derived chondrocyte cultured cells, and bone mar-row derived cultured mesenchymal stem cells were generated by the NHI roadmap
epige-nomics project [28]. ChIPseq data of, Osteoblast, K562, HUVEC, HeLA and NHEK cells were
generated by the ENCODE consortium [26]. All data and annotation tracks were downloaded
through the UCSC genome browser table tool. Visualization of all ChIPseq annotation and roadmap full epigenomes tracks was done through the UCSC genome browser on GRCh37/ hg19. Heatmaps were plotted in R using the CRAN software packages gplots and
Supporting Information
S1 Fig. Interquantile-quantile plot for the analysis of mJSW in the discovery cohorts.
(TIF)
S1 Table. Baseline characteristics of the studies included in the analyses of minimal Joint Space Width.
(XLSX)
S2 Table. Quality control and inclusion criteria.
(XLSX)
S3 Table. Analysed SNPs in discovery and replication cohorts.
(XLSX)
S4 Table. Results from the GCTA analysis on chromosome 6.
(XLSX)
S5 Table. Results from the GRAIL analysis.
(XLSX)
S6 Table. Results from the DEPICT analysis.
(XLSX)
S7 Table. Human and Mouse Phenotypes, gene expression in healthy tissue (human, mouse).
(XLSX)
S8 Table. eQTL analysis of hipOA related SNPs.
(XLSX)
S9 Table. Non-synonymous variants linked to the GWAS SNP.
(XLSX)
S10 Table. Gene expression in human cartilage tissue (differential expression)
(XLSX)
S11 Table. Association results of all Exonic variants (identified with Exome-seq) and mJSW.
(XLSX)
S12 Table. Results of multivariate analyses testing the joint effect of GWAS hits and exome variants on mJSW.
(XLSX)
S13 Table. Variants in linkage disequilibrium with rs11880992 which are located in regula-tory regions.
(XLSX)
S14 Table. Variants in linkage disequilibrium with rs496547 which are located in regula-tory regions.
(XLSX)
S15 Table. Variants in linkage disequilibrium with rs104948155 which are located in regu-latory regions.
S16 Table. Variants in linkage disequilibrium with rs2862851 which are located in regula-tory regions.
(XLSX)
S17 Table. Variants in linkage disequilibrium with rs2206662 which are located in regula-tory regions.
(XLSX)
S18 Table. Variants in linkage disequilibrium with rs10471753 which are located in regula-tory regions.
(XLSX)
S1 Text. Description of cohorts.
(DOCX)
S2 Text. Description of Exome sequencing and variant calling.
(DOCX)
Acknowledgments
The authors are grateful to the study participants, the staff from the Rotterdam Study and the participating general practitioners and pharmacists.
We thank Mr. Pascal Arp, Ms. Mila Jhamai, and Mr. Marijn Verkerk for their help in creat-ing the RS-Exome Sequenccreat-ing database. We thank Pascal Arp, Mila Jhamai, Marijn Verkerk, Lizbeth Herrera and Marjolein Peters, MSc, and Carolina Medina-Gomez, MSc, for their help in creating the GWAS database, and Karol Estrada, PhD, Yurii Aulchenko, PhD, and Carolina Medina-Gomez, MSc, for the creation and analysis of imputed data.
Author Contributions
Conceptualization: MCCB JBJvM.
Data curation: MCCB CGB JBJvM.
Formal analysis: MCCB DSE YFMR CGB SM YL JvR MSY AMV.
Funding acquisition: JBJvM.
Investigation: MCCB DSE YFMR CGB YL WdH JvR VBK MSY BDM KM AH MD SD WZ
RK FR EBC RAM NA RGHHN MK JMJ MCN EPS DJH FL US EZ EE TDS AGU NEL IM AMV JBJvM.
Methodology: MCCB CGB IM JBJvM.
Project administration: JBJvM.
Supervision: JBJvM AMV NEL IM AGU.
Validation: DSE YFMR SM YL WdH VBK MSY BDM KM MD SD WZ EBC RAM NA
RGHHN MK JMJ MCN EPS DJH FL.
Visualization: MCCB CGB JBJvM.
Writing – original draft: MCCB CGB JBJvM.
Writing – review & editing: MCCB DSE YFMR CGB SM YL WdH JvR VBK MSY BDM KM
References
1. Castaño Betancourt MC, Cailotto F, Kerkhof HJ, Cornelis FMF, Doherty SA, Hart DJ, et al. Genome-wide association and functional studies identify the DOT1L gene to be involved in cartilage thickness and hip osteoarthritis. Proc Natl Acad Sci U S A. 2012; 109: 8218–23. doi:10.1073/pnas.1119899109
PMID:22566624
2. Consortium A, Collaborators A. Identification of new susceptibility loci for osteoarthritis (arcOGEN): a genome-wide association study. Lancet. Elsevier Ltd; 2012; 380: 815–23. doi:10.1016/S0140-6736 (12)60681-3PMID:22763110
3. Kathiresan S, Voight BF, Purcell S, Musunuru K, Ardissino D, Mannucci PM, et al. Genome-wide asso-ciation of early-onset myocardial infarction with single nucleotide polymorphisms and copy number variants. Nat Genet. 2009; 41: 334–341. doi:10.1038/ng.327PMID:19198609
4. Kerkhof HJM, Meulenbelt I, Akune T, Arden NK, Aromaa A, Bierma-Zeinstra SMA, et al. Recommen-dations for standardization and phenotype definitions in genetic studies of osteoarthritis: the TREAT-OA consortium. Osteoarthritis Cartilage. 2011; 19: 254–64. doi:10.1016/j.joca.2010.10.027PMID:
21059398
5. Panoutsopoulou K, Southam L, Elliott KS, Wrayner N, Zhai G, Beazley C, et al. Insights into the genetic architecture of osteoarthritis from stage 1 of the arcOGEN study. Ann Rheum Dis. 2011; 70: 864–867. doi:10.1136/ard.2010.141473PMID:21177295
6. Castaño-Betancourt MC, Rivadeneira F, Bierma-Zeinstra S, Kerkhof HJM, Hofman A, Uitterlinden AG, et al. Bone parameters across different types of hip osteoarthritis and their relationship to osteoporotic fracture risk. Arthritis Rheum. 2013; 65: 693–700. doi:10.1002/art.37792PMID:23203458
7. Ingvarsson T, Ha¨gglund G, Lindberg H, Lohmander LS. Assessment of primary hip osteoarthritis: com-parison of radiographic methods using colon radiographs. Ann Rheum Dis. 2000; 59: 650–3. Available:
http://www.pubmedcentral.nih.gov/articlerender.fcgi?artid=1753211&tool=pmcentrez&rendertype= abstractPMID:10913065
8. Evangelou E, Valdes AM, Castano-Betancourt MC, Doherty M, Doherty S, Esko T, et al. The DOT1L rs12982744 polymorphism is associated with osteoarthritis of the hip with genome-wide statistical sig-nificance in males. Ann Rheum Dis. 2013; 72: 1264–5. doi:10.1136/annrheumdis-2012-203182PMID:
23505243
9. Pruim RJ, Welch RP, Sanna S, Teslovich TM, Chines PS, Gliedt TP, et al. LocusZoom: Regional visu-alization of genome-wide association scan results. Bioinformatics. 2010; 26: 2336–2337. doi:10.1093/ bioinformatics/btq419PMID:20634204
10. Estrada K, Styrkarsdottir U, Evangelou E, Hsu Y-H, Duncan EL, Ntzani EE, et al. Genome-wide meta-analysis identifies 56 bone mineral density loci and reveals 14 loci associated with risk of fracture. Nat Genet. 2012; 44: 491–501. doi:10.1038/ng.2249PMID:22504420
11. Wood AR, Esko T, Yang J, Vedantam S, Pers TH, Gustafsson S, et al. Defining the role of common variation in the genomic and biological architecture of adult human height. Nat Genet. 2014; 46: 1173– 86. doi:10.1038/ng.3097PMID:25282103
12. Nakajima M, Takahashi A, Tsuji T, Karasugi T, Baba H, Uchida K, et al. A genome-wide association study identifies susceptibility loci for ossification of the posterior longitudinal ligament of the spine. Nat Genet. Nature Publishing Group; 2014; 46: 1012–6. doi:10.1038/ng.3045
13. Berndt SI, Gustafsson S, Ma¨gi R, Ganna A, Wheeler E, Feitosa MF, et al. Genome-wide meta-analysis identifies 11 new loci for anthropometric traits and provides insights into genetic architecture. Nat Genet. 2013; 45: 501–12. doi:10.1038/ng.2606PMID:23563607
14. Lango Allen H, Estrada K, Lettre G, Berndt SI, Weedon MN, Rivadeneira F, et al. Hundreds of variants clustered in genomic loci and biological pathways affect human height. Nature. Nature Publishing Group; 2010; 467: 832–8. doi:10.1038/nature09410PMID:20881960
15. Yu B, Zheng Y, Alexander D, Morrison AC, Coresh J, Boerwinkle E. Genetic determinants influencing human serum metabolome among African Americans. PLoS Genet. 2014; 10: e1004212. doi:10. 1371/journal.pgen.1004212PMID:24625756
16. Tang X-F, Zhang Z, Hu D-Y, Xu A-E, Zhou H-S, Sun L-D, et al. Association analyses identify three sus-ceptibility Loci for vitiligo in the Chinese Han population. J Invest Dermatol. 2013; 133: 403–10. doi:10. 1038/jid.2012.320PMID:22951725
17. Zhernakova A, Stahl EA, Trynka G, Raychaudhuri S, Festen EA, Franke L, et al. Meta-analysis of genome-wide association studies in celiac disease and rheumatoid arthritis identifies fourteen non-HLA shared loci. PLoS Genet. 2011; 7: e1002004. doi:10.1371/journal.pgen.1002004PMID:21383967 18. Han J-W, Zheng H-F, Cui Y, Sun L-D, Ye D-Q, Hu Z, et al. Genome-wide association study in a
19. Ramos YFM, den Hollander W, Bove´e JVMG, Bomer N, van der Breggen R, Lakenberg N, et al. Genes involved in the osteoarthritis process identified through genome wide expression analysis in articular cartilage; the RAAK study. PLoS One. 2014; 9: e103056. doi:10.1371/journal.pone.0103056
PMID:25054223
20. Westra H-J, Peters MJ, Esko T, Yaghootkar H, Schurmann C, Kettunen J, et al. Systematic identifica-tion of trans eQTLs as putative drivers of known disease associaidentifica-tions. Nat Genet. Nature Publishing Group, a division of Macmillan Publishers Limited. All Rights Reserved.; 2013; 45: 1238–1243. doi:10. 1038/ng.2756PMID:24013639
21. Pers TH, Karjalainen JM, Chan Y, Westra J, Wood AR, Yang J, et al. Biological interpretation of genome-wide association studies using predicted gene functions. Nat Commun. Nature Publishing Group; 2015; 6: 5890. doi:10.1038/ncomms6890PMID:25597830
22. Raychaudhuri S. VIZ-GRAIL: Visualizing functional connections across disease loci. Bioinformatics. 2011; 27: 1589–1590. doi:10.1093/bioinformatics/btr185PMID:21505031
23. Wu MC, Lee S, Cai T, Li Y, Boehnke M, Lin X. Rare-variant association testing for sequencing data with the sequence kernel association test. Am J Hum Genet. 2011; 89: 82–93. doi:10.1016/j.ajhg. 2011.05.029PMID:21737059
24. Maurano MT, Humbert R, Rynes E, Thurman RE, Haugen E, Wang H, et al. Systematic localization of common disease-associated variation in regulatory DNA. Science. 2012; 337: 1190–5. doi:10.1126/ science.1222794PMID:22955828
25. Trynka G, Sandor C, Han B, Xu H, Stranger BE, Liu XS, et al. Chromatin marks identify critical cell types for fine mapping complex trait variants. Nat Genet. 2013; 45: 124–30. doi:10.1038/ng.2504
PMID:23263488
26. Rosenbloom KR, Sloan C a, Malladi VS, Dreszer TR, Learned K, Kirkup VM, et al. ENCODE data in the UCSC Genome Browser: year 5 update. Nucleic Acids Res. 2013; 41: D56–63. doi:10.1093/nar/ gks1172PMID:23193274
27. Consortium RE, Kundaje A, Meuleman W, Ernst J, Bilenky M, Yen A, et al. Integrative analysis of 111 reference human epigenomes. doi:10.1038/nature14248PMID:25693563
28. Bernstein BE, Stamatoyannopoulos J a, Costello JF, Ren B, Milosavljevic A, Meissner A, et al. The NIH Roadmap Epigenomics Mapping Consortium. Nat Biotechnol. Nature Publishing Group; 2010; 28: 1045–8. doi:10.1038/nbt1010-1045PMID:20944595
29. Appleton CTG, Usmani SE, Bernier SM, Aigner T, Beier F. Transforming growth factor alpha suppres-sion of articular chondrocyte phenotype and Sox9 expressuppres-sion in a rat model of osteoarthritis. Arthritis Rheum. 2007; 56: 3693–705. doi:10.1002/art.22968PMID:17968906
30. Usmani SE, Pest M a, Kim G, Ohora SN, Qin L, Beier F. Transforming growth factor alpha controls the transition from hypertrophic cartilage to bone during endochondral bone growth. Bone. Elsevier Inc.; 2012; 51: 131–41. doi:10.1016/j.bone.2012.04.012PMID:22575362
31. Fairfax BP, Humburg P, Makino S, Naranbhai V, Wong D, Lau E, et al. Innate immune activity condi-tions the effect of regulatory variants upon monocyte gene expression. Science. 2014; 343: 1246949. doi:10.1126/science.1246949PMID:24604202
32. Enomoto H, Enomoto-Iwamoto M, Iwamoto M, Nomura S, Himeno M, Kitamura Y, et al. Cbfa1 is a pos-itive regulatory factor in chondrocyte maturation. J Biol Chem. 2000; 275: 8695–702. Available:http:// www.ncbi.nlm.nih.gov/pubmed/10722711PMID:10722711
33. Dyment D a, Smith AC, Alcantara D, Schwartzentruber J a, Basel-Vanagaite L, Curry CJ, et al. Muta-tions in PIK3R1 Cause SHORT Syndrome. Am J Hum Genet. 2013; 158–166. doi:10.1016/j.ajhg. 2013.06.005PMID:23810382
34. Volders P-J, Verheggen K, Menschaert G, Vandepoele K, Martens L, Vandesompele J, et al. An update on LNCipedia: a database for annotated human lncRNA sequences. Nucleic Acids Res. 2014; 43: D174–D180. doi:10.1093/nar/gku1060PMID:25378313
35. Tsuchimochi K, Otero M, Dragomir CL, Plumb DA, Zerbini LF, Libermann TA, et al. GADD45beta enhances Col10a1 transcription via the MTK1/MKK3/6/p38 axis and activation of C/EBPbeta-TAD4 in terminally differentiating chondrocytes. J Biol Chem. 2010; 285: 8395–407. doi:10.1074/jbc.M109. 038638PMID:20048163
36. Evangelou E, Valdes a M, Kerkhof HJM, Styrkarsdottir U, Zhu YY, Meulenbelt I, et al. Meta-analysis of genome-wide association studies confirms a susceptibility locus for knee osteoarthritis on chromo-some 7q22. Ann Rheum Dis. 2013; 70: 349–355. doi:10.1136/ard.2010.132787.Meta-analysis 37. Reynard LN. Analysis of genetics and DNA methylation in osteoarthritis: What have we learnt about
the disease? Semin Cell Dev Biol. 2016; doi:10.1016/j.semcdb.2016.04.017
39. Willer CJ, Li Y, Abecasis GR. METAL: Fast and efficient meta-analysis of genomewide association scans. Bioinformatics. 2010; 26: 2190–2191. doi:10.1093/bioinformatics/btq340PMID:20616382 40. Yang J, Lee SH, Goddard ME, Visscher PM. GCTA: A tool for genome-wide complex trait analysis.
Am J Hum Genet. The American Society of Human Genetics; 2011; 88: 76–82. doi:10.1016/j.ajhg. 2010.11.011PMID:21167468
41. Reijman M, Hazes JMW, Pols HAP, Bernsen RMD, Koes BW, Bierma-Zeinstra SMA. Validity and reli-ability of three definitions of hip osteoarthritis: cross sectional and longitudinal approach. Ann Rheum Dis. 2004; 63: 1427–33. doi:10.1136/ard.2003.016477PMID:15479891
42. Lane NE, Nevitt MC, Hochberg MC, Hung Y-Y, Palermo L. Progression of radiographic hip osteoarthri-tis over eight years in a community sample of elderly white women. Arthriosteoarthri-tis Rheum. 2004; 50: 1477– 86. doi:10.1002/art.20213PMID:15146417
43. Kinds MB, Vincken KL, Vignon EP, ten Wolde S, Bijlsma JWJ, Welsing PMJ, et al. Radiographic fea-tures of knee and hip osteoarthritis represent characteristics of an individual, in addition to severity of osteoarthritis. Scand J Rheumatol. 2012; 41: 141–9. doi:10.3109/03009742.2011.617311PMID:
22171981
44. Nevitt MC, Lane NE, Scott JC, Hochberg MC, Pressman a. R, Genant HK, et al. Radiographic osteoar-thritis of the hip and bone mineral density. The Study of Osteoporotic Fractures Research Group. Arthritis Rheum. 1995; 38: 907–16. Available:http://www.ncbi.nlm.nih.gov/pubmed/7612040PMID:
7612040
45. Valdes AM, McWilliams D, Arden NK, Doherty SA, Wheeler M, Muir KR, et al. Involvement of different risk factors in clinically severe large joint osteoarthritis according to the presence of hand interphalan-geal nodes. Arthritis Rheum. 2010; 62: 2688–95. doi:10.1002/art.27574PMID:20499385
46. Kent WJ, Sugnet CW, Furey TS, Roskin KM, Pringle TH, Zahler a. M, et al. The Human Genome Browser at UCSC. Genome Res. 2002; 12: 996–1006. doi:10.1101/gr.229102PMID:12045153 47. Ward LD, Kellis M. HaploReg: A resource for exploring chromatin states, conservation, and regulatory
motif alterations within sets of genetically linked variants. Nucleic Acids Res. 2012; 40: 930–934. doi:
10.1093/nar/gkr917