WHAT MOTIVATES LOCAL LEADERS TO RESTRICT IMMIGRATION? POLITICAL AND DEMOGRAPHIC ELECTORAL PRESSURES IN COUNTY-LEVEL IMMIGRATION
ENFORCEMENT POLICYMAKING
Eroll Kuhn
A thesis submitted to the faculty at the University of North Carolina at Chapel Hill in partial fulfillment of the requirements for the degree of Master of Arts in the Department of Political Science in the School of
Liberal Arts and Sciences.
Chapel Hill 2017
Approved by:
Rahsaan Maxwell
Gary Marks
c 2017 Eroll Kuhn
ABSTRACT
Eroll Kuhn: What Motivates Local Leaders to Restrict Immigration? Political and Demographic Electoral Pressures in County-Level Immigration Enforcement Policymaking
(Under the Direction of Rahsaan Maxwell)
Using a novel dataset on county-level immigration enforcement policies in the US, I explore
the role of demography and political geography in local immigration enforcement
policymaking. I find evidence that local immigration enforcement policy becomes more
restrictive where Hispanic populations are large and visible, and that this restrictive effect
disappears when Hispanic populations are large enough. I also find that local political
dynamics are far stronger predictors of immigration enforcement policies. My results indicate
that expansionary policy outcomes seem especially probable in safe democratic districts, where
local liberal elites are least likely to bear costs from illiberal publics. Competitive counties,
rather than starkly Republican ones, are marked by the most restrictive policy environments.
In a finer-grained analysis I explore mechanisms, and discover that Hispanic community
mobilization can oppose restriction where populations are sufficiently large, but only the
TABLE OF CONTENTS
1 Theories of Immigration Politics . . . 3
2 Sources of Electoral Pressure . . . 7
3 Scope Conditions . . . 11
4 Measuring Local Immigration Enforcement Policy . . . 12
5 Explanatory Variables . . . 14
6 Sample . . . 16
7 Model . . . 17
8 Results . . . 18
9 Policy-by-Policy Analysis . . . 23
10 Robustness Check . . . 27
11 Conclusion . . . 28
12 Appendix . . . 30
12.1 Coding the Dependent Variable . . . 30
12.2 Analysis: Including Texas . . . 32
12.3 Ordered Logistic Model . . . 33
12.4 Imputed Data . . . 34
LIST OF FIGURES
LIST OF TABLES
1 Local Policy Menu . . . 13
2 Counts of Dependent Variable . . . 14
3 Descriptive Statistics: County-Level Variables . . . 16
4 Descriptive Statistics: State-Level Variables . . . 16
5 Statistical models . . . 20
6 Counts of Active County-Level Policies in 2016 . . . 23
7 Logistic Models of Expansionary Policy Outcomes . . . 24
8 Logistic Models of Restrictive Policy Outcomes . . . 25
9 Linear Multilevel Model: Including Texas . . . 32
10 Multilevel Ordinal Logistic Regression . . . 33
What Motivates Local Leaders to Restrict Immigration? Political and
Demographic Electoral Pressures in County-Level Immigration
Enforcement Policymaking
Eroll Kuhn
August 4, 2017
The consensus on what drives immigration policymaking has shifted over the past two decades. Long characterized as a function of “quiet,” interest group-driven bargaining (Freeman 1995; Ham-mar 1985), or of the judiciary’s expansion of rights (Joppke 2001; Guirandon 2002), recent work on immigration policymaking has emphasized “loud” politics: electoral competition on cultural issues and partisan responsiveness to voter preferences. Given the rising salience of cultural, post-material issues in political competition (Inglehart 1981), the supremacy of expansionary interest group pressures in immigration policymaking has been called into question by numerous scholars. Even theories that emphasize interest group activity as the key driver of policy outcomes recognize that publics are predominantly illiberal and skeptical of immigration (Freeman 1995; Hainmueller and Hopkins 2014). Electoral theories of policymaking emphasize the politicization of these il-liberal attitudes through partisan competition, and predict restrictive policy outcomes. If local or national electorates feel that they are bearing large or disproportionate costs for immigration, parties or candidates that campaign on restrictive immigration policies, and pursue such policies once in office, should benefit relative to parties and candidates that pursue quiet, expansionary policymaking. This creates strong incentives for political leaders to do away with expansionary policies.
electoral pressures. Of the numerous contextual factors that have been examined, demography is linked most consistently to attitudes: studies find that large out-group populations – and rapid growth in out-group populations – are associated with lower trust (Putnam 2007) and restrictive and exclusionary policy preferences (Enos 2015; Hopkins 2011). However, the link between de-mography and policy outcome is more tenuous, and rigorous empirical and theoretical work on the relationship between Hispanic community size and immigration policy begets contradictory results. In-line with Racial Threat frameworks (or, more accurately, Ethnic Threat frameworks), which propose that White (or Anglo) populations respond to large or growing outgroup populations with restrictive or exclusionary policies (Key 1949; Stein, Post, and Rindin 2000; Tolbert and Grummel 2003), larger or growing Hispanic populations have been linked to exclusion and restriction of immi-gration (Tolbert and Hero 1996; Hopkins 2011). However, other researchers have linked increasing Hispanic population size to improved descriptive and substantive representation (Mansbridge 1999; Preuhs 2007) and greater interest group mobilization (Martinez 2011). In this paper, I work to reconcile the theoretical contradictions of these two models of immigration policymaking. I propose and test a curvilinear theory of demography and immigration policy, in which Ethnic Threat kicks in as Hispanic populations become visible, but is counteracted when Hispanic communities are large enough to be electorally relevant and mobilized.
from competing on immigration restriction. In conservative and mixed regions, we should expect to see restriction.
Using a novel dataset on county-level immigration enforcement policies in the US, I explore the role of demography and political geography in local immigration enforcement policymaking. Indeed, I find statistically significant evidence that local immigration enforcement policy becomes more restrictive where Hispanic populations are large and visible, but also that this restrictive effect disappears when Hispanic populations are large enough. However this demographic effect is very small in substantive terms, and contingent on the exclusion of Texan counties from my sample. In line with Wong (2012), Lewis et al. (2013), and Chavez and Provine (2009), I find that local political dynamics are far stronger predictors of immigration enforcement policies. Resembling Money’s (1999) findings, my results indicate that expansionary policy outcomes seem especially probable in safe democratic districts, where local liberal elites are least likely to bear costs from illiberal publics. Meanwhile, competitive counties – rather than starkly Republican ones, where electoral pressures are also reduced – are marked by the most restrictive policy environments. In a finer-grained, policy-by-policy, analysis I explore the mechanisms, and find that Hispanic community mobilization can oppose restriction where populations are sufficiently large, but only the absence of electoral pressures for restriction can lead to truly expansionary policies. These results are robust to state-level political dynamics that have been found to drive immigration policy outcomes.
1
Theories of Immigration Politics
The first category pertains to rights and benefits granted to newcomers of various stripes. Given variation in the accessibility of citizenship, the stringency of anti-discrimination legislation, and generosity of welfare states, scholars have explored what national and sub-national factors drive policy outcomes. For the sake of conceptual clarity, the policy environment dictating access to rights and benefits can range from exclusionary toinclusionary. The second broad category of policy outcomes relates to how governments legislate the movement and presence of migrants. Open border policies and freedom of movement, immigration quotas and restrictions, and visa programs mediate the number, and characteristics, of migrants who enter a country. Immigration enforcement at the border and in the interior further conditions how feasible it is for (undocumented) migrants to remain and work in the host society. The extent to which policies effect movement and presence of migrants ranges fromrestrictive toexpansionary.1 In this paper, I limit myself to an exploration of what drives local leaders to pursue immigration controls, and do not attempt to address the sources and drivers of immigrants‘ rights. However, given the conflation of the two concepts in extant theories of immigration policymaking, my subsequent discussion of immigration politics examines both categories of policy outcomes.
The literature on immigration politics can be divided into two theoretical families. While some scholars emphasize the nexus between interest groups and elected officials, others find that policy follows from the responsiveness of parties to (largely illiberal) public opinion. The dominant models of migration politics in the late 20th century, drawn from Hammar (1985), and formalized by Freeman (1995), emphasize quiet “client politics” – politics in which interest groups and state actors decided on immigration policies and immigrant rights legislation.These frameworks gravitate around the idea that rational state actors, especially elected representatives, mobilize the interests of those who pay most attention to a given issue. Certain business elites and migrant organization enjoy concentrated costs from inclusive, expansive policies, while the public experience diffuse costs. These costs can be fiscal, such as paying taxes for immigrant benefits, or simply the function of
1
I make this distinction between policy categories to emphasize that objectives of legislation need not be strictly pro- or anti-immigrant. A national or subnational government can increase immigration without expanding rights to immigrants, or severely limit immigration while granting extensive rights to the immigrants who are granted entrance. Policies that limit access to the welfare state can restrict immigration through the reduction of incentives to immigrate in the first place. International agreements, such as Schengen, can open borders to more movement
distaste at a growing immigrant community. These costs are indirect and diffuse across an entire polity, and thus less likely to elicit organizations devoted to curtailing immigration or migrant rights. Business leaders seeking low-wage immigrant labor, meanwhile, have more of an incentive to pool resources and mobilize. Elected officials respond to the organized beneficiaries of migration, and are less accountable to the unorganized public.2
Scholars have accentuated Freeman‘s model by highlighting how interest groups utilize specific venues and frames to achieve expansionary and inclusionary goals. Guirandon (2002) theorizes that the most consistent advocates of increased immigration and migrant rights have been courts and bureaucrats, rather than elected officials. Courts have an interest in consistency, and judges fear appearing impartial when laws are applied inconsistently across groups. Meanwhile, administrators and policy writers also have an egalitarian bias: they favor “legalistic solutions that standardize operation.” Implicit in Guirandon‘s framework is that organized interests take advantage of the interest and opportunity structures within bureaucracies and the courts to advance their interests. Joppke (2001) narrows the scope further, and argues that primarily courts, not administrators, extend rights. Judicial actors recognize that “if liberal-democratic states are faithful to their own principles, they must either approximate the rights of (long-settled) aliens to those of citizens, or, if they continue discriminating against aliens, they must make citizenship easily accessible to them.” Empirical work on the role of interest groups in the politics of immigration control has focused heavily on the impact of industry lobbying, with mixed results at the national and subnational level (see for example Rheault 2013; Peters 2014, 2015; Boushey and Luedtke 2011). Why does Freeman’s model encounter significant empirical headwind, especially sub-nationally? Recent evi-dence suggests that illiberal publics are more influential than earlier models predicted, and that the nexus between voters and parties – rather than between interest groups and state actors – drives policy outcomes with respect to immigration. Rather than stand-by as business leaders, migrant organizers, and elected officials collude to expand immigration and include migrants into social benefits programs, parties – especially populist parties – respond to the preferences of illiberal publics with exclusionary, restrictive policies. In-line with the increasing attention paid to cultural cleavages in public opinion, and the electoral turn more generally, recent research on immigration
2See Cornelius and Rosenblum (2004) for an excellent, in-depth overview of interest-group and
politics predicts that parties will compete for illiberal voters by actively eschewing “quiet” politics on immigration.
Taken as a whole, the literature indicates that public opinion and attitudes play an important role in immigration policy outcomes, both through electoral competition and direct democracy. Perlmutter (1996) integrated electoral competition into theories of immigration politics by high-lighting that Freeman’s assumption of diffuse and uniform costs of immigration to the public does not hold, since spatial distribution of immigrant populations is uneven. Immigration, he argued, should become politicized at the regional or municipal level, in areas with greater immigration – or simply when voters perceive that they are bearing disproportional costs. European multi-party systems, the increasing salience of immigration gives populist demarcationist/tanparties an oppor-tunity for growth (Hooghe and Marks 2009). To woo illiberal voters who perceive both economic and cultural costs, these parties compete on restrictive and exclusionary platforms, in which im-migration politics is a high-salience issue. These parties emphasize their stances on the cultural dimension of competition, which is secondary for established parties across the economic spectrum (Rovny 2013).
In two party systems, populist parties are limited in their ability to compete for government positions. Until the 1980s, stances on immigration cut across party lines in the United States. Given the plurality system, populist could not emerge as in Europe, and immigration was politicized in the 1980s and 90s along existing party lines, leading to a realignment of voters on an issue that previously cut across party lines (Monogan and Doctor, 2017; Bowler et al. 2006). Subnational political dynamics such as Proposition 187 in California proved especially important catalysts of realignment for Hispanic populations, since they signaled where the two main parties positioned themselves in an era of electoral immigration politics. In short, recent scholarship on immigration politics emphasizes an electoral turn, a process that has rendered “quiet politics” impossible.3
3
2
Sources of Electoral Pressure
Interest-group models of immigration policymaking predicted expansionary and, to a lesser extent, inclusionary policies. Electoral models predict the opposite; given the illiberal nature of the public, the politicization of immigration benefits those who advocate for greater controls. To discern under what conditions leaders face electoral pressures to pass these restrictive immigration policies, much recent scholarship has focused on why voters perceive they are bearing disproportional (or high) costs from immigration – and whether these attitudinal pressures actually translate into policy outcomes. Drivers of pressures can be disaggregated into two main families: demographic and political. Both factors have been linked to attitudes towards out-group members and policy pressures, but the association between regional political characteristics and policy outcomes is more consistently robust.
Ideology is consistently linked to attitudes, as well as to immigration policy outcomes, including immigration enforcement policies. In terms of attitudes, conservatives view immigrants as more of a threat to the economy, culture, and national security than liberals (Lahav 2013; Hussey and Pearson-Merkowitz 2013). Studies have also established a robust link between conservative ideology and restrictive and exclusionary policymaking (Chavez and Provine 2009; Boushey and Luedtke 2011). Wong (2012) even finds that law enforcement in conservative areas is more likely to seek and implement control policies against undocumented immigrants. Cumulatively, these studies indicate that elected leaders in conservative districts experience pressures to pass restrictive immigration enforcement policies.
In short, there are few electoral pressures for expansionary policy, but plenty of incentives – expect, possibly, in very liberal regions – for restriction. Indeed, Money (1999) finds evidence, at the national level in advanced Western democracies, that parties on the left and right are especially likely to signal restrictive stances and pursue restrictive policies in close electoral races. To be clear, left-leaning partiesdosee naturalized immigrants as potential voters, but appeal to these potential electorates through inclusive stances on integration policy. Aggressive immigration control stances paired with inclusionary integration policy, then, serve as a signal to electorates in ideologically mixed regions that parties are tough on immigration but welcoming of newcomers.
The implication of this political-ideological model is that electoral pressures for restrictions in competitive districts should resemble those in safely conservative ones. In safe liberal districts, leaders or candidates are unlikely to lose an election as a result of appearing soft on immigration, so face only pressures from voters that are unlikely to vote for them anyway. Freed from the shackles of an illiberal public, leaders in such safely liberal (Democratic) regions are free to respond to the concentrated beneficiaries of immigration – migrant-reliant business and migrant organizations – since the the benefits outweigh the public opinion costs. Simply put, I posit a curvilinear relation-ship between local ideology and immigration policy; a restrictive status quo in conservative and mixed areas, but a strong expansionary effect where liberals make up a dominant majority. Policies will be most restrictive where politics is loud and competitive, as well as where the electorate is predominantly conservative.
Hypothesis 1a: Regions with predominantly liberal electorates should be associated with expansionary immigration policymaking.
Hypothesis 1b: Regions with predominantly conservative as well as mixed electorates should be associated with similar levels of restriction, in comparison to predominantly liberal regions.
Similar to Racial Threat frameworks derived from analyses of local Black-White political dy-namics (Key 1949), numerous scholars have demonstrated that Anglo populations respond to large or growing outgroup populations with restrictive or exclusionary policies (Tolbert and Hero 1996; Stein, Post, and Rindin 2000; Tolbert and Grummel 2003).4 Concerns about wage-depressing effects of immigrant labor generates anxiety about immigration among workers in industries or regions that rely, or could rely, on low-wage immigrant labor (Mayda 2006; Scheve and Slaughter 2001; Fachinni and Mayda 2012). Moreover, scarce or insecure employment opportunities aggravate competition between groups competing for the same resources (Gay 2006). Parochial preferences for exclusion follow from this economic threat, and local leaders respond by protecting native labor by closing off employment to immigrants and restricting immigration.5 Given that the majority of foreign-born residents in the United States identify as Hispanic, and immigrant- and citizen-status are invisible, the Ethnic Threat effect is activated by – and maps onto – large Hispanic populations, rather than specifically (undocumented) immigrant populations.
With some exceptions (Hopkins 2011; Ybarra et al. 2016), the application of the Ethnic Threat framework yields more consistent results about attitudes than policy outcomes. Evidence suggests that restrictive and exclusionary policy pressures among Anglos are counteracted when Hispanic populations are large enough (Tolbert and Hero 1996) because quality of representation of im-migrant interests improves as the imim-migrant electorate expands (Ramakrishnan and Lewis 2005; Roche and Matsubayashi 2013). Though it is a stretch to assume that Hispanic communities and leaders automatically pursue the interest of immigrants in their political behavior, there is evidence that Hispanic political actors advocate on behalf of immigrant communities and interests (Martinez 2011). Moreover, given the prevalence of mixed-status families, expansionary immigration policy serves as way to reunite families. Where we see greater racial threat we should also see better descriptive representation (Preuhs 2007). In conjunction, these factors should counteract the re-strictive public pressures on elected leaders. Public preferences should also be mediated by the strength and organization of immigrant communities. Where the Hispanic population is larger and better entrenched, Hispanic voters are more mobilized and better connected to one another in the
4I will refer to the application of out-group threat effect to Hispanic populations as the Ethnic Threat hypothesis
for the remainder of the paper.
5
United States. Moreover, when co-ethnic candidates run for office, which becomes more likely in regions with a larger Hispanic population, voter turnout among Hispanic is higher (Barretto 2007). Though large immigrant populations trigger exclusionary policy preferences among natives, elected leaders will encounter cross-pressures from mobilized and politically active Hispanic communities who are opposed to the exclusion of immigrants and Hispanics. In a historical overview of na-tional immigration policymaking in the United States, Goldin (1994) tells a similar story. Despite restrictive preferences attributable to economic downturns in the early years of the 20th century, and substantial interest group pressures, naturalized immigrants and their political allies in urban areas proved capable of resisting national-level quotas and literacy tests for decades, until 1921.
In addition to representation, numerous Hispanic and Immigrant rights organization are active at the local level, and these groups should mediate the extent to which local elected officials respond to electorate preferences and attitudes and immigration. (Martinez 2011). The relationship between Latino advocacy groups and key court cases, such as MALDEF’s role in the 1980 extending K-12 education to undocumented children, is well-established (Olivas 2016). Where Hispanic populations are larger, such organizations should be more entrenched, organized, and able to mobilize on behalf of undocumented immigrants – on behalf of expansionary immigration enforcement policies.
Hypothesis 2a: Where Hispanic populations are large enough to be visible, local leaders will respond to electoral pressures and pass restrictive immigration policy.
Hypothesis 2b: As Hispanic population share surpasses a certain threshold, substantive rep-resentation will reverse the racial threat effect and lead to expansionary immigration policy.
3
Scope Conditions
In this paper I am focusing on local politics of restriction and expansion, rather than inclusion and exclusion. My results should be interpreted under those scope conditions; local politics of immigrants rights and benefits need not operate according to the same dynamics.
To get leverage on the question of what motivates local governments to legislate migration flows, I focus on a specific policy domain: immigration enforcement. Immigration enforcement policy determines the extent to which governments go out of their way to identify, apprehend, and process undocumented migrants – and is often intended to directly reduce migrant stock as well as incentives to immigration. Moreover, there is indeed evidence that migrants prefer to stay in more welcoming enforcement environments, though little consistent evidence that immigrants actually leave (“self deport” from) exclusionary environments (Rocha, Hawes, Fryar, and Wrinkle 2014). Immigration enforcement should not limit existing rights or benefits for immigrants who are on solid legal footing.6 The intensity with which local governments enforce immigration law varies greatly across subnational governments, both in Europe and the United States. For this reason, immigration enforcement policy represents a convenient measure of a local government’s preferences regarding immigration restriction/expansion, since it is divorced from potential preferences relating to inclusion/exclusion of migrants on solid legal footing.
In the United States, local immigration enforcement policy applies primarily to the behavior of police officers and ICE agents in county jails, institutions over which county sheriffs have juris-diction. Almost all county sheriffs are elected, and should therefore be exposed to the mechanism I aim to test, namely electoral pressures. Metropolitan police departments are usually managed by appointed police chiefs, and metropolitan police forces make up a large share of the national
6
police force. However, county sheriffs still operate the county jail in municipalities with metropoli-tan police departments – so county-level immigration enforcement policy should have an effect on immigration control even in cities where the county sheriff’s office is dwarfed by a metropolitan police department such as the NYPD or the LAPD. In other words, the elected officials I focus on have jurisdiction over immigration enforcement policy across the United States.
Another benefit of focusing on law enforcement policy relates to the limited autonomy of local governments. Immigration enforcement represent a means by which local governments can actually expand or restrict immigration through policymaking, or at least attempt to. Immigration policy is the domain of federal government in the United States. Local actors have no influence over how many or what types of migrants enter a country through national-level programs. The extent to which the federal government polices undocumented immigration is also beyond any individual local government. Control over immigration enforcement empowers local governments to condition the desirability of an area for existing and potential migrant communities. In addition to physically removing existing undocumented individuals, restrictive immigration policies provide incentives for mixed-status families to move elsewhere, and encourage potential migrants to seek out alternative destinations.
The final and maybe most important reason for focusing on local immigration enforcement policy is that variation in local policies matters for other political outcomes. Local immigration enforcement has political externalities; for example, harsher policy environments mobilize Hispanic turnout (White 2016) and effect Anglo and Hispanic trust in government (Rocha, Knoll, and Wrin-kle 2015). Even though Jaeger (2016) casts some doubt on whether restrictive local immigration enforcement policies actually lead to greater de facto restriction – that is, to greater numbers of apprehensions and deportations – migrant communities and their allies respond to policy environ-ments. Understanding what drives local policymaking, if not policy enforcement or “success”, can help us understand political behavior and attitudes more generally.
4
Measuring Local Immigration Enforcement Policy
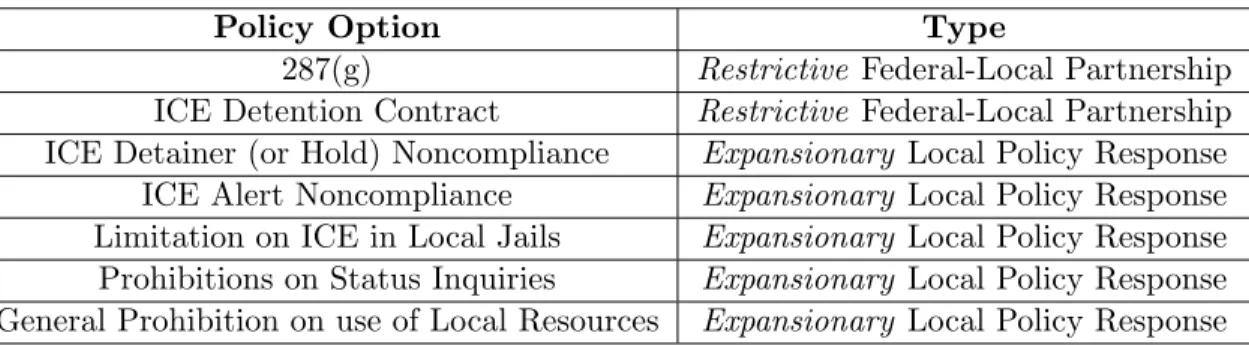
(ICE). Local participation in immigration enforcement is voluntary; police forces are under no legal obligation to aid ICE, and are actually more likely to face legal repercussions for collabora-tion due to violacollabora-tions of constitucollabora-tional rights. When considering whether and to what extent they will collaborate with ICE, police departments and jails face a menu of policy options. The data I use in my analysis, which comes from the Immigration Legal Resource Center (ILRC),7 measures the level of institutionalized entanglement between between county-level law enforcement and ICE. Specifically, the ILRC dataset indicates whether jails or sheriffs had entered into seven different partnerships between ICE and local law enforcement as of 2016. These seven policies are not ex-haustive. Police forces and jails have recourse to other forms of partnerships or internal policies, but these are the seven most common policies (ILRC). Given that reliable data on local policies is time-consuming and difficult to collect for over 3000 counties, the policy menu outlined below captures much of the county-level variance in immigration enforcement policy climates. Some of the policies outlined below are official collaborations between the local and federal agencies, while others are explicit bans on collaboration made exclusively at the local level. The seven policies are listed in Table 1, along with their classification in terms of restrictive or expansionary intent. See the Appendix for a description of these policies, and for greater insight into coding of the dependent variable.
Policy Option Type
287(g) Restrictive Federal-Local Partnership ICE Detention Contract Restrictive Federal-Local Partnership ICE Detainer (or Hold) Noncompliance Expansionary Local Policy Response ICE Alert Noncompliance Expansionary Local Policy Response Limitation on ICE in Local Jails Expansionary Local Policy Response Prohibitions on Status Inquiries Expansionary Local Policy Response General Prohibition on use of Local Resources Expansionary Local Policy Response
Table 1: Local Policy Menu
For my dependent variable, I construct an additive index from these seven policy options by dummying out each policy option and summing these binaries. If county law enforcement chooses to implement an expansionary local policy response, or not implement a restrictive federal-local partnership, the county receives a value of 1 for that given “policy option.” Conversely, a county
is coded 0 for a given “policy option” if local law enforcement enters into a restrictive federal-local partnership or does not implement an expansionary local policy response. As a result, the 8-point ordered dependent variable is non-negative, with a minimum of 0 (most restrictive) and a maximum of 7 (least restrictive). Given that there are two restrictive and five expansionary policies, a score of 2 on the dependent variable represents no deviation in either an expansionary or restrictive direction.8 For an overview of the ILRC data, see Table 2.9 In subsequent analyses, I assume that this variable is continuous – indicative of a policy climate that runs from restrictive to expansionary.
Missing 0 1 2 3 4 5 6 7 552 16 96 1858 416 92 75 7 2 Table 2: Counts of Dependent Variable
For a map of my dependent variable, see Figure 1. As should be clear from the map, counties in Western states are the most expansionary, while Midwestern and Northeastern states are less restrictive than Southern counties.
5
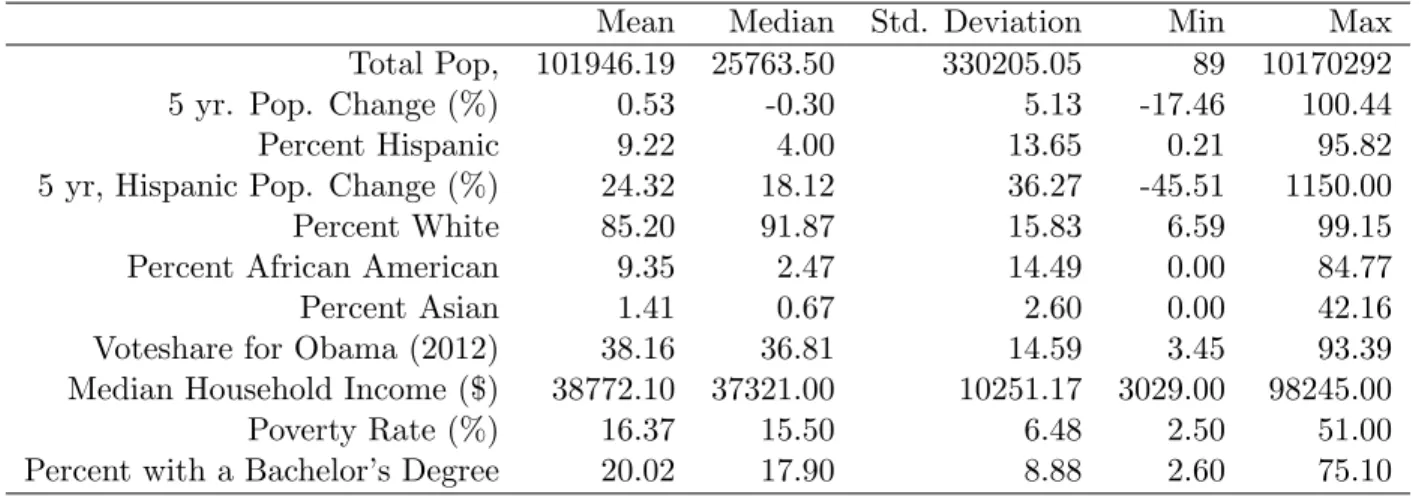
Explanatory Variables
To test my hypotheses and control for other drivers of immigration policymaking, I collected county-level political, economic, and demographic data. Unless stated otherwise, the variables outlined in this section are from 2014. All county-level independent variables are summarized in Table 3. The demographic data included in my models, including the important Hispanic population share variable, comes from annual US census estimates. I utilize presidential vote share at the county level as a proxy for local ideology. Specifically, my measure of liberal ideology is the percentage of the presidential vote won by Barack Obama in the 2012 presidential elections, which I gather from Congressional Quarterly data.10 To control for local economic conditions and relative deprivation, I collected county-level poverty rates and median household income as proxies. These measures are from Census SAIPE datasets. Since education has been shown to predict attitudes towards
8
Though there are of course ways to score a 2 on the DV that involve a mixture of restriction and expansion, though this is very uncommon. Counties tend to restrictorexpand.
9
Alaska’s 30 county-equivalent subdivisions are excluded from the sample.
10
ILRC_T
otal
0 to 1
1 to 2
2 to 3
3 to 4
4 to 5
5 to 6
6 to 7
Missing
Figure
1:
Map
of
Lo
cal
Immigration
Enforcemen
t
P
olicy
Sev
erit
immigration, I also include the percentage of county’s population with a Bachelor’s degree, derived from the USDA.
Mean Median Std. Deviation Min Max Total Pop, 101946.19 25763.50 330205.05 89 10170292 5 yr. Pop. Change (%) 0.53 -0.30 5.13 -17.46 100.44 Percent Hispanic 9.22 4.00 13.65 0.21 95.82 5 yr, Hispanic Pop. Change (%) 24.32 18.12 36.27 -45.51 1150.00 Percent White 85.20 91.87 15.83 6.59 99.15 Percent African American 9.35 2.47 14.49 0.00 84.77 Percent Asian 1.41 0.67 2.60 0.00 42.16 Voteshare for Obama (2012) 38.16 36.81 14.59 3.45 93.39 Median Household Income ($) 38772.10 37321.00 10251.17 3029.00 98245.00 Poverty Rate (%) 16.37 15.50 6.48 2.50 51.00 Percent with a Bachelor’s Degree 20.02 17.90 8.88 2.60 75.10
Table 3: Descriptive Statistics: County-Level Variables
In a robustness check I include state-level variables that have been shown to effect immigration policymaking, including partisan composition in state legislatures and descriptive representation (Preuhs 2007). These variables, drawn from the National Conference of State Legislatures, are summarized in Table 4.
Mean Median Std. Deviation Min Max State Legislators: % Democratic 38.21 36.43 12.70 14.44 88.16 State Legislators: % Latino 3.95 0.76 7.49 0.00 43.75
Table 4: Descriptive Statistics: State-Level Variables
6
Sample
Hispanic population share above 90% are in this subset of Texan counties, for example – and very restrictive policy environments (possibly due to the proximity to the border). I exclude Texas in my main analysis to limit the effects of a few influential data points on my results, but provide an auxilliary analysis in the Appendix that includes Texas. In total, my sample consists of 2378 counties.11
7
Model
In my analysis I fit a multilevel linear model with random intercepts at the state level to my data. I also fit two additional multilevel models – one in which state-level intercepts are explicitly functions of state-level predictors of immigration policy, the other with state-level varying slopes – to control for interactions between county and state level dynamics in local policymaking. Given the number of clusters (43 in my main analysis), maximum likelihood estimation should provide unbiased estimates of lower- and higher-level coefficients and uncertainty (Stegmueller 2013). Though my dependent variable is an 8-level ordered outcome rather than a strictly continuous ones, treating the dependent variable as continuous is not unreasonable given the number of levels and the peaked distribution of the data (Jackman 2009). After my main analysis I run a robustness check with an ordinal logistic model, which begets comparable conclusions.
To test the four Hypotheses, I include linear and squared operationalizations of Hispanic pop-ulation share and democratic vote share in my model. The inclusion of both linear and squared terms allows me to model the curvilinear relationships between local ideology and partisanship that I expect. Hypothesis 1a predicts no relationship between the linear operationalization of Obama’s vote share and the immigration enforcement policy outcome. However, Hypothesis 1b predicts a positive and significant relationship between the square of Obama’s vote share and the dependent variable; whereas elected leaders have little incentive to pass expansionary policies in conservative in moderate counties, these pressures abate in strongly liberal districts. In other words, the positive association between liberal ideology and expansionary immigration enforcement policy should be picked up by the squared term, and not by the linear one. Hypothesis 2a predicts a negative and significant relationship between the linear operationalization of Hispanic population share. This
11
initial “ethnic threat” should dissipate when the Hispanic population share passes a certain thresh-old, and a representation effect kicks in. In other words, Hypothesis 2b predicts a positive and significant relationship between the squared operationalization of Hispanic population share and the immigration enforcement policy outcome.
My base model, which includes state-level random intercepts, can be formally represented by the following equation.
yij =α0j+β1i%Hispanic1ij+β2i%Hispanic21ij+β3i%Obama2ij+β4i%Obama22ij+βniControlsnij+i
(1) Where:
α0j =γ00+γ1jState+ηj (2)
In Model 2, the state level intercept is explicitly also a function of the partisan makeup of the state legislature and the percentage of the state legislature that identifies as Hispanic. The State-level means in Model II can be represented as:
α0j =γ00+γ1jState+γ2jP artisanship+γ3jHispanicLegislators+ηj (3)
Finally, Model 3 is a “cross-level interaction model”, with varying slopes (Stegmueller 2013). I interact county-level effects with state level policy drivers to take into account the possibility that state-local political linkages differ across regions.12
8
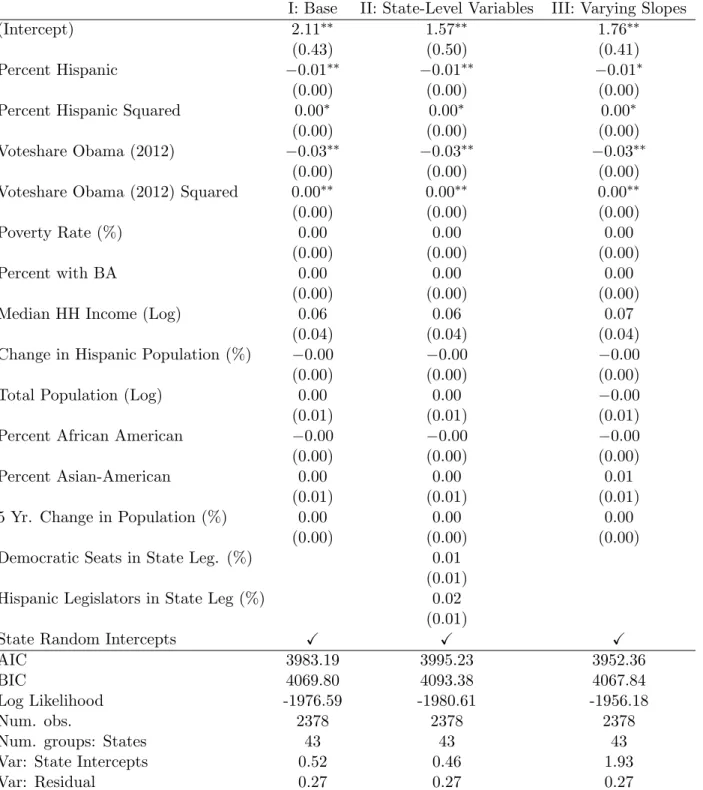
Results
The results of these three models are presented in Table 5. My subsequent analysis will focus on Model I, since higher-level variables – in the form of additional predictors for state-level intercepts or state-level varying slopes – do not greatly improve model fit. A brief look at fit statistics reveals that Model II has a higher AIC and BIC than Model I, indicating worse fit. Model III has a
12
lower AIC than Model I, indicating better fit with varying slopes, but this improvement is minimal for the BIC (which punishes model complexity). Model II and III also indicate that state-level variables do not erase or alter the county-level relationships I am interested in exploring. All four of my substantively interesting independent variables retain sign and significance across the three specifications.13
Model 1 lends support to three of my hypotheses (H1a, H2a, and H2b), and generates a some-what counter-intuitive finding pertaining to H1b. As predicted, the square of Obama’s Vote-share is positively and significantly related to policy outcomes, indicating that ideology has an espe-cially expansionary effect at very high values. Restrictive electoral pressures clearly dissipate when electorates are predominantly liberal. Surprisingly, the linear operationalization of Obama’s county-level vote share has a negative and significant relationship with policy outcomes, rather than just a flat or insignificant association, as predicted. This indicates that competitive districts do not only experience restrictive pressures, but that electoral pressures for restriction are actually more intense in competitive regions than in “safely” conservative counties.
Cumulatively these results fit my characterization of curvilinear political effects. If measured as changes in the predicted values, the substantive effects are moderate but robust. The substantive difference in the predictions between a county with a 50% vote share and two standard deviations above the 50% threshold (78.3%) is a 0.71 standard deviation increase in the policy outcome vari-able. For a two standard deviation shift below 50% vote share (to 21.6%), we see only an 0.01 standard deviation increase in the predicted value of the outcome variable – lending support to the hypothesis that ideologically mixed and predominantly conservative districts do not produce radi-cally different immigration enforcement policy outcomes in substantive terms. Figure 2 represents the predicted policy outcome variable across the range of county-level vote share for Obama, with higher values on the y-axis indicating more expansionary policy environments.14
Consistent with H2a, the linear Hispanic population share variable is negatively and significantly
13
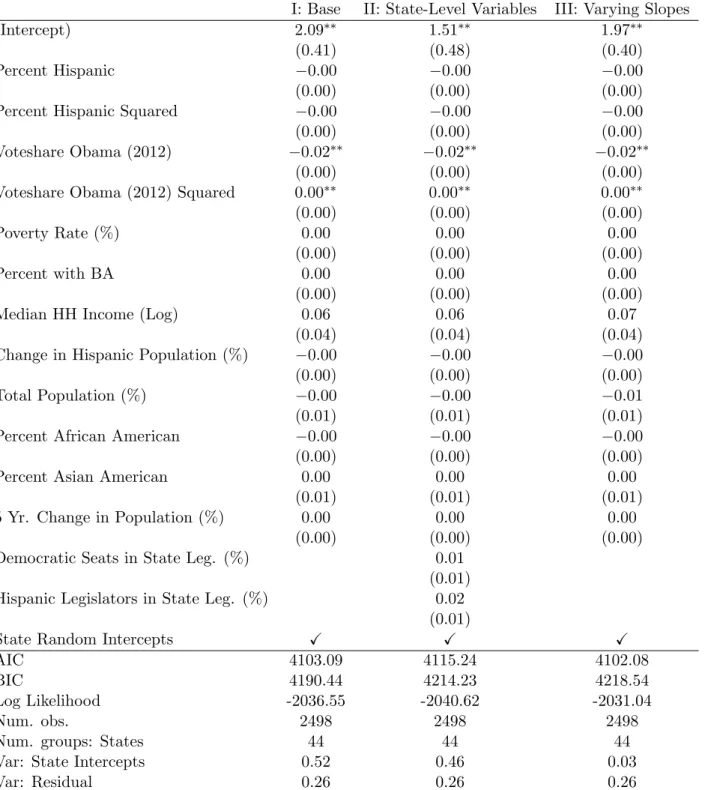
In my appendix I include the same models, but fitted to a sample that includes the Texan counties included in the ILRC data. The findings related to partisanship are robust to the inclusion of Texas, but the demographic findings are not. Specifically, given the large amount of majority-Hispanic counties in Texas, the relationship loses its curvilinear shape (and the demographic variables lose their significance)
14I utilized parametric simulation to estimate uncertainty for these predictions. Specifically, I simulated 1000 models
I: Base II: State-Level Variables III: Varying Slopes (Intercept) 2.11∗∗ 1.57∗∗ 1.76∗∗
(0.43) (0.50) (0.41) Percent Hispanic −0.01∗∗ −0.01∗∗ −0.01∗ (0.00) (0.00) (0.00) Percent Hispanic Squared 0.00∗ 0.00∗ 0.00∗
(0.00) (0.00) (0.00) Voteshare Obama (2012) −0.03∗∗ −0.03∗∗ −0.03∗∗
(0.00) (0.00) (0.00) Voteshare Obama (2012) Squared 0.00∗∗ 0.00∗∗ 0.00∗∗ (0.00) (0.00) (0.00)
Poverty Rate (%) 0.00 0.00 0.00
(0.00) (0.00) (0.00)
Percent with BA 0.00 0.00 0.00
(0.00) (0.00) (0.00) Median HH Income (Log) 0.06 0.06 0.07
(0.04) (0.04) (0.04) Change in Hispanic Population (%) −0.00 −0.00 −0.00 (0.00) (0.00) (0.00) Total Population (Log) 0.00 0.00 −0.00 (0.01) (0.01) (0.01) Percent African American −0.00 −0.00 −0.00 (0.00) (0.00) (0.00) Percent Asian-American 0.00 0.00 0.01
(0.01) (0.01) (0.01) 5 Yr. Change in Population (%) 0.00 0.00 0.00
(0.00) (0.00) (0.00) Democratic Seats in State Leg. (%) 0.01
(0.01) Hispanic Legislators in State Leg (%) 0.02
(0.01)
State Random Intercepts X X X
AIC 3983.19 3995.23 3952.36
BIC 4069.80 4093.38 4067.84
Log Likelihood -1976.59 -1980.61 -1956.18
Num. obs. 2378 2378 2378
Num. groups: States 43 43 43
Var: State Intercepts 0.52 0.46 1.93
Var: Residual 0.27 0.27 0.27
∗∗∗p <0,∗∗p <0.01,∗p <0.05
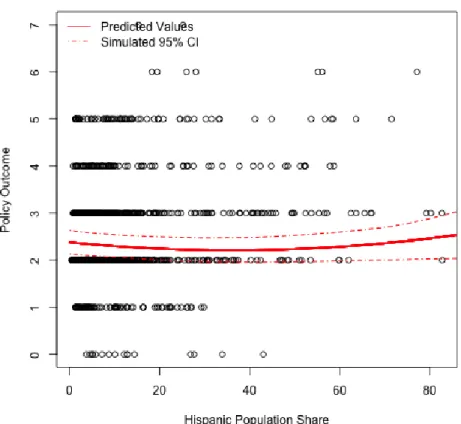
Figure 3: Predicted Values of County-Level Immigration Enforcement Policy Outcomes
associated with immigration enforcement policy. As Hispanic population share grows, counties become more restrictive. Consistent with H2b, the squared term of Hispanic proportion is positively and significantly related to the outcome variable – indicating that, at higher values, Hispanic population share begins to enact an expansionary effect on immigration enforcement policy.
in the predicted values. This relationship between Hispanic population share and predicted values is represented graphically in Figure 3.
9
Policy-by-Policy Analysis
A closer look at the individual policies that constitute the 8-point policy outcome variable in my main analysis provides finer-grained insight into demographic and political effects, largely in support of my hypotheses. Specifically, a policy-by-policy provides leverage on the conditions under which demographics and political factors matter. The results of the subsequent analysis indicate that political factors drive expansionary policymaking, while demographic factors influence restrictive policymaking.
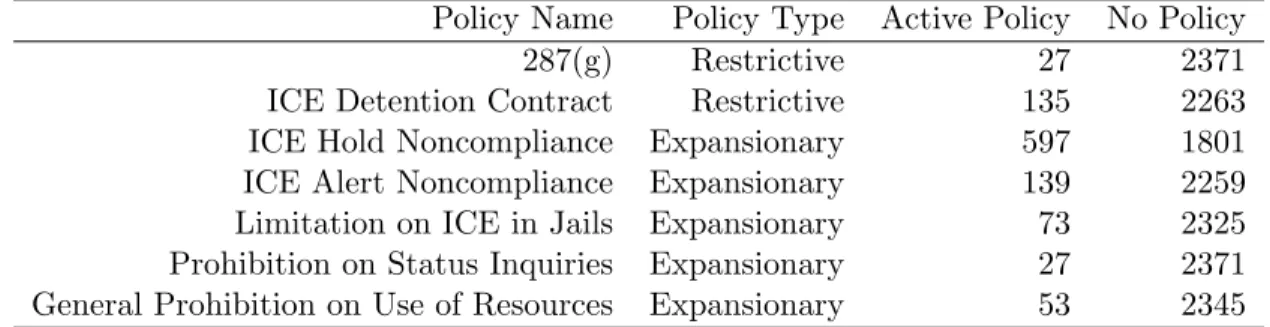
In this section, I disaggregate my eight-point outcome variable into its seven constituent policy components. I code each of these seven policies as dummies – so that a 1 indicates that a policy has been adopted – and classify the policy as either a Restrictive Partnership between ICE and law enforcement or an Expansionary Policy response.15 These policy variables are summarized in Table 6. For the same sample as in my main analysis, I run separate logistic regressions on each of the policy outcomes, and – in separate tables – provide the results for models of expansionary policy outcomes (Table 7) and restrictive policy outcomes (Table 8). In formal terms, the model used for all seven models resembles Model I in the main analysis, in a logistic form given its binary outcomes.
Policy Name Policy Type Active Policy No Policy 287(g) Restrictive 27 2371 ICE Detention Contract Restrictive 135 2263 ICE Hold Noncompliance Expansionary 597 1801 ICE Alert Noncompliance Expansionary 139 2259 Limitation on ICE in Jails Expansionary 73 2325 Prohibition on Status Inquiries Expansionary 27 2371 General Prohibition on Use of Resources Expansionary 53 2345
Table 6: Counts of Active County-Level Policies in 2016
Hypotheses H1a and H1b, about political geography and policy outcomes, predict that pre-dominantly liberal regions should be much more expansionary than prepre-dominantly conservative
15See Table 1 above and the coding scheme in the Appendix for an overview of the policies and how they were
No Holds No Alerts Jail limits Status Prohib Gen Prohib Intercept −7.52∗∗ −7.50∗ −36.84∗ −26.23 −15.79
(2.88) (3.64) (18.08) (18.87) (14.97) Percent Hispanic (%) −0.03 0.04 −0.00 0.05 0.02
(0.03) (0.03) (0.10) (0.11) (0.10) Percent Hispanic Squared 0.00 −0.00 0.00 0.00 0.00
(0.00) (0.00) (0.00) (0.00) (0.00) Obama Voteshare (%) −0.12∗∗∗ −0.12∗∗ −0.14 −0.27 −0.29 (0.03) (0.04) (0.15) (0.20) (0.25) Obama Votshare Squared 0.00∗∗∗ 0.00∗∗∗ 0.00 0.00∗ 0.00
(0.00) (0.00) (0.00) (0.00) (0.00) Poverty Rate (%) 0.01 −0.00 0.03 0.07 0.04
(0.02) (0.02) (0.08) (0.09) (0.10) Percent with BA (%) 0.02 0.02 0.09 0.09 0.08
(0.01) (0.02) (0.05) (0.06) (0.06) Median HH Income (Log) 0.25 0.37 2.19 0.92 0.41
(0.24) (0.32) (1.61) (1.64) (1.30) 5 Yr. Hispanic Pop Change (%) −0.00 −0.00 −0.11 −0.03 −0.00 (0.00) (0.01) (0.07) (0.06) (0.01) Total Population (Log) 0.39∗∗∗ 0.01 0.31 0.50 0.26
(0.10) (0.12) (0.38) (0.49) (0.47) Percent African American (%) 0.57 −0.00 4.25 −0.93 −3.33 (1.45) (1.82) (4.64) (5.30) (6.76) Percent Asian (%) −1.34 −8.65∗ 4.04 6.81 8.78
(5.22) (4.14) (10.13) (10.65) (10.04) 5 Yr. Total Population Change (%) −0.01 0.04 0.09 −0.04 −0.25
(0.02) (0.04) (0.15) (0.17) (0.19)
AIC 1119.55 691.71 121.58 97.07 88.60
BIC 1200.50 772.67 202.53 178.03 169.55
Log Likelihood -545.77 -331.86 -46.79 -34.54 -30.30
Num. obs. 2398 2398 2398 2398 2398
Num. groups: States 44 44 44 44 44
Var: States(Intercept) 16.61 6.63 21.49 29.28 51.69
∗∗∗p <0.001,∗∗p <0.01,∗p <0.05
287g ICE Detention Contracts Intercept −20.06∗∗ −8.35∗∗
(6.13) (3.13) Percent Hispanic (%) 0.20∗ 0.10∗∗∗
(0.08) (0.03) Percent Hispanic Squared −0.00∗ −0.00∗∗
(0.00) (0.00) Obama Voteshare (%) 0.06 0.01
(0.13) (0.10) Obama Votshare Squared −0.00 −0.00 (0.00) (0.00) Poverty Rate (%) −0.02 −0.01 (0.06) (0.02) Percent with BA (%) 0.01 0.02
(0.04) (0.01) Median HH Income (Log) 0.05 −0.00 (0.44) (0.21) 5 Yr. Hispanic Pop Change (%) −0.03 −0.01 (0.04) (0.01) Total Population (Log) 1.17∗∗∗ 0.45∗∗∗
(0.31) (0.11) Percent African American (%) 5.42 −0.80 (3.04) (1.06) Percent Asian (%) 0.55 −3.83 (7.74) (4.16) 5 Yr. Total Population Change (%) 0.12∗ −0.00 (0.06) (0.03)
AIC 212.89 948.69
BIC 293.84 1029.64
Log Likelihood -92.44 -460.34
Num. obs. 2398 2398
Num. groups: States 44 44
Var: States (Intercept) 0.63 0.00
∗∗∗p <0.001,∗∗p <0.01,∗p <0.05
and mixed regions – but that mixed and predominantly conservative regions should not greatly differ from one another in terms of policy outcomes. Elites in competitive districts mobilize their electorate (who are predominantly illiberal on immigration) by taking on restrictive policy positions similar to ones we might see in starkly conservative areas; this restrictive positioning to capture the median voter absent in liberal regions. In practical terms, we should see a strong association between the square of Obama’s vote share and expansionary policymaking. Since pressures for restriction should not vary across ideological profile, we should see no political effects for the re-strictive policies. Table 7, which models expansionary policy outcomes, provides some evidence for this: three of the five expansionary policies are positively and significantly associated with the squared vote share term. As in the main analysis, the linear term is negatively associated with expansion, but only significant for two of the outcomes. For restrictive policy outcomes, in Table 8, we see little evidence that local ideology makes a difference – neither operationalization of the Obama vote share variable seems to drive outcomes. This lends further support to H1a and H2a: electoral pressures for restriction are largely comparable in all but the most liberal regions, where leaders actively pursue expansionary policies.
This policy-by-policy analysis provides greater insight into the conditions under which political and demographic factors affect immigration enforcement policymaking. Specifically, the analysis highlights what types of policies the two forces act upon. Political factors are best at explain-ing expansionary policies. As predicted, expansionary policies emerge in predominantly liberal districts. Meanwhile, the politics of immigration restriction are greatly effected by demography. Restrictive policies occur where Hispanic populations are large enough for ethnic threat to emerge – but these restrictive pressures are counteracted when Hispanic populations are large enough to mobilize against them. In summary, Hispanic community mobilization can oppose restriction where populations are sufficiently large, but only the absence of electoral pressures for restriction can lead
to truly expansionary policies.
10
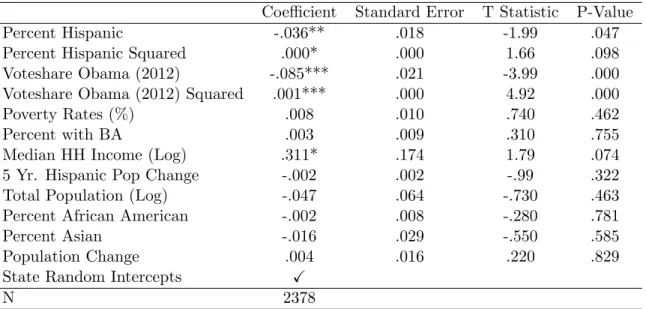
Robustness Check
In my main analysis I treat the outcome as linear and continuous given the number of levels and the peaked distribution of the data; however, an ordinal logistic regression is likely also appropri-ate, given the discrete nature of the data. To test whether the assumption of continuity is driving findings, I run a multilevel ordered logistic regression on the same data as in the analysis, again with random intercepts at the state level. The results of the model are displayed in Table 10 in the Appendix, and largely corroborate my findings in the main analysis. For the four indepen-dent variables of interest, the only noteworthy difference is that Hispanic Proportion Squared is positively associated with the outcome variable only at the 0.1 level of significance, rather than at the 0.05 level, as in the main analysis. Though this raises some doubts about the robustness of the “representation effect,” the relationships between immigration enforcement policy and local political and demographic contexts largely remain the same in an ordered logistic model.
(Shah et al. 2014). For the dependent variable I utilize a polytomous logistic regression method, which is more suitable for imputation of ordered categorical variables.
I fit a multilevel model (the same specification as Model I in the main analysis) to each of these five imputed datasets, then pool the results from these models to capture the average relationships across these models. The results, presented in Table 11, lend further support to H1a and H1b, but cast doubt on the findings about demographic electoral pressures. Whereas vote share and vote share squared do not change sign or significance in the robustness check, the Hispanic population share variables lose significance in the imputed data (though they retain the same direction of association).16
11
Conclusion
Existing work suggests that, in the United States, elected leaders face pressures to restrict immi-gration when Hispanic populations are large enough to be visible, and when they fear competition from parties or leaders that could position themselves as “tougher on immigration.” Conversely, these pressures should abate when Hispanic populations become large enough to win elected offices, effectively mobilize through interest group activity, and effect electoral outcomes more generally. Additionally, leaders should face less pressures for restriction in predominantly liberal districts, where tougher on stances on immigration are unlikely to greatly increase the odds of electoral success.
My analysis finds evidence of these patterns in county-level immigration enforcement policymak-ing. My policy-by-policy analysis adds some nuance, demonstrating that demographic pressures act on restrictive policies and political factors explain expansion. Ethnic threat leads to restric-tion, but large-enough Hispanic populations can cancel out these pressures; true expansion can only occur when the underlying electorate predominantly liberal. Given the low rates of voter turnout in local elections, especially for positions such as county sheriffs, the results that I find are surprisingly strong. In line with the literature on immigration enforcement in the United States, I find evidence of electoral pressures surrounding immigration policymaking even in low-salience local politics. Though interest-group accounts of immigration policymaking should have the most
16
bite where politicization of immigration is low, one must wonder where immigration is not salient enough for such interest group mechanisms to kick in if electoral pressures help explain outcomes even at the county-level.
12
Appendix
12.1
Coding the Dependent Variable
See the list below for a description of the 7 policies17:
1. ICE Hold Noncompliance: An ICE Hold is a request from ICE to a local jail or law enforcement agency to hold a person, after they should be released, for additional time to allow ICE to come take custody. Some departments have a policy of not complying with these Holds (at least under specific conditions, usually non-felony offenses)
Coding if Policy is adopted: 1 Coding if Policy is not adopted: 0
2. 287(g): The 287(g) program specifically deputizes certain law enforcement agents to enforce immigration laws. All costs of this work fall on the city or county.
Coding if Policy is adopted: 0 Coding if Policy is not adopted: 1
3. ICE Detention Contract: An ICE Detention Contract is a contract between ICE and a local jail where ICE pays jails to hold immigrants in detention during deportation proceedings.
Coding if Policy is adopted: 0 Coding if Policy is not adopted: 1
4. ICE Alert Noncompliance: An ICE Alert, a type of ICE detainer sometimes called an ICE notification request, is a request from ICE to be alerted when a person is scheduled to be released from custody, so that ICE knows by when they need to be taken into custody.Some departments have a policy of not complying with these Alerts (at least under specific condi-tions, usually non-felony offenses).
Coding if Policy is adopted: 1 Coding if Policy is not adopted: 0
17
5. Limits on ICE in Local Jails: Some communities do not allow ICE into the secured area of local jails without a warrant, or enact procedural protections for immigrants in the jail so that they can refuse to be interrogated by ICE agents
Coding if Policy is adopted: 1 Coding if Policy is not adopted: 0
6. Prohibitions on Inquiries into Immigration Status and Place of Birth: Some jails and law enforcement agencies prohibit their officers and employees from inquiring into immi-gration status or place of birth.
Coding if Policy is adopted: 1 Coding if Policy is not adopted: 0
7. General Prohibition on Use of Resources to Assist Immigration Enforcement:
Some jurisdictions enact general policies to prohibit the use of local resources in assisting with immigration enforcement. Often they also specifically prohibit local officers from participating in joint patrols with ICE.
Coding if Policy is adopted: 1 Coding if Policy is not adopted: 0
The final dependent variable is an additive index, in which the outcomes of the seven binary coding decisions are added together as follows.
12.2
Analysis: Including Texas
I: Base II: State-Level Variables III: Varying Slopes (Intercept) 2.09∗∗ 1.51∗∗ 1.97∗∗
(0.41) (0.48) (0.40) Percent Hispanic −0.00 −0.00 −0.00 (0.00) (0.00) (0.00) Percent Hispanic Squared −0.00 −0.00 −0.00 (0.00) (0.00) (0.00) Voteshare Obama (2012) −0.02∗∗ −0.02∗∗ −0.02∗∗
(0.00) (0.00) (0.00) Voteshare Obama (2012) Squared 0.00∗∗ 0.00∗∗ 0.00∗∗ (0.00) (0.00) (0.00)
Poverty Rate (%) 0.00 0.00 0.00
(0.00) (0.00) (0.00)
Percent with BA 0.00 0.00 0.00
(0.00) (0.00) (0.00) Median HH Income (Log) 0.06 0.06 0.07
(0.04) (0.04) (0.04) Change in Hispanic Population (%) −0.00 −0.00 −0.00 (0.00) (0.00) (0.00) Total Population (%) −0.00 −0.00 −0.01 (0.01) (0.01) (0.01) Percent African American −0.00 −0.00 −0.00 (0.00) (0.00) (0.00) Percent Asian American 0.00 0.00 0.00
(0.01) (0.01) (0.01) 5 Yr. Change in Population (%) 0.00 0.00 0.00
(0.00) (0.00) (0.00) Democratic Seats in State Leg. (%) 0.01
(0.01) Hispanic Legislators in State Leg. (%) 0.02
(0.01)
State Random Intercepts X X X
AIC 4103.09 4115.24 4102.08
BIC 4190.44 4214.23 4218.54
Log Likelihood -2036.55 -2040.62 -2031.04
Num. obs. 2498 2498 2498
Num. groups: States 44 44 44
Var: State Intercepts 0.52 0.46 0.03
Var: Residual 0.26 0.26 0.26
∗∗∗p <0,∗∗p <0.01,∗p <0.05
12.3
Ordered Logistic Model
Coefficient Standard Error T Statistic P-Value Percent Hispanic -.036** .018 -1.99 .047 Percent Hispanic Squared .000* .000 1.66 .098 Voteshare Obama (2012) -.085*** .021 -3.99 .000 Voteshare Obama (2012) Squared .001*** .000 4.92 .000
Poverty Rates (%) .008 .010 .740 .462
Percent with BA .003 .009 .310 .755
Median HH Income (Log) .311* .174 1.79 .074 5 Yr. Hispanic Pop Change -.002 .002 -.99 .322 Total Population (Log) -.047 .064 -.730 .463 Percent African American -.002 .008 -.280 .781
Percent Asian -.016 .029 -.550 .585
Population Change .004 .016 .220 .829
State Random Intercepts X
N 2378
12.4
Imputed Data
Coefficient Standard Error T Statistic P-Value Intercept 2.988*** 0.433 6.894 0.000 Percent Hispanic -0.002 0.006 -0.343 0.366 Percent Hispanic Squared 0.000 0.000 0.420 0.337 Voteshare Obama 2012 -0.019*** 0.006 -3.156 0.001 Voteshare Obama (2012) Squared 0.000*** 0.000 4.271 0.000 Poverty Rates 0.003* 0.002 1.398 0.081 Percent with BA 0.002 0.002 0.884 0.188 Median HH Income (log) 0.068** 0.039 1.765 0.039 5 Yr. Hispanic Pop Growth -0.000 0.000 -0.104 0.459 Total Population (Log) -0.012 0.016 0.759 0.224 Percent African American -0.292** 0.153 -1.900 0.029 Percent Asian American 0.107 0.704 0.152 0.439 Total Population Change 0.000 0.003 0.105 0.458 State Random Intercepts X
N 2848
13
REFERENCES
1. Barreto, Matt A. “ ˆA Si, Se Puede! Latino Candidates and the Mobilization of Latino Voters.” The American Political Science Review 101.3 (2007): 425 – 441. Print.
2. Boushey, Graeme, and Adam Luedtke. “Immigrants across the U.S. Federal Laboratory: Explaining State-Level Innovation in Immigration Policy.” State Politics & Policy Quarterly 11.4 (2011): 390 – 414. SAGE Journals. Web.
3. Bowler, Shaun, Stephen P. Nicholson, and Gary M. Sequra. “Earthquakes and Aftershocks: Race, Direct Democracy, and Partisan Change.” American Journal of Political Science, vol. 50, no. 1, 2006
4. Chavez, Jorge M., and Doris Marie Provine. “Race and the Response of State Legislatures to Unauthorized Immigrants.” Annals of the American Academy of Political and Social Science 623 (2009): 78 – 92. Print.
5. Citrin, Jack et al. “Public Opinion Toward Immigration Reform: The Role of Economic Motivations.” The Journal of Politics 59.3 (1997): 858 – 881. JSTOR. Web.
6. Cornelius, Wayne A. and Marc R. Rosenblum. ”Immigration and Politics.” Annual Review of Political Science (2005). 99-119.
7. Enos, Ryan D. “Causal Effect of Intergroup Contact on Exclusionary Attitudes.” Proceedings of the National Academy of Sciences of the United States of America 111.10 (2014): 3699 – 3704. PubMed Central. Web.
8. Facchini, Giovanni, and Anna Maria Mayda. “Individual Attitudes Towards Skilled Migra-tion: An Empirical Analysis Across Countries.” The World Economy 35.2 (2012): 183 – 196. Wiley Online Library. Web.
9. Gay, Claudine. “Seeing Difference: The Effect of Economic Disparity on Black Attitudes toward Latinos.” American Journal of Political Science 50.4 (2006): 982 – 997. Wiley Online Library. Web.
10. Goldin, Claudia. “The Political Economy of Immigration Restriction in the United States, 1890-1921: Working Paper No. 4345.” National Bureau of Economc Research (1994). 11. Guirandon, Virginie. “Including Foreigners in National Welfare States: Institutional Venues
and Rules of the Game.” Restructuring the Welfare State?: Political Institutions and Policy Change. Ed. Bo Rothstein and Sven Steinmo. New York: Palgrave Macmillan, 2002. Print. 12. Hainmueller, Jens, and Dominik Hangartner. “Who Gets a Swiss Passport? A Natural Experiment in Immigrant Discrimination.” The American Political Science Review 107.1 (2013): 159 – 187. ProQuest. Web.
14. Hainmueller, Jens, and Michael J. Hiscox. “Attitudes toward Highly Skilled and Low-Skilled Immigration: Evidence from a Survey Experiment.” The American Political Science Review 104.1 (2010): 61 – 84. Print.
15. Hainmueller, Jens, and Daniel J. Hopkins.The Hidden American Immigration Consensus: A Conjoint Analysis of Attitudes toward Immigrants.” American Journal of Political Science 59.3 (2015): 529-548
16. Hammar, Tomas. European Immigration Policy: A Comparative Study. Cambridge: Cam-bridge University Press, 1985. Print.
17. Hansen, Randall. Citizenship and Immigration in Post-War Britain?: The Institutional Ori-gins of a Multicultural Nation. Oxford: Oxford University Press, 2000. Print.
18. Hooghe, Liesbet and Gary Marks. “A Postfunctionalist Theory of European Integration: From Permissive Consensus to Constraining Dissensus.” British Journal of Political Science 39, 2009: 1-23.
19. Hopkins, Daniel J. “Politicized Places: Explaining Where and When Immigrants Provoke Local Opposition.” The American Political Science Review 104.1 (2010): 40 – 60. Print. 20. Hussey, Laura S., and Shanna Pearson-Merkowitz. “The Changing Role of Race in Social
Welfare Attitude Formation: Partisan Divides over Undocumented Immigrants and Social Welfare Policy.” Political Research Quarterly 66.3 (2013): 572 – 584. Print.
21. ”National Map of Local Entanglement with ICE.” Immigration Legal Resource Center (ILRC), 19 Dec. 2016. Web. 29 Dec. 2016.
22. Inglehart, Ronald. ?Post-Materialism in an Environment of Insecurity.? The American Po-litical Science Review, vol. 75, no. 4, 1981,
23. Jaeger, Jillian. “Securing Communities or Profits? The Effect of Federal-Local Partnerships on Immigration Enforcement.” State Politics & Policy Quarterly 16.3 (2016): 362 – 386. spa.sagepub.com. Web.
24. Joppke, Christian. “The Legal-Domestic Sources of Immigrant Rights The United States, Germany, and the European Union.” Comparative Political Studies 34.4 (2001): 339 – 366. cps.sagepub.com.libproxy.lib.unc.edu. Web.
25. Just, Aida, and Christopher J Anderson. “Immigrants, Citizenship and Political Action in Europe.” British Journal of Political Science 42.3 (2012): 481 – 509. ProQuest. Web. 26. Key, V, and Alexander Heard. Southern Politics in State and Nation. New ed. Knoxville:
University of Tennessee Press, 1984. Print.
27. Lahav, Gallya. “Threat and Immigration Attitudes in Liberal Democracies: The Role of Framing in Structuring Public Opinion.” Immigration and Public Opinion in Liberal Democ-racies. Ed. Gary P. Freeman, Randall Hansen, and David L. Leal. New York & London: Routledge, 2013. Print.
28. Lewis, Paul G. et al. “Why Do (Some) City Police Departments Enforce Federal Immigration Law? Political, Demographic, and Organizational Influences on Local Choices.” Journal of
29. Mansbridge, Jane. ?Should Blacks Represent Blacks and Women Represent Women? A Contingent ?Yes.?? The Journal of Politics, vol. 61, no. 3, 1999: 628?657.,
30. Martinez, Deirdre. Who Speaks for Hispanics?: Hispanic Interest Groups in Washington. SUNY Press, 2008. Print.
31. Mayda, Anna Maria. “Who Is Against Immigration? A Cross-Country Investigation of Individual Attitudes toward Immigrants.” Review of Economics and Statistics 88.3 (2006): 510 – 530. MIT Press Journals. Web.
32. Money, Jeanette. Fences and Neighbors: The Political Geography of Immigration Control. Cornell University Press, 1999. Print.
33. Monogan, James E., and Austin C. Doctor. “Immigration Politics and Partisan Realignment: California, Texas, and the 1994 Election.” State Politics & Policy Quarterly 17.1 (2017): 3 ?- 23. SAGE Journals. Web.
34. Nicholson-Crotty, Jill, and Sean Nicholson-Crotty. “Industry Strength and Immigrant Policy in the American States.” Political Research Quarterly 64.3 (2011): 612 -? 624. Print. 35. Olivas, Michael. No Undocumented Child Left behind?: Plyler v. Doe and the Education of
Undocumented Schoolchildren. New York: New York University Press, 2016. Print.
36. Perlmutter, Ted. “Bringing Parties Back In: Comments on ‘Modes of Immigration Politics in Liberal Democratic Societies?.” The International Migration Review 30.1 (1996): 375 – 388. Print.
37. Peters, Margaret E. “Open Trade, Closed Borders Immigration in the Era of Globalization.” World Politics 67.01 (2015): 114 – 154. Cambridge Journals Online. Web.
38. —. “Trade, Foreign Direct Investment, and Immigration Policy Making in the United States.” International Organization 68.4 (2014): 811 – 844. ProQuest. Web.
39. Pierson, Paul. “Increasing Returns, Path Dependence, and the Study of Politics.” The American Political Science Review 94.2 (2000): 251 – 267. JSTOR. Web.
40. Preuhs, Robert R. “Descriptive Representation as a Mechanism to Mitigate Policy Back-lash: Latino Incorporation and Welfare Policy in the American States.” Political Research Quarterly 60.2 (2007): 277 – 292. SAGE Journals. Web.
41. Ramakrishnan, S, Paul George Lewis, and Public Policy Institute of California. Immigrants and Local Governance?: The View from City Hall. San Francisco, Calif.: Public Policy Institute Of California, 2005. Print.
42. Rheault, Ludovic. “Corporate Lobbying and Immigration Policies in Canada.” Canadian Journal of Political Science-Revue Canadienne De Science Politique 46.3 (2013): 691 -? 722. Web of Science. Web.
44. Rocha, Rene R., Benjamin R. Knoll, and Robert D. Wrinkle. “Immigration Enforcement and the Redistribution of Political Trust.” The Journal of Politics 77.4 (2015): 901 – 913. journals.uchicago.edu (Atypon). Web.
45. Rocha, Rene R., and Tetsuya Matsubayashi. “Latino Immigration and Representation in Local Politics.” Urban Affairs Review 49.3 (2013): 353 – 380. uar.sagepub.com. Web. ?Rrmord.pdf.? Web. 21 Feb. 2017.
46. Rovny Jan. 2013. “Where do Radical Right Parties Stand? Position Blurring in Multidi-mensional Competition” European Political Science Review, 5:1?26.
47. Putnam, Robert. “E Pluribus Unum: Diversity and Community in the Twenty-first Century: The 2006 Johan Skytte Prize Lecture.” Scandinavian Political Studies 30 (2007): 137?174. 48. Sainsbury, Diane. “Immigrants? Social Rights in Comparative Perspective: Welfare Regimes,
Forms in Immigration and Immigration Policy Regimes.” Journal of European Social Policy 16.3 (2006): 229 – 244. esp.sagepub.com. Web.
49. —. Welfare States and Immigrant Rights?: The Politics of Inclusion and Exclusion. Great Britain: Oxford University Press, 2012. Print.
50. Scheve, Kenneth F., and Matthew J. Slaughter. “Labor Market Competition and Individual Preferences over Immigration Policy.” The Review of Economics and Statistics 83.1 (2001): 133 – 145. Print.
51. Stegmueller, Daniel. “How Many Countries for Multilevel Modeling? A Comparison of Fre-quentist and Bayesian Approaches.” American Journal of Political Science 57.3 (2013): 748-761.
52. Stein, Robert M., Stephanie Shirley Post, and Allison L. Rinden. “Reconciling Context and Contact Effects on Racial Attitudes.” Political Research Quarterly 53.2 (2000): 285 – 303. JSTOR. Web.
53. Tichenor, Daniel. Dividing Lines?: The Politics of Immigration Control in America. Prince-ton, N.J.: Princeton University Press, 2002. Print.
54. Tolbert, Caroline J., and John A. Grummel. “Revisiting the Racial Threat Hypothesis: White Voter Support for California?s Proposition 209.” State Politics & Policy Quarterly 3.2 (2003): 183 – 202. Print.
55. Tolbert, Caroline J., and Rodney E. Hero. “Race/Ethnicity and Direct Democracy: An Analysis of California?s Illegal Immigration Initiative.” The Journal of Politics 58.3 (1996): 806 -? 818. JSTOR. Web.
56. van Tubergen, Frank, Ineke Maas, and Henk Flap. “The Economic Incorporation of Im-migrants in 18 Western Societies: Origin, Destination, and Community Effects.” American Sociological Review 69.5 (2004): 704 – 727. Print.
57. White, Ariel. “When Threat Mobilizes: Immigration Enforcement and Latino Voter Turnout.” Political Behavior 38.2 (2016): 355 – 382. CrossRef. Web.