MULTISPECIES EVALUATION OF ANTIRETROVIRAL DISPOSITION IN A PUTATIVE TISSUE RESERVOIR OF HIV: IMPLICATIONS FOR ERADICATION
Corbin G. Thompson
A dissertation submitted to the faculty of the University of North Carolina at Chapel Hill in partial fulfillment of the requirements for the degree of Doctor of Philosophy in Pharmaceutical
Sciences in the Eshelman School of Pharmacy (Pharmacotherapy and Experimental Therapeutics).
Chapel Hill 2017
Approved by:
Angela D.M. Kashuba Philip C. Smith
David C. Muddiman Amanda H. Corbett
ii ©2017
iii ABSTRACT
Corbin G. Thompson: Multispecies Evaluation of Antiretroviral Disposition in a Putative Tissue Reservoir Of HIV: Implications For Eradication
(
Under the direction of Angela D.M. Kashuba)Ongoing HIV replication within gut lymphoid tissues may contribute to the persistence of HIV despite treatment with antiretrovirals (ARVs). ARVs may have reduced exposure in certain tissue areas, but current methods for assessing ARV tissue concentrations cannot test this
hypothesis.The goal of this project was to characterize how ARVs distribute within gut tissue, and determine whether or not they concentrate in areas of local HIV gene expression. Drug transporter expression and localization were also evaluated in these tissues to determine what factors influence ARV distribution.
Using mass spectrometry imaging (MSI), the ileum and rectum of humanized mice (n=49), non-human primates (NHP, n=12) and humans (n=5) were evaluated for ARV distribution. The co-localization of ARV distribution with CD3+ T cells, drug efflux
iv
Drug transporters affect ARV tissue disposition and can be exploited to maximize ARV exposure, but quantitative measures of drug transporter protein expression across preclinical species are not available. Gene and protein expression of ARV efflux and uptake transporters were evaluated using qPCR, Western blot, and LC-MS proteomics. Gene and protein expression were generally consistent between infected and uninfected animals and between ileum and rectum. There was poor correlation between methods, and no single method significantly predicted tissue ARV concentrations in a stepwise regression model. We also show that the contribution of human transporter isoforms in humanized mice can significantly affect
v
vi
ACKNOWLEDGEMENTS
I have to recognize the support of many individuals who contributed both professionally and personally to completion of this dissertation. First and foremost, I would like to acknowledge and thank my advisor Dr. Angela Kashuba for her mentorship over the past five years. The scientific and professional guidance she has provided has been invaluable, and I would not have been able to accomplish this goal without her continued push for excellence. I appreciated her willingness to let me work through problems independently while providing appropriate support and oversight. She truly made graduate school an enjoyable experience.
My dissertation committee has been incredibly generous with their time and effort, and I thank them for contributing their expertise and insight. As committee chair, Dr. Smith did a wonderful job of making sure I was comfortable with the state of my project and was always willing to listen to any concerns I had. I admired his approachability and candor during our discussions and thank him for taking on the responsibility of chairing the committee. Dr.
Muddiman’s willingness to share his technology and collaborate with our group made this entire project possible. His passion for science and excitement about pushing this technology forward made him a valuable resource over the past several years. Dr. Corbett was a fantastic clinical advisor, and gave me the opportunity to experience first-hand what clinical practice in an HIV setting is like. Her consistent mindfulness about how the results of this project may be applied in a real-world setting forced me to consider alternative approaches to data analysis and
vii
provided feedback and suggestions at every stage of this dissertation. His depth of knowledge and insight improved the quality and impact of this work.
I have been privileged to be mentored by and work with many exceptional individuals before and during graduate school. Drs. Crossgrove, Rorabaugh, and Black allowed me to explore my initial interests in research and I am very grateful for their patience and encouragement. Dr. Eli Rosen was a terrific resource and his knowledge, creativity, and
resourcefulness came in handy more times than I can count. His willingness to take time to teach trainees and troubleshoot problems was very welcomed. Craig Sykes was critical to moving this project forward and always provided thoughtful perspective on problems that arose during this process. The clinical knowledge I gained from Dr. Marx helpful in framing my project. Heather Prince did a terrific job helping me coordinate the clinical study portion of this project. She sets high standards for herself and others, and the quality of clinical data generated in the lab is a direct reflection of that.
Many collaborators and core facilities have participated in this work. Michelle Mathews at the translational pathology core and Dr. John Fallon were instrumental in method development for numerous aspects of my project, and their tenacity in getting these methods off the ground is appreciated. Our collaborators in Garcia lab here at UNC, the Akkina lab at Colorado State, and the Luciw lab at UC Davis were always willing to share data and samples and this project would not have been possible without their help. I also want to thank the nurses and staff at the CTRC for their hard work, and the women who participated in the clinical study for their altruism and selflessness.
viii
making the lab a great place to work and learn. Melanie Nicol, Cindi Emerson, Mackenzie Cottrell, Nithya Srinivas, Erin Burgunder, Kuo Yang, Katy Garrett, Mike Weber, John Dohnal, Amanda Schauer, Nicole White, and Kimberly Handy have been great friends and colleagues and I am thankful to have gone through this experience with them. Nancy Gillis has been a great friend and was always willing to give me honest feedback and opinion, and there is an element of perfection in all of her work.
ix
TABLE OF CONTENTS
ABSTRACT ... iii
ACKNOWLEDGEMENTS ... vi
TABLE OF CONTENTS ... ix
LIST OF FIGURES ... xiv
LIST OF TABLES ... xvi
LIST OF ABBREVIATIONS ... xvii
CHAPTER I: HIV PERSISTENCE IN GALT: PHARMACOLOGICAL CHALLENGES AND OPPORTUNITIES ... 1
Summary ... 1
Introduction ... 2
HIV Persistence in GALT ... 3
Consequences of HIV GALT Persistence ... 6
Challenges to Eradicating HIV GALT Replication ... 7
Opportunities for Pharmacologic Intervention ... 12
Conclusion ... 20
x
CHAPTER II: MASS SPECTROMETRY IMAGING TO DETERMINE ANTIRETROVIRAL GALT EXPOSURE IN PRECLINICAL MODELS
OF HIV INFECTION ... 24
Summary ... 24
Introduction ... 25
Methods ... 27
Tissue Collection ... 29
Tissue Slicing ... 30
Mass Spectrometry Imaging and Absolute Quantitation ... 30
LC-MS Analysis and Comparison to MSI ... 32
Immunofluorescence (IF)/Immunohistochemistry(IHC) ... 33
In Situ Hybridization (ISH) ... 34
Image Co-localization ... 35
Statistical Analysis ... 36
Results ... 37
Plasma Exposure of Antiretrovirals ... 37
Quantitative Comparison of LC-MS and MSI ... 38
Heterogeneous ARV Distribution in Gastrointestinal Tissues and Co-localization with HIV Target Cells ... 40
Mucosal Accumulation of Antiretrovirals Between Species ... 43
HIV RNA Expression in Areas of Low ARV Signal ... 44
Drug Efflux Transporter Localization and Effect ... 47
xi
CHAPTER III: MULTIMODAL ANALYSIS OF DRUG TRANSPORTER EXPRESSION AND LOCALIZATION IN GASTROINTESTINAL TISSUE AND IMPLICATIONS FOR
ANTIRETROVIRAL DISPOSITION ... 58
Summary ... 58
Introduction ... 60
Methods ... 63
ARV Dosing and Tissue Collection ... 63
Gene Expression ... 63
Protein Extraction and Western Blot ... 65
Quantitative Targeted Absolute Proteomics (QTAP) ... 66
Immunohistochemistry ... 67
Human Transporter Analysis ... 68
Antiretroviral Plasma and Tissue Concentrations ... 69
Statistical Analysis ... 69
Results ... 71
Human Engraftment and Viral Load in Animal Models ... 71
Transporter Gene Expression in Humanized Mouse Intestine ... 72
Interspecies Comparison of Transporter Gene Expression ... 73
Interspecies Comparison of Transporter Protein Expression by Western Blot Analysis ... 75
Interspecies Comparison of Transporter Protein Expression by Targeted ... 76
Quantitative Proteomic Analysis ... 76
Transporter Localization in the Ileum and Rectum... 78
xii
Antiretroviral Tissue Penetration ... 80
Methodology Comparison for Drug Transporter Evaluations ... 82
Discussion ... 84
CHAPTER IV: CLINICAL ASSESSMENT OF ANTIRETROVIRAL GALT DISTRIBUTION AND DRUG TRANSPORTER EXPRESSION WITH INTERSPECIES COMPARISONS TO INFORM DRUG DEVELOPMENT ... 92
Summary ... 92
Introduction ... 94
Methods ... 96
Trial Design ... 96
Sample Collection and Analysis ... 98
Statistical Analysis ... 102
Results ... 102
Subject Demographics and Adverse Events ... 102
ARV Localization in Gastrointestinal Tissues ... 103
HIV RNA Localization and Co-registration with ARVs ... 107
ARV Co-localization with Drug Transporters ... 109
Interspecies Comparison: Transporter Gene Expression ... 110
Interspecies Comparison: Transporter Protein Expression ... 112
Discussion ... 114
CHAPTER V: IMPACT AND FUTURE DIRECTIONS ... 119
xiii
Opportunities for Targeted Therapies ... 123
Implications for Eradication Research ... 128
Conclusion ... 129
APPENDIX 2.1: EFFLUX TRANSPORTER CO-LOCALIZATION VALUES ... 130
APPENDIX 3.1: GENE EXPRESSION ASSAYS USED FOR EACH SPECIES ... 131
APPENDIX 3.2: TRANSPORTER GENE EXPRESSION AMONG MOUSE DOSING COHORTS (ILEUM)... 132
APPENDIX 3.3: TRANSPORTER GENE EXPRESSION AMONG MOUSE DOSING COHORTS (RECTUM)... 133
APPENDIX 3.4: TRANSPORTER PROTEIN EXPRESSION BY WESTERN BLOT AMONG MOUSE DOSING COHORTS ... 134
APPENDIX 3.5: TRANSPORTER PROTEIN EXPRESSION BY PROTEOMICS AMONG MOUSE DOSING COHORTS (ILEUM) ... 135
APPENDIX 3.6: TRANSPORTER PROTEIN EXPRESSION BY PROTEOMICS AMONG MOUSE DOSING COHORTS (RECTUM) ... 136
APPENDIX 3.7: HUMAN CONTRIBUTION TO TOTAL TRANSPORTER POOL ... 137
APPENDIX 3.8: LINEARITY OF PEPTIDE DETECTION IN PROTEOMIC ASSAY ... 138
APPENDIX 4.1: COMPLETE INCLUSION/EXCLUSION CRITERIA ... 139
APPENDIX 4.2: HUMAN EFFFLUX TRANSPORTER CO-LOCALIZATION VALUES.... 143
APPENDIX 5: RELEVANT PREVIOUSLY PUBLISHED WORK AND ABSTRACTS ... 144
xiv
LIST OF FIGURES
Figure 1.1: Factors influencing Antiretroviral Disposition and Efficacy in GALT………...…….18
Figure 2.1: Image Co-localization Workflow……….……..37
Figure 2.2: Plasma ARV Concentrations in Individual Dosing Cohorts………..…….39
Figure 2.3: ARV Plasma Concentrations Across Animal Models………..……..40
Figure 2.4: Comparison of LC-MS and IR-MALDESI Methods………..……41
Figure 2.5: Differential ARV Localization Within a Single NHP Tissue Slice……….…..42
Figure 2.6: ARV Localization in Humanized Mouse Tissues……….…..43
Figure 2.7: HIV RNA Localization in Areas of Low ARV Signal………...47
Figure 2.8: HIV RNA Localization in Areas of Low ARV Signal (Mice)………...48
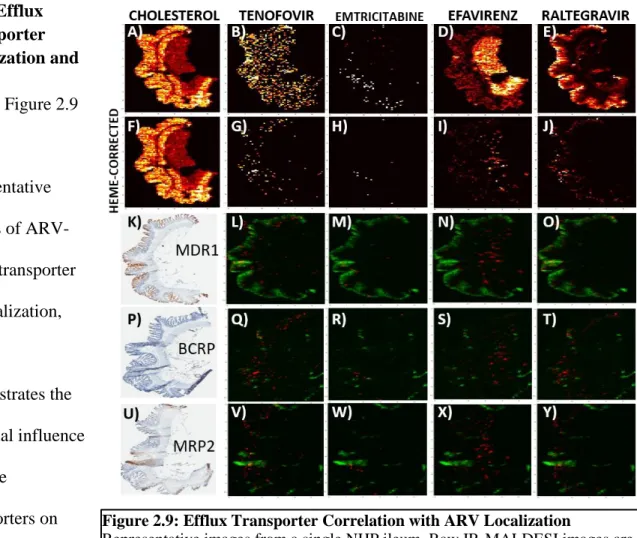
Figure 2.9: Efflux Transporter Correlation with ARV Localization………....…49
Figure 2.10: ARV-Efflux Transporter Co-localization Across Compartments………..…...50
Figure 3.1: Extent of Human Engraftment and Viral Load Among Animal Models………..…..72
Figure 3.2: Mouse Transporter Gene Expression in Humanized Mouse Gut………..….73
Figure 3.3: Multispecies Comparison of Transporter Gene Expression………..….75
Figure 3.4: Transporter Protein Expression Humanized Mice Ileum and Rectum………..….76
Figure 3.5: Multispecies Comparison of Transporter Protein Expression by QTAP………..…..78
Figure 3.6: Efflux Transporter Localization Within the Macaque and Mouse Gut………..….79
Figure 3.7: Human Transporter Gene Expression in Humanized Mouse Gut………..….80
Figure 3.8: Lack of Agreement Between Transporter Evaluation Methods………..…83
Figure 4.1: Treatment Arms Evaluated……….…99
Figure 4.2: Study Design Schematic………...100
Figure 4.3: ARV Penetration into Human Gut Biopsies……….106
Figure 4.4: ARV Localization in Human Gut Biopsies………..107
xv
Figure 4.6: ARV-HIV RNA Co-localization in Human Gut Biopsies………...109
Figure 4.7: Interspecies comparison of ARV-HIV RNA Correlation………....110
Figure 4.8: Efflux Transporter Localization and Effect on ARV Distribution………...111
Figure 4.9: Efflux Transporter Co-localization Across Compartments………..112
Figure 4.10: Interspecies comparison of Transporter Gene Expression……….113
Figure 4.11: Interspecies comparison of Transporter Protein Expression by Western Blot………114
xvi
LIST OF TABLES
Table 1.1: Potential Technologies to Evaluate Small Molecule Tissue Distribution………...……..17
Table 2.1: Sample size and ARV administration schematic………..…....30
Table 2.2: Summary of ARV-CD3+ T Cell Correlation Coefficients Across Species………..……45
Table 2.3: Summary of Mucosal Accumulation Across Species………..…….46
Table 2.4: Summary of ARV-HIV RNA Correlation Coefficients Across Species………..……48
Table 3.1: Drug Transporters Evaluated for Gene and Protein Expression………..…….65
Table 3.2: Tissue:Plasma Ratios for Evaluated Antiretrovirals in Intestinal Tissue………..…...82
Table 3.3: Multivariable Regression Analysis of Drug Transporter Expression Methods on TPR……..…85
Table 4.1: Subject Demographics………...105
xvii
LIST OF ABBREVIATIONS
ABCB1 ATP-binding cassette subfamily B member 1 ABCC1 ATP-binding cassette subfamily C member 1 ABCC2 ATP-binding cassette subfamily C member 2 ABCC4 ATP-binding cassette subfamily C member 4 AIDS Acquired Immunodeficiency Syndrome ARV(s) Antiretroviral(s)
ATZ Atazanavir
BCRP Breast cancer resistance protein
BLT Bone marrow, liver, thymus humanized mouse model cART Combination antiretroviral therapy
CYP450 Cytcochrome P450 DTG Dolutegravir DTT Dithiothreitol EFV Efavirenz
ENT1 Equilibrative nucleoside transporter 1 FGT Female genital tract
FTC Emtricitabine
FTC-tp Emtricitabine triphosphate GALT Gut-associated lymphoid tissue GI Gastrointestinal
HIV Human Immunodeficiency Virus IHC Immunohistochemistry
xviii LC Liquid chromatography
LRA Latency reversing agent MDR1 Multidrug resistant protein 1 MNC Mononuclear cell
MRM Multiple reaction monitoring
MRP1 Multidrug resistance-associated protein 1 MRP2 Multidrug resistance-associated protein 2 MRP4 Multidrug resistance-associated protein 4 MS Mass spectrometry
MSI Mass spectrometry imaging MVC Maraviroc
NBF Neutral buffered formalin NHP Non-human primate
NRTI Nucleotide reverse transcriptase inhibitor NNRTI Non-nucleotide reverse transcriptase inhibitor OAT1 Organic anion transporter 1
OAT3 Organic anion transporter 3
OATP2A1 Organic anion transporting polypeptide 2A1 OCT Optical coherence tomography
OCT2 Organic cation transporter 2 OCT3 Organic cation transporter 3 PBMC Peripheral blood mononuclear cell PD Pharmacodynamics
xix PK Pharmacokinetics
PrEP Pre-exposure prophylaxis PVDF Polyvinylidene difluoride
qPCR Quantitative polymerase chain reaction QTAP Quantitative targeted absolute proteomics RAL Raltegravir
RS Raman spectrometry
SHIV Simian-human (chimeric) immunodeficiency virus SLC22A2 Solute carrier family 22 member A2
SLC22A3 Solute carrier family 22 member A3 SLC29A1 Solute carrier family 29 member 1
SLCO2A1 Solute carrier organic anion transporter protein family member 2A1 SIV Simian immunodeficiency virus
STI Sexually-transmitted infection SubQ Subcutaneously
TBS-T Tris-buffered saline with Tween 20 TDF Tenofovir disoproxil fumarate TFV Tenofovir
TFV-dp Tenofovir diphosphate
TPL Translational Pathology Laboratory WB Western blot
1
Chapter I: HIV Persistence in GALT: Pharmacological Challenges and Opportunities
Summary
An increasing amount of evidence suggests that HIV replication persists in gut-associated lymphoid tissues (GALT) despite treatment with combination antiretroviral therapy (cART). Residual replication in this compartment may propagate infection at other sites in the body and contribute to sustained immune dysregulation and delayed immune recovery. Therefore, it is important to focus efforts on eliminating residual replication at this site. There are several challenges to accomplishing this goal, including low antiretroviral (ARV) exposure at specific tissue locations within GALT, which might be overcome using the tools of clinical
2
Introduction
The ability to suppress HIV replication with combination antiretroviral therapy (cART) permanently changed the landscape of HIV/AIDS. Since the introduction of cART in 1996, the life expectancy of HIV-infected individuals has continued to climb to levels near those of non-HIV infected populations, showcasing the dramatic effect of cART on reducing viral load and preventing or reversing AIDS.1 Despite this, studies evaluating the need for continued cART in the setting of undetectable plasma virus have demonstrated rebound viremia as soon as 2-3 weeks after drug discontinuation.2–4 Using ultra-sensitive assay techniques, HIV DNA is
detectable in resting CD4+ T cells even in patients who have had undetectable plasma viral loads for years.5 Utilizing decay rates of HIV RNA in plasma and DNA in peripheral blood
mononuclear cells (PBMCs), Perelson et al developed a mathematical model which estimated the overall half-life of viral decay to be approximately 44 months.6 Given this extremely long rate of viral decay , it has been estimated that it would take 73 years of cART to fully eradicate HIV from the body.7 Therefore, HIV persistence despite cART is a hallmark of HIV infection and represents a significant barrier to cure.
3
high concentration of HIV target cells and its role as a site of initial HIV exposure and early infection. Given the extensive distribution of GALT and its important role in immune function, ongoing replication in this compartment may have clinical consequences not observed from other tissue reservoirs.
As the evidence for ongoing replication in tissue reservoirs continues to grow, so does the need for interventions aimed at eradicating HIV from these sites. Clinical pharmacology can play a large role in understanding how these reservoirs persist in the face of cART, and in the
development of targeted interventions for HIV eradication. The tools of pharmacology can also help to clarify the mechanisms of persistence in GALT (e.g. active replication, latency, or both). The pharmacologic mechanisms influencing HIV tissue reservoirs have been previously
reviewed14,15, but none have focused on the unique challenges faced in eradicating HIV
replication in GALT. The purpose of this chapter is to summarize the evidence for ongoing HIV replication in GALT, address the challenges associated with current eradication strategies, and propose opportunities for pharmacologic intervention.
HIV Persistence in GALT
4
RNA shedding from the rectum of HIV positive, STI uninfected men, was reduced but not eliminated with cART.20,21 In addition, gut immune activation after initial infection has also been shown to persist despite long-term treatment, suggesting persistent exposure to viral antigens.22 Further, the amount of infectious virus in active CD4+ T cells (many of which are located in the GALT) was found to be 1.6-fold higher than in resting CD4+ T cells, suggesting that latently-infected cells do not account for all of the residual virus.23
5
has shown that viral sequences derived from PBMCs were phylogenetic offspring from
sequences derived from lymph nodes in patients with undetectable plasma viral loads.29 Though this study was not performed in GALT, it demonstrates that focal HIV replication in lymphoid tissue can maintain PBMC infection during suppressive therapy. Together, these data support persistent HIV replication within the GALT, and that this local replication can maintain infection in the plasma through free movement of infected cells or virions between these compartments.
Despite these results, several investigations suggest that GALT is not the sole source of rebound viremia upon treatment cessation. For example, a cross-sectional evaluation of multiple T cell subsets by McBride et al showed that less than 20% of total HIV DNA was found in memory T cells with gut migratory capacity.30 Further, sequence analysis of rebound plasma virus from three HIV-infected patients who experienced treatment interruption demonstrated that the post-interruption viral sequences were not GALT-derived, suggesting an alternative source of rebound viremia.31 This hypothesis is supported by a recent study that sampled GALT and lymph nodes before and after treatment interruption and found that rebounding HIV variants likely arise from many anatomic sites, rather than from a small viral population from a single location (e.g. GALT).32
6
from durably suppressed patients have failed33), these data provide a foundation for exploring the mechanisms of HIV persistence in this tissue compartment.
Consequences of HIV GALT Persistence
Immune Dysregulation in Acute Infection As an early site of HIV exposure and infection, GALT plays an important role in the pathogenesis of HIV infection. The interplay between immune cell depletion and activation, local viral dynamics, and systemic immune dysregulation is complex and is the focus of thorough reviews.34,35 It was observed early in the HIV epidemic that infection resulted in severe GI complications and was associated with increased mortality in AIDS patients.36,37 This was caused by severe depletion of specific T cell populations within GALT that occur rapidly after infection (27% reduction within 4 weeks).19 Specifically, IL-17 expressing T helper cell (Th17) populations were found to be preferentially depleted in SIV infection, which may lead to decreased immune function and disruption of gut epithelial integrity.38 Studies in macaques and humans have shown these T cell decreases to occur within the first week of infection.17–19 The importance of T cell depletion within GALT has been supported by studies showing that elite controllers do not experience specific depletion of Th17 cells, suggesting that this immune dysregulation is a main driver of disease progression.39
7
responsible for this delay have not been fully determined, but several studies have implicated ongoing CD8+ T cell activation, fibrosis, or impaired mucosal homing as contributing
factors.22,42,43 Importantly, ongoing viral replication in GALT could help explain this delay in immune recovery regardless of the specific mechanism(s) involved. Persistent exposure of viral antigen to antigen-presenting cells in the gut can increase inflammatory markers44, decrease epithelial integrity45, and increase microbial translocation46, continuing the cycle of local immune dysregulation and systemic inflammation. Microbial translocation is of particular concern, as this is associated with increased incidence of comorbidities and hastened disease progression.47,48 The profound immune depletion in GALT, with subsequent clinical
complications, underscore the importance of eradicating residual viral replication in this compartment.
Challenges to Eradicating HIV GALT Replication
8
eliminate, the HIV reservoir,49,50 likely due to the very early establishment of the latent reservoir before cART can be initiated. Thus, alternative strategies for HIV elimination are required.
A critical obstacle to achieving HIV eradication in GALT is the potential for inadequate ARV distribution into this compartment. ARV penetration into gut tissues is highly variable, both between and within drug classes51, and is not easily predicted based on chemical structure or standard pharmacokinetic properties.52 The lack of complete immune restoration in GALT following cART administration and the isolation of HIV RNA from tissues in patients with suppressed plasma HIV RNA levels provides indirect evidence that ARVs may not achieve adequate concentrations in certain areas of GALT. This is supported by tissue homogenate data showing that GI exposures of ARVs such as dolutegravir are 83% lower than plasma.53
Additionally, studies evaluating the utility of intensified ARV dosing regimens on the size of the viral reservoir have shown little effect, suggesting that anatomic or pharmacokinetic barriers may exist that prevent ARV penetration into GALT.54,55 A study by Fletcher et al compared ARV concentrations between PBMCs and mononuclear cells (MNCs) isolated from the lymph nodes, ileum, and rectum.56 It was found that ARV concentrations in gut MNCs were up to 100% lower than PBMC concentrations, and that lower concentrations correlated with slower HIV decay rate in these tissues. These data suggest that ARVs retain their efficacy provided they are able to reach an as-yet unidentified threshold concentration in target cells. However, the interplay between active replication secondary to reduced ARV exposure and latent infection remains unknown, as does the relative contribution of each of these processes to HIV persistence.
9
subtherapeutic ARV exposure.57 Given that resistance is known to develop rapidly when ARV concentrations drop below therapeutic concentrations in plasma, it is reasonable to question this pharmacologic assertion. In the absence of widespread resistance developing in patients, some have interpreted the continued detection of HIV gene expression as simply random egress from latency, having little to do with drug penetration.57 However, it has recently been suggested that ARV exposure in tissue reservoirs may be so low that the threshold for resistance development is never met.29 In other words, minimal ARV exposure allows for continued replication of wild-type virus which can outcompete resistance variants that could otherwise emerge. In this way, inadequate ARV penetration into tissues may contribute to ongoing replication congruent with clinical observations of low level viremia in patients receiving cART.
In addition to propagating immune dysfunction and systemic inflammation, inadequate ARV penetration into target cells may also hinder efforts of latency reversal and blunt the corresponding host immune response.22 Reversal of HIV latency in quiescent memory T cells using small molecule drugs represents a promising approach for reduction or eradication of the HIV reservoir, and several drug candidates are currently undergoing clinical evaluation.58,59 A key assumption underlying these efforts is that virions produced from these re-activated T cells will be unable to infect nearby healthy cells and stimulate new rounds of HIV replication.
However, this assumption is valid only if ARVs are present at sufficient concentrations to inhibit viral replication. However, if enough healthy T cells remain unexposed to ARVs56 in the setting of latency reversal, reactivation of quiescent cells could result in no effect, or possibly an
increase in the size of the viral reservoir through new rounds of infection.
10
influence ARV disposition in GALT. ARV penetration into tissues is variable and dependent on several physicochemical and pharmacokinetic characteristics.51 Volume of distribution and plasma protein binding are important variables and vary widely from drug to drug. Drug transporters and metabolizing enzymes are also known to affect the absorption and distribution of ARVs, and there are many examples of clinically significant drug-drug interactions involving these proteins.60 Though the specific transporters or enzymes utilized by ARVs vary between drug classes, the metabolizing enzymes of the CYP450 family, particularly CYP3A4, and the efflux transporters p-glycoprotein (P-gp), breast cancer resistance protein (BCRP), and the multi-drug resistance proteins (MRP) are responsible for a significant portion of ARV transport and metabolism.61 As such, alterations in the expression and/or activity of these proteins can have a dramatic effect on local ARV concentrations. As an example, the penetration of atazanavir (ATZ) into the brain was increased by 5.4-fold in P-gp/BCRP knockout mice compared to wild-type, showing that a lack of functional efflux transporters at the blood brain barrier allows more drug to enter tissue.62 Other groups have shown that the expression of the uptake transporter family OAT1 at this site also modulates TFV brain penetration.63 These findings have been corroborated in other tissues such as the testes, where it was shown that inhibition of P-gp and BCRP in human Sertoli cells increases the testicular uptake of ATZ,64 and in in P-gp/BCRP knockout mice, where ATZ concentrations in testicular tissues were increased by 4.6-fold compared to wild-type mice.62 A recent paper by Bendayan showed that the penetration of protease inhibitors into human testes was variable and may be dependent on drug transporter expression and localization.65
11
colorectum, with the opposite being true for the efflux transporter MRP2 (1.5-fold lower in ileum vs colorectum).67 CYP3A4, an enzyme responsible for the metabolism of protease inhibitors, has been shown to be expressed at varying levels in GI tissue, and is highest in the
duodenum.66,68 In combination, these factors may explain the large differences observed in ARV exposure in tissues, including the GI tract. For example, the exposure of the P-gp substrate RAL in the splenic flexure was shown to be 2.8-fold higher than the terminal ileum or colorectum.69 This is inversely related to the expression patterns of P-gp in the GI tract,67 suggesting that decreased RAL efflux out of enterocytes secondary to focal decreases in efflux transporter
expression can result in compartment-specific increases in RAL exposure along the GI tract. This complicates attempts to achieve maximum drug exposure in tissue, as the local expression of drug transporters and enzymes may be the primary driver of tissue concentration. To date there has been no evaluation of the relationship between these variables and ARV GALT exposure, however given the numerous examples of altered plasma pharmacokinetics secondary to drug transporter or metabolizing enzyme interactions in the gut, it is reasonable to expect that changes in these variables will also have an effect on local ARV exposure in GALT.
12
shows that more sophisticated methods of determining effective concentrations are needed to define pharmacokinetic targets in this compartment, as higher concentrations may be needed for a longer period of time in tissues compared to plasma. In a study of pre- and post-cART reverse transcriptase (RT) sequences in 8 HIV-infected participants, it was found that sequence diversity decreased 1.5-2 fold throughout the gut during treatment, and that zidovudine (ZDV)-resistant variants were concentrated in the gut versus PBMCs, demonstrating that efficacy targets may be different between these compartments.70 The ability to define exposure-response relationships in GALT and other tissue reservoirs, as has been done in the female genital tract for HIV
prevention efforts71, will be critical to overcoming HIV replication in this compartment. Defining these relationships is unlikely to change current dosing strategies (though dose intensification studies suggests this would have little effect), however a well-defined PK target in tissues would inform the development, or selection, of targeted therapies to stop replication.
The challenges described above highlight the difficulty in eliminating HIV persistence in GALT. While some barriers are unavoidable (e.g. high target cell concentration, size and
complexity of GALT, etc.) others, such as inadequate drug penetration or the contribution of drug transporters or metabolizing enzymes, can be acted on in a rational way to improve therapeutic success in this area. The next section focuses on ways that clinical pharmacology approaches can inform the design of targeted therapies for HIV eradication in GALT.
Opportunities for Pharmacologic Intervention
Emerging Technologies to Understand ARV Distribution
13
ARV tissue concentrations have used liquid chromatography-mass spectrometry (LC-MS) analysis of tissue homogenates.51 Though traditional LC-MS methodology can provide clinically useful quantitative data, it does not have the ability to identify distributional patterns within the tissue, as the entire sample is consumed in the homogenization process. This is a critical
limitation of the technology, as it has been shown for other drugs that distribution across tissue is not uniform.72 For example, if the majority of a particular ARV were located in a specific tissue compartment (e.g. epithelial layer) with no distribution into the rest of the tissue, LC-MS may overestimate the penetrative ability of this ARV. This is particularly concerning if HIV
replication is occurring in focal areas within a tissue that cannot be reached by ARVs. Further, because the majority of ARVs have intracellular sites of action, concentrations within cells are the largest determinant of antiviral efficacy. MNC isolation from reservoir tissues overcomes the limitations of LC-MS by reporting ARV concentrations only in the cells of interest.56 However, this method cannot easily or completely account for drug lost during the isolation process which can significantly underestimate true intracellular concentrations,73 nor can it distinguish cell populations derived from different areas within a tissue. Therefore, it is crucial to use alternative technologies to define ARV distribution into tissues and cells.
14
can be particularly powerful when combined with other techniques such as in situ hybridization (ISH) or immunohistochemistry (IHC). Leveraging all of these methods in combination, it is possible to compare ARV distribution to that of HIV target cells (IHC) or to HIV itself (ISH) to determine whether ARV localization corresponds with areas of local HIV replication.76 Because IR-MALDESI is quantitative76–78, it is also possible to determine what local concentrations are needed within a tissue compartment to effectively suppress HIV replication, aiding in the search for target concentrations in tissues.
Raman spectroscopy (RS) is another promising imaging technique that has the potential to provide ARV distributional data within unperturbed tissues like GALT. Utilizing the
15
Droplet microfluidics is a pioneering technology that allows for high-throughput, single cell assays.84 In the case of HIV persistence, where proviral DNA may be found in a relatively small number of cells, understanding how the exposure of a current or novel therapy exerts its PD effect ex vivo would provide a foundation for optimization of therapy. By encapsulating single cells inside small volume (1pL) droplets and performing reactions within each droplet, microfluidics overcomes the disadvantages of current techniques.85 This technology has been used previously to perform cellular screening assays for drug effect and genetic analysis to link genotype to phenotype in a single cell population.86,87 Though this technique has not yet been used to evaluate small molecule concentrations, it shows promise in the area of cellular ARV PK, as differential exposure between and among cell types can be evaluated with high frequency (2000Hz), with simultaneous evaluation of PD effects (protein or gene expression changes).
Evaluation of small molecule tissue and cellular distribution using novel technologies is a burgeoning field. IR-MALDESI and RS have a growing body of evidence demonstrating their utility in this arena. Microfluidics shows additional promise for performing cellular PK/PD evaluations. The advantages and disadvantages of each of these technologies is summarized in Table 1.1. One limitation that is shared by all of these methods is the difficulty in accounting for synergy among ARVs, which may result in adequate control of replication despite suboptimal exposure of the individual drugs. Additionally, though IR-MALDESI has been used to evaluate ARVs from multiple classes88, RS and microfluidics have had limited or no use in ARV
16
Table 1.1: Potential Technologies to Evaluate Small Molecule Tissue Distribution
Method Quantitative
Visual Inspection of Analyte Distribution Changes in Exposure Over Time Resolution Flexible Workflow/Samp le Preparation LC-MS/MS of Tissue Homogenates 56,89 Absolute quantitation possible Not possible Not possible with a single
tissue Averaged concentrations within an isolated cell population Validated methods available for most tissue or fluid matrices Mass Spectrometry Imaging 75-78,86 Absolute quantitation possible
Yes, across a single tissue cross-section
Not possible with a single
tissue
≤ 100 micron spatial resolution Sample preparation and imaging parameters must be optimized for
each tissue Raman Spectroscopy 79–81 Absolute quantitation possible Yes, coupled with optical coherence tomography
Possible in a single transwell experiment
≤ 100 micron spatial resolution
Requires setup of transwell assay system and optimization of analyte detection Droplet Microfluidics 85 Quantitation possible with labelled analytes Not possible in tissue Not possible with cells from a single tissue Single cell resolution Requires specialized cellular isolation and preparation
Defining the Factors Influencing ARV Disposition
17
their half-life in tissues) is also critical, as it has been shown that ARVs like indinavir are rapidly cleared from the lymph compartment despite achieving equilibrium with plasma
concentrations.90 In addition, there may be certain components of the molecular structure of ARVs that favor increased GALT exposure, and these features can potentially be utilized in the development of nanoformulations targeted at tissue reservoirs.91,92 Targeted nanoformulations have shown success in cancer therapeutics, and several nanoformulated drugs are approved for use in breast and pancreatic cancer, achieving increased exposure into tumors and increasing survival rates.93 Among ARVs, a nano-formulated version of indinavir was shown to achieve a 6-fold increase in lymph node concentrations and greater exposure in plasma.94 Additional formulations for drugs such as abacavir, rilpivirine, and efavirenz are already in development,
Figure 1.1: Factors influencing Antiretroviral Disposition and Efficacy in GALT Solubilized drugs (green, red, and blue circles) can penetrate into intestinal tissue from peripheral blood supply or directly from the intestinal lumen. Penetration arising from blood is dependent on the amount of local perfusion as well as pharmacokinetic properties of the drug, i.e. drug bound to plasma protein (shown in yellow) cannot enter tissue. Penetration from the gut lumen is dependent on
18
masking unfavorable PK characteristics to maximize ARV tissue exposure.95–97 For example, a dimeric prodrug formulation of abacavir, which functions as a P-gp inhibitor when dimerized but that can still exert anti-HIV activity when cleaved to its monomer form, has been developed to increase abacavir penetration into the CNS.95 Similar approaches for other ARVs to increase GALT exposure should be considered.
Another important step toward eradication is to identify which drug transporters or metabolic enzymes either adversely or favorably affect ARV exposure in the GALT. Exploiting these factors to increase ARV GALT penetration from the lumen (e.g. P-gp inhibition on enterocytes to decrease efflux) or systemic circulation (e.g. CYP3A4 inhibition in the liver to increase half-life) may overcome the inherent challenges in treating GALT persistence. Several studies have shown drug transporter expression to be inconsistent along the GI tract67, but transporter localization in relation to GALT has not been evaluated in this context. A potential explanation for this gap in knowledge is the lack of consistency with which transporter
expression is evaluated and reported, as the methodology used in these studies is highly variable, with groups using qPCR, immunoblot, LC-MS proteomics, IHC, or some combination of these methods.98–101 Further, there has been no formal analysis of the agreement of these techniques with one another. Gene expression has been shown to vary drastically from end protein
expression, and even measures of transporter proteins may give very different results.101 In order to fully characterize which drug transporters or metabolic enzymes affect local ARV
19
Leveraging ARV distribution data against the biologic factors that influence these distribution patterns will provide the most informative data for the design of novel therapies targeted at tissue reservoirs, including GALT. In addition to identifying which ARVs achieve the highest exposure in GALT and if the exposure occurs where latent and/or reactivated HIV virus is located is critical. Further, defining which drug characteristics, transporters, or enzymes should be targeted or avoided when developing new therapies or optimizing existing ones would refine novel strategies to pursue. Importantly, defining the characteristics that affect ARV exposure in GALT is likely to also inform the exposure of LRAs and other small molecules compounds in GALT. While specific factors may differ between drug classes, the lessons learned from
evaluation of ARVs in this tissue can be easily translated to LRAs, for which GALT exposure is equally important.
Utilizing Pre-Clinical Models to Streamline Drug Development
The location and nature of many active HIV reservoirs make them difficult to sample in human participants. Limited repeat sampling can be accomplished in some sites including GALT, but extensive evaluation of human GALT tissue remains a challenge, particularly for the ability to recover virus from tissue biopsies. These limitations necessitate the use of pre-clinical animal models to study HIV persistence. Unfortunately, it has been shown that ARV distribution can be variable between species, with tissue ARV penetration varying greatly between
20
Lin summarizes some of these differences, including that the concentrations of CYP3A and CYP2C are increased by 1.8 and 12-fold in rats compared to humans,102 which can lead to increased metabolism of substrates (e.g. protease inhibitors, NNRTIs) and decreased plasma or tissue exposure over time. Further, our group has shown substantial differences in gene and/or protein expression of several drug transporters between humanized mice and non-human primate models, which may affect local concentrations of ARVs transported be these proteins,
particularly those affected by P-gp (e.g. abacavir) and BCRP (e.g. dolutegravir) 101,103 The challenges in reconciling data from pre-clinical species as it relates to HIV persistence have been recognized by the field.104 However, it is obvious that an animal model that accurately reflects ARV tissue distribution in humans or that can be accurately scaled to predict human distribution would be helpful in the evaluation of candidate ARVs for targeting GALT. The generation of reliable interspecies scaling factors for ARV distribution and
metabolism would streamline ARV development when tissue targeting is required. To
accomplish this, studies evaluating ARV distribution and metabolism across multiple species including humans, and particularly focusing on GALT, should be conducted. These data can form the foundation for quantifying the variability of ARV distribution across models and developing models to accurately predict these endpoints in humans, and greatly inform eradication strategies, including anticipated combination strategies in which drug-drug interactions are possible.
Conclusion
21
pharmacologic tools described here offer promising solutions. Tissue imaging provides distributional data that has been previously unattainable, and will allow the field to assess whether or not ARVs have a significant presence in reservoirs by identifying and quantifying within-tissue localization. This has enormous implications for HIV persistence; heterogeneous ARV distribution in the GALT would provide convincing evidence that current therapies are simply not present where they are needed, while reproducibly broad distributional patterns would suggest alternative reasons for persistent infection. Demonstrating that HIV replication is
occurring in areas or cells with low ARV exposure would provide further evidence that inadequate ARV tissue exposure contributes to HIV persistence.
In addition to clarifying the mechanisms driving HIV persistence in GALT, the tools of pharmacology can be used to inform the development of targeted therapies for HIV eradication. Defining the factors governing ARV exposure in GALT will help to identify which variables to target or avoid during the development of novel small molecules, particularly once preferred methodologies for measuring these factors are identified. Additionally, performing these
22 Specific Aims
AIM 1: Define ARV distribution within a putative viral reservoir from 2 animal species using IR-MALDESI imaging and LC-MS/MS methods
1a: Using IR-MALDESI imaging, characterize and quantify the spatial distribution of ARVs from 5 therapeutic classes within the gastrointestinal-associated lymphoid tissue (GALT) of non-human primates (NHP), and 2 non-humanized mouse models. This will allow for determination of whether ARVs concentrate in certain tissue sub-compartments, and whether this differs across pre-clinical species. Discussed in Chapter II
1b: Utilizing tissues collected in Aim 1a, identify the distribution of HIV target cells and HIV RNA, and quantify their co-localization with ARV distribution. By co-localizing ARV
distribution with these variables, deficiencies in exposure at the site of action can be identified. This will provide critical data to clarify the mechanisms of HIV persistence. Discussed in Chapter II
AIM 2: Identify the physiologic factors that influence ARV distribution and activity in tissues suspected of being active viral reservoirs.
2a: Quantify the gene and protein expression of relevant drug transporters in the GALT of humanized mice and NHPs using qPCR, Western blotting, and LC-MS proteomics. Quantify cross-species variability and identify any species-specific features which may influence drug transporter activity. This will be the first comprehensive comparison of commonly-used methodologies for drug transporter expression across species. Discussed in Chapter III
23
tract. Determine whether or not these effects are differential between transporters, between species, or between anatomic sites. Discussed in Chapter III
AIM 3: Identify ARV regimens that concentrate within active viral reservoirs and assess their impact on HIV persistence in humans.
3a: Characterize and quantify the distribution of four commonly used ARV regimens within the GALT of virologically suppressed HIV positive patients using IR-MALDESI quantify co-localization with target cells and HIV RNA. Define the relationship between data from humans and animal models. These interspecies comparisons will inform the development of novel targeted therapies. Discussed in Chapter IV
24
Chapter II: Mass Spectrometry Imaging to Determine Antiretroviral GALT Exposure in Preclinical Models of HIV Infection
Summary
HIV replication within the gut may be propagated by reduced antiretroviral (ARV) exposure. Mass spectrometry imaging (MSI) provides biodistribution data that LC-MS cannot. Here, we use MSI to visualize ARV distribution within gut tissues from two species, and assess co-localization with HIV target cells, HIV RNA, and drug efflux transporters. Two humanized mouse (n=49) and one primate (NHP, n=12) models were given combination ARVs. One 10µm slice from frozen ileum and rectum was analyzed by MSI. Serial slices were analyzed for CD3+ T cell and efflux transporter localization by IF/IHC, and HIV RNA by ISH. Co-localization of ARV and IF/IHC/ISH imaging was performed in Matlab using Pearson correlation (r). ARV distribution was heterogeneous in NHP tissues with 2-fold greater mucosal accumulation in NHP vs mice, where the majority of ARV detection was secondary to heme. ARV-T cell correlation ranged from -0.09 to 0.32, was consistent between species and up to 4-fold higher in the NHP ileum versus the rectum. HIV RNA was preferentially detected in areas of low TFV and MVC exposure in both species (overall range -0.09-0.2). ARV-transporter co-localization was variable between ARVs and highest for MDR1 (range -0.09-0.54) in both species. Co-localization
suggests efflux transporter expression results in lower ARV exposure in HIV target cells in the ileum, which may contribute to low level HIV replication. This is supported by HIV RNA
25 Introduction
The persistence of HIV despite treatment with combination antiretroviral therapy (cART) is the major obstacle to eradication of this disease, necessitating lifelong therapy in infected individuals. Rebound plasma viremia after treatment cessation is thought to be secondary to reactivation of multiple latently-infected memory T cell populations.4,5,8,9 The elimination of this latent cellular reservoir has received most of the focus of HIV eradication research to date, however it has been hypothesized that residual HIV replication from active T cells within tissue reservoirs may also contribute to viral rebound upon treatment interruption.
The evidence for continued production of replication-competent virions within certain anatomic sites continues to grow and has been extensively reviewed.14,15 Several tissue compartments, such as the central nervous system10, male and female genital tracts11,12, gut-associated lymphoid tissue, and peripheral lymph nodes13 have been implicated as potential tissue reservoirs. The contribution of these tissue reservoirs to persistent replication was recently investigated by Lorenzo-Redondo et al, who showed that viral sequences isolated from the lymph nodes of suppressed patients were genetic descendants of peripheral blood mononuclear cell (PBMC)-derived variants and vice versa, demonstrating viral evolution during cART and supporting the active reservoir hypothesis.29 Additionally, several groups have used in situ
hybridization to show localized HIV RNA expression in tissues from cART-treated individuals.32,56 While it is unlikely that all of this RNA represents replication-competent
26
cART, are unique from other anatomic compartments and have been previously reviewed in Chapter I.106 The mechanism(s) underlying propagation of tissue reservoirs like GALT is unclear, but suboptimal antiretroviral (ARV) penetration into tissues has been suggested as a potential cause.56 Inadequate ARV exposure at the site of action would help explain the persistence of HIV replication and provide an avenue to develop targeted therapies.
Unfortunately, traditional methods of analyzing small molecule penetration into tissues are limited in their capacity to measure within-tissue distribution. Liquid chromatography-mass spectrometry (LC-MS) of tissue homogenates has been the gold standard for ARV tissue
analysis, but provides only an averaged concentration over the entire tissue. If HIV replication is occurring focally (e.g. in a single lymphoid follicle), this method may misrepresent ARV
exposure at the site of action. Some groups have isolated the mononuclear cell (MNC)
population from tissues before performing LC-MS.56 While this method is an improvement over homogenate analysis, it does not account for drug lost during MNC isolation73 and cannot distinguish between MNCs from different sites within the tissue.
27
addition to the lack of within-tissue distributional data, there is a paucity of data on how ARV distribution differs among pre-clinical species and between animals and humans. The
development of any new therapeutic agent requires testing in animal models, but efficacy measures for these studies can be greatly skewed if within-tissue distribution is different from humans. Defining the differences in ARV distribution, if any exist, between animal models will inform the development of novel therapies for use in humans.
In this study, we use MSI to visualize the distribution of ARVs from multiple therapeutic classes in two GI tissues from three animal models. We quantify concentration in the mucosal compartment, and assess the co-localization of ARVs with HIV target cells and with viral RNA expression. Additionally, we assess whether ARV localization is correlated with HIV RNA expression, or whether focal RNA expression occurs in the absence of ARV exposure. Finally, we evaluate the effect of drug transporters on observed distribution patterns, and quantify the differences between species. The data generated here provide insight into the mechanisms of HIV persistence in GALT, and will form the basis of studies aimed at optimizing cART to eradicate HIV.
Methods
Animal Models
Uninfected Animals
Three commonly used animal models from two species were employed in this study: the hu-HSC-Rag (n=20) and bone marrow-liver-thymus (BLT; n=6) humanized mouse models and a rhesus macaque non-human primate model (NHP; n=6). Humanization protocols used to
28
aged 3-6 months underwent humanization as previously described, and were then dosed with one of several ARV regimens for 10 days: EFV 10mg/kg (n=6) alone; atazanavir (ATZ) 140mg/kg (n=6) alone; or tenofovir (TFV) 208mg/kg, emtricitabine (FTC) 240mg/kg, raltegravir (RAL) 56mg/kg, maraviroc (MVC) 62mg/kg (n=6) in combination. Each drug was given once per day (QD). A single cohort of female BLT mice also underwent humanization and received a
combination of TFV, FTC, RAL, ATZ, and MVC at equivalent doses for 6 days (toxicity has been observed with longer dosing periods). All drugs were administered by oral gavage, and dosing solutions were prepared by solubilizing formulated drug. Dosing regimens for each animal model are summarized in Table 2.1.
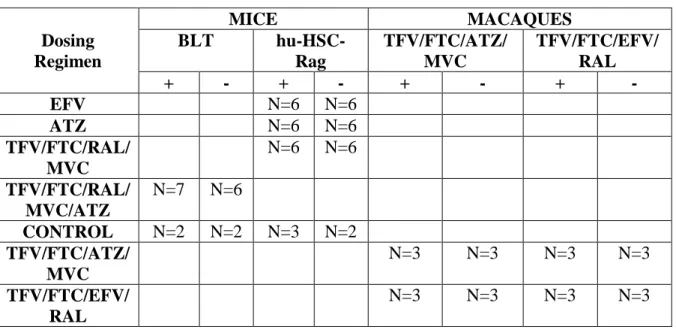
Table 2.1: Sample size and ARV administration schematic
Dosing Regimen
MICE MACAQUES
BLT
hu-HSC-Rag TFV/FTC/ATZ/ MVC TFV/FTC/EFV/ RAL + - + - + - + -
EFV N=6 N=6
ATZ N=6 N=6
TFV/FTC/RAL/ MVC
N=6 N=6 TFV/FTC/RAL/
MVC/ATZ
N=7 N=6
CONTROL N=2 N=2 N=3 N=2
TFV/FTC/ATZ/ MVC
N=3 N=3 N=3 N=3
TFV/FTC/EFV/ RAL
N=3 N=3 N=3 N=3
The extent of humanization for both mouse models was assessed by quantifying human T cell populations using flow cytometry as previously described.109 Male rhesus macaques
(Macaca mulatta) between 3 and 7 years of age were dosed for 10 days with TFV 30mg/kg subcutaneously (SubQ), FTC 16mg/kg (SubQ) and one of the following regimens: MVC
29
BID. Doses for all drugs in all animal models were chosen based on commonly used treatment doses for HIV infection in these models.110–114 Two animals from each mouse model were not dosed with ARVs and used as controls. Dosing periods for all animals were chosen to achieve pharmacokinetic steady-state in tissues based on known half-lives of the drugs used and previous studies with these models.
Infected Animals
To assess the effect of infection on drug distribution and transporter expression, three additional cohorts of animals (n=21 hu-HSC-Rag, n=18 BLT, n=6 macaques) were infected and dosed with identical ARV regimens. Flow cytometry was used to quantify the extent of
humanization at baseline and at 4 weeks post-infection. The hu-HSC-Rag animals were infected intraperitoneally with 200µL 2.1 x 10⁶ IU/mL of HIVBal D7. Plasma HIV RNA was measured weekly beginning two weeks after inoculation and continuing for 4 weeks. ARV dosing commenced once 4 weeks of durable HIV infection was established, and a final viral load was measured during therapy. BLT mice were infected intravenously with 200µL 90,000 TCIU of HIVJRcsf, with plasma HIV RNA being measured 1, 2 and 4 weeks after inoculation to confirm durable infection, and once after starting therapy. Macaques were infected intravenously with 104.5 TCID
50 of RT-SHIVmac239, with viral loads measured weekly after inoculation.
Tissue Collection
One day after the final ARV dose was administered, animals were euthanized and
30
into two approximately equal sized pieces (~100mg for the mice ileum, ~10mg for the mice rectum, and ~2g for non-human primate (NHP) ileum and rectum), placed into separate aluminum foil pouches and snap frozen on dry ice. Total time from euthanization to tissue freezing was less than 60 minutes for all tissues. After freezing, tissues were stored at -80˚C for further analysis. All animal experiments were performed in accordance with locally-approved IACUC protocols.
Tissue Slicing
To generate serial sections for multi-modal analysis, tissues were sliced frozen at 10µm thickness using a cryostat (Leica Biosystems, Wetzlar, Germany) and thaw mounted onto glass microscope slides in the following order: 8 slices for immunohistochemistry (IHC), 2 slices for MSI (one for analysis and one backup), 2 slices for LC-MS, 15-20 slices for ISH. NHP tissues were mounted on optimal cutting temperature (OCT) compound and sliced individually, however the small size of the mouse tissues (3-5mm cross sections) precluded this method. Instead, mouse tissues were grouped by dosing cohort and mounted within a 50:50 gelatin
carboxymethylcellulose gel block, which was snap frozen and stored at -80°C. Each frozen gel block was mounted on OCT, sliced and thaw mounted, allowing for mounting and analysis of up to 6 mouse tissues simultaneously.
Mass Spectrometry Imaging and Absolute Quantitation
31
maintained at -10˚C. Relative humidity inside the chamber was reduced to <6% to allow for sample cooling without condensation of water vapor, then humidity was increased to deposit a layer of ice across the entire stage. Tissues were ablated with two pulses of a mid-IR laser (IR-Opolette 2371, Opotek, Carlsbad, CA) with a 100um spot-to-spot distance. Ablated molecules were ionized by orthogonal electrospray using 0.2% formic acid in 50:50 methanol water as an electrospray solvent and sampled into a Thermo Fisher Scientific Q Exactive mass spectrometer (Bremen, Germany) for analysis in positive ion mode. Raw data from each voxel were converted to the mzXML format with MSConvert (ProteoWizard), then to the imzML format for
interrogation using MSiReader, which allows for generation of images of ARV distribution across the tissue slice.115
Absolute quantitation of ARV concentration was achieved by spotting a series of
calibration standards (of known ARV concentration) onto a non-dosed “blank” NHP tissue slice from identical tissue matrices (ileum or rectum; Bioreclamation IVT, Baltimore, MD). 100nL of each calibration standard was spotted onto the tissue, allowed to air dry, then placed inside the source chamber and analyzed in an identical manner to the samples. A new calibration tissue was analyzed every day that sample analysis occurred to account for inter-day variability run
32
mouse calibration spot was used to adjust the slope and intercept of the NHP calibration curve (to account for response differences between tissues from different species), and the adjusted calibration curve was applied to mouse samples. Resulting ng/slice concentrations were
converted to µg/g using the known area of each tissue slice, depth of each tissue (10um), and an assumed tissue density of 1.06g/mL.
LC-MS Analysis and Comparison to MSI
Plasma and tissue ARV quantitation of each sample was performed using LC-MS methods as described previously.75 Plasma samples, calibration standards, and quality control samples underwent protein precipitation followed by LC-MS/MS. Internal standard was added to plasma and mixed with 600μL of acetonitrile. Samples were vortexed and centrifuged, then the supernatant was diluted with 50:50 methanol:water. For tissues, 1 mL of ice cold 70:30
acetonitrile-water was added to sample tubes containing a serial 10µm section from each sample. Samples were sonicated for 10 minutes with calibration standards and quality control samples. Separation for both matrices occurred on a Shimadzu high-performance liquid chromatography system, and an AB SCIEX API 5000 mass spectrometer (AB SCIEX, Foster City, CA, USA) equipped with a turbo spray interface was used as the detector. The dynamic range of the plasma assay ranged from 1-20,000ng/mL for TFV, ATZ and EFV, 1-8,000ng/mL for MVC,
33
In order to assess the agreement of the experimental MSI and reference LC-MS methods, tissue ARV concentrations from both methods were normalized for the corresponding plasma concentrations to generate tissue penetration ratios (TPRs; duplicate LC-MS samples were averaged before normalization). Bland-Altman plots were used to evaluated the agreement between methods for each ARV evaluated.
Immunofluorescence (IF)/Immunohistochemistry(IHC)
Dual IF on frozen humanized mouse and NHP sections were performed in the Bond fully-automated slide staining system (Leica Microsystems) using Bond Polymer Refine Detection kit (DS9800). Slides were allowed to sit at room temperature for 15 minutes, then fixed in 10% NBF for 15 minutes. They were then placed in Bond wash solution (AR9590). Antigen retrieval was done at 100°C in Bond-epitope retrieval solution 2 pH9.0 (AR9640) for 10 minutes. Staining was performed first using CD4 1F6 antibody (Abcam clone BC/ 1F6) at 1:50 dilution for 1h with Bond Polymer and Post-Primary reagents and Cy5 fluorochrome (Perkin Elmer) for 15 minutes. Antigen retrieval was done at again 100°C in Bond-epitope retrieval solution 2 pH9.0 (AR9640) between protocols. Slides were then stained with CD3 (Leica clone LN10) Ready-to-Use antibody for 15 minutes and Dako Envision mouse secondary for 30 minutes. Cy3 fluorochrome (Perkin Elmer) was applied for 15 minutes. IF slides were
counterstained with Hoechst 33258 (Invitrogen, Carlsbad, CA) and mounted with ProLong Gold antifade reagent (P36934, Life Technologies).
34
(1:50; Santa Cruz) for 15-60 minutes followed by pH antigen retrieval (Leica). DAB (3,3’-diaminobenzidine) was used as a substrate-chromagen for detection. All staining was performed on a Leica Bond automated tissue stainer (Leica). Mouse and NHP liver tissues were used as a positive control for all antibodies, and negative staining was performed using secondary antibody only. Samples were visually evaluated for transporter localization.
In Situ Hybridization (ISH)
35 Image Co-localization
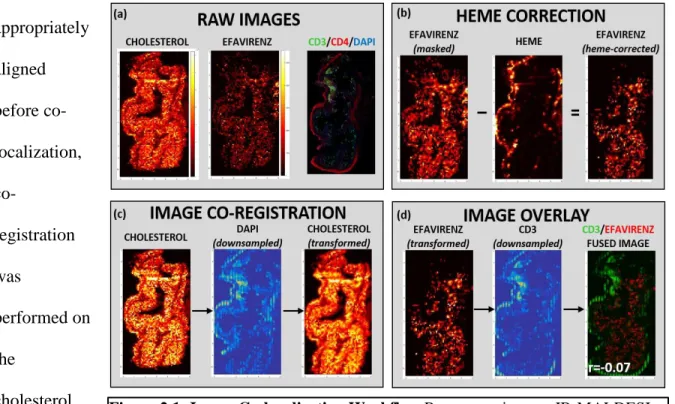
Image manipulation and co-registration was performed using the Matlab v. R2015a Image Processing Toolbox (Mathworks, Natick, MA). A schematic of the co-localization workflow is shown in Figure 2.1. For a given sample (Figure 2.1a), MSiReader was used to export pixel intensity matrices for cholesterol, heme, and each ARV of interest across the entire tissue slice into Matlab; IF and IHC samples were scanned as described above and downsampled to match the resolution of the MSI data. Off-tissue response was eliminated by using cholesterol signal to mask ARV response, such that only on-tissue signal was shown. To eliminate the confounding effect of ARVs contained within the vasculature, ARV responses were again masked based on heme distribution (Figure 2.1b) to show only the ARV signal that localized outside the microvasculature. To ensure that MSI-derived images and IF/IHC/ISH images were appropriately
aligned before co-localization,
co-registration was
performed on the
cholesterol image using the
36
background DAPI stain as a reference (Figure 2.1c). The resulting transform variable was applied to all ARV images so that every ARV image was identically-oriented. Finally, the heme-corrected transformed ARV images were overlayed with the variable of interest (CD3, MDR1, etc.) to generate a fused image (Figure 2.1d) containing both the ARV (in red) and the variable of interest (in green). After image overlay was performed, Pearson’s correlation was performed to assess the co-localization of both variables.
Statistical Analysis
37 Results
Plasma Exposure of Antiretrovirals
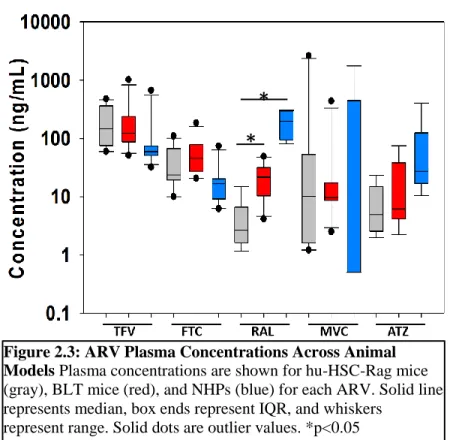
ARV concentrations in plasma collected at necropsy were measured to verify absorption of oral doses and to ensure consistency across animal models. ARV plasma concentrations were detectable in >90% of samples. Figure 2.2 compares plasma exposure between infected and uninfected animals from each model. No significant differences were observed between these groups. Given the overall lack of differences in plasma exposure, data were combined in Figure 2.3, which
shows plasma data across all animal models. There were no statistically significant differences between the two humanized
38 Quantitative Comparison
of LC-MS and MSI
We have published LC-MS tissue concentrations from these animals using larger tissue samples (three 50 micron slices)118,
however here we utilize concentrations obtained from a single 10 micron serial slice to make a more
direct comparison. In mice, tissue concentrations from serial slices were detected with far less frequency than larger samples, ranging from 8% detection for EFV to 77% detection for TFV. MVC was not detected in any hu-HSC-Rag tissue sample despite detection in plasma, but did achieve measurable concentrations in BLT ileum and rectum. Detection of ARVs in tissue slices by MSI was also sporadic in mice, with detection largely mimicking LC-MS results (ranging from 4% detection for EFV samples to 55% detection for TFV). Unlike LC-MS, MVC was detected in 50% of samples using MSI in both hu-HSC-Rag and BLT mice. Conversely, the NHP samples had detectable ARV concentrations in >85% of samples for every ARV evaluated by LC-MS, and 100% of samples by MSI.
Figure 2.3: ARV Plasma Concentrations Across Animal Models Plasma concentrations are shown for hu-HSC-Rag mice (gray), BLT mice (red), and NHPs (blue) for each ARV. Solid line represents median, box ends represent IQR, and whiskers
represent range. Solid dots are outlier values. *p<0.05
*
39
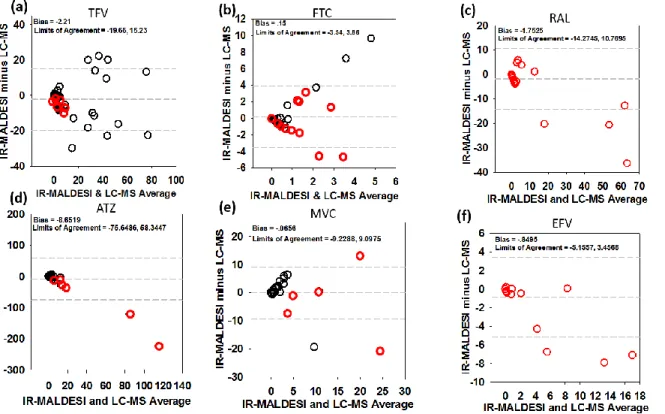
We have previously demonstrated our ability to obtain absolute quantitation of ARVs in tissue slices using IR-MALDESI and showed good agreement (with 15%) with LC-MS75, however this was performed on tissues from a single animal. Here, we performed a more comprehensive comparison between these methods using Bland-Altman plots, which are shown in Figure 2.4. Mean bias between methods ranged from -0.06 for MVC to -8.65 for ATZ. TFV (Figure 2.4a), FTC (Figure 2.4b), and MVC (Figure 2.4e) did not demonstrate bias toward one method over
another, with concentrations spread evenly above and below zero. For RAL (Figure 2.4c), ATZ (Figure 2.4d), and EFV (Figure 2.4f), the bias favored higher LC-MS concentrations over MSI as the average concentration increased, potentially indicating saturation of MSI detection at higher concentrations.
40
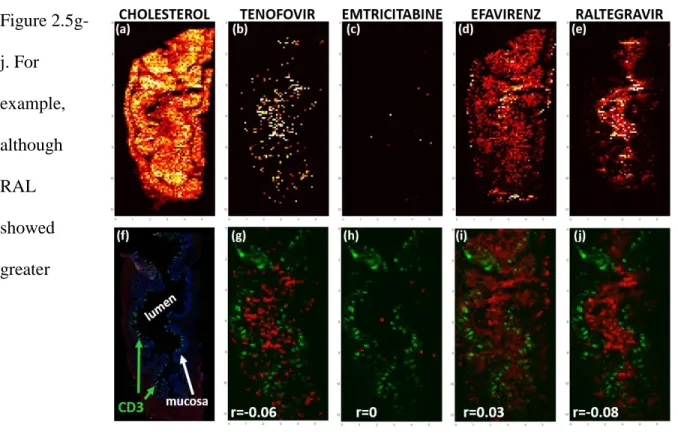
Heterogeneous ARV Distribution in Gastrointestinal Tissues and Co-localization with HIV Target Cells
Figure 2.5 showcases representative images of differential ARV distribution from a single NHP tissue slice. TFV (Figure 2.5b) and FTC (Figure 2.5c) showed disparate distribution patterns, with TFV giving the highest signal in the lumen, with low but consistent penetration into the mucosa and muscularis, while FTC was minimally detected in the mucosa. Consistent with previously published data75, EFV distribution was not homogenous throughout the NHP ileum or rectum, instead localizing in the mucosal layer with little penetration into the muscularis (Figure 2.5d). RAL, on the other hand was localized to the lumen and showed less penetration into the mucosa (Figure 2.5e). The potential effect of these differences in ARV distribution on exposure in HIV target cells is reflected by the ARV-CD3+ T cell correlation coefficients in Figure
2.5g-j. For example, although RAL showed greater