1
Layer by (3D) Layer
3D GIS Stratigraphic Analysis of
Chlorakas-Palloures, Cyprus
Marina Gavryushkina – s2050498 MSc Thesis – 4ARX-091ARCH Dr. Lambers & Dr. Klinkenberg
Digital Archaeology MSc
3
Table of Contents
Acknowledgements ... 5
Chapter 1: Introduction... 7
1.1 Advances in Excavation Documentation ... 7
1.2 3D GIS ... 8
1.3 Previous Research and Theoretical Implications ... 9
1.4 Stratigraphic Studies of Chalcolithic Cyprus ... 12
1.5 The Case Study: Chlorakas-Palloures ... 13
1.6 Research Goals and Questions ... 14
1.7 Methodology and Thesis Structure ... 15
Chapter 2: 3D GIS ... 17
2.1 Defining 3D GIS ... 17
2.2 The History of GIS in Archaeological Research ... 18
2.3 2.5D v. 3D ... 20
2.4 3D GIS Software Development:... 21
2.5 3D GIS v. CAD ... 22
2.6 Uses of 3D GIS in Archaeology ... 23
2.7 Comparative Studies for Developing Effective 3D GIS Workflows ... 25
2.8 Voxel-Based 3D GIS Model Building ... 28
2.9 Critiques and Theoretical Considerations ... 31
2.10 Data Accessibility and Sustainability ... 33
Chapter 3: Stratigraphic Studies in West Cyprus (Chalcolithic Period: c. 3800-2500 BC) . 35 3.1 The Lemba Archaeological Project ... 35
3.2 Studies of Stratigraphy at Chalcolithic Cypriot Sites ... 35
3.2.1 Kissonerga-Mosphilia ... 37
3.2.2 Kissonerga-Mylouthkia ... 40
3.2.3 Lemba-Lakkous ... 41
3.3 Chlorakas-Palloures ... 42
3.4 2D Stratigraphic Documentation ... 43
Chapter 4: Methods ... 47
4.1 Palloures Documentation Methods ... 47
4.2 Palloures Dataset ... 50
4.3 Software ... 51
4.4: 3D GIS Workflow ... 52
4.4.1 Importing 3D Models into ArcScene ... 52
4
4.4.3 Digitizing Missing Unit Data ... 55
4.4.4 3D Conversion ... 57
4.5 Modeling Unit Volumes ... 59
4.5.1 Method 1: Extrude Between TINs ... 60
4.5.2 Method 2: Minimum Bounding Volume ... 63
4.5.3 Method 3: Digitizing Section Stratigraphy ... 65
4.6 Calculating Volumes of Units ... 67
4.7 Joining 3D GIS Models with the Excavation Database ... 67
Chapter 5: Results and Analysis ... 69
5.1 A True 3D GIS Workflow... 69
5.2 Modeling Unit Volumes Methods: Results ... 71
5.2.1 Method 1: Extrude Between TINs ... 73
5.2.2 Method 2: Minimum Bounding Volume ... 75
5.2.3 Method 3: Digitizing Section Stratigraphy ... 76
5.3 Differences in Unit Volumes ... 76
5.4 Stratigraphic Analysis ... 80
5.4.1 Visualizing Bedrock ... 80
5.4.2 Identifying Relationships Between Trenches ... 81
5.4.3 Clarifying Settlement Patterns ... 82
5.4.4 Identifying Post-Deposition Disturbances ... 83
5.4.5 Solving Stratigraphic Problems ... 85
5.5 Settlement Patterns at Chlorakas-Palloures ... 87
Chapter 6: Discussion ... 88
6.1 Workflow Overview ... 88
6.2 Comparison with Other 3D GIS Workflows ... 92
6.3 Suggested Excavation Documentation Methods ... 97
6.4 3D GIS v. Traditional Plan and Section Drawings ... 98
6.5 3D GIS Modeling for Interpretation of Spatial Data ... 100
6.6 4D GIS ... 101
6.7 3D GIS Data Sustainability and Accessibility ... 102
Chapter 7: Conclusion ... 104
Abstract ... 107
Internet Sources ... 108
Bibliography ... 109
Figures ... 116
5
Acknowledgements
It takes a village, and here I would like to take a quick moment to give credit where credit is due. First, thank you to my supervisor, Victor Klinkenberg, for indulging my interest in 3D GIS and giving me access to the Palloures dataset. My appreciation for your technical assistance and patience with my countless WhatsApps messages cannot be overstated. This project would also not have been possible without Karsten Lambers, whose invaluable feedback and guidance helped me to be a better scholar.
Thank you to Nicolo Dell’Unto and everyone at the Digital Archaeology Laboratory at Lund University for taking me under your wing during the cold Swedish winter to pass on your expertise in 3D GIS. Your solid advice and technical know-how was incredibly helpful and opened my eyes to new possibilities in Digital Archaeology. On that note, I am very grateful to Chiara Piccoli for connecting me with Nicolo and his team, and for encouraging my interest in 3D modeling.
Moreover, I extend my utmost gratitude to the Leiden University Excellence Scholarship (LExS) committee for granting me the means to pursue my academic ambitions at Leiden University. My experience at Leiden has opened up a world of opportunity and I could not have gotten here without your backing. The LUF International Study Fund (LISF) has also been incredibly instrumental to my research and I want to thank them for awarding me the grant which allowed me to complete my internship in Sweden.
Of course, a special shout-out to Emily Vella and Shannon Mascarenhas with whom I shared an office. Your good humor, memes, and shared love of Pokemon Go kept me sane and motivated through the most stressful of times. Thank you to all of my friends from my OWL group for sharing the Leiden experience with me and a very sincere thank you to my wonderful partner Jerome who put up with me and my deadlines during the past few months.
7
Chapter 1: Introduction
Developments in three-dimensional (3D) data acquisition technology and geographic information system (GIS) software capabilities in the past decade have opened up immense potential for improving archaeological documentation practices. As archaeologists are increasingly relying on digital technology to record spatial data during excavation, more research must be done in order to better understand the implications of collecting, visualizing, and analyzing the resulting 3D datasets. This project explores the use of 3D GIS for intra-site stratigraphic analysis using the case study of three excavation trenches uncovered and recorded using a total station and photogrammetry techniques during the 2015-2017 field seasons at Chlorakas-Palloures1. . Henceforth referred to as.
Palloures, this site is a Middle to Late Chalcolithic (early 3rd millennium BC) site located in west Cyprus. Through this project, I propose a workflow for building volumetric 3D GIS models using photogrammtery models and spatial data recorded using a Total Station, then discuss the benefits and limitations of 3D GIS modeling of archaeological excavations in theory and in practice.
1.1 Advances in Excavation Documentation
It is often said that once a context is taken out of the ground, sifted, and discarded, the physical in-situ dataset is essentially obliterated (Morgan and Wright 2018, 1). In this way, excavation is seen as an unrepeatable experiment in which “interpretative drawings, photographs and site records are the only data sources available for post-excavation research” (Dell’Unto 2014, 152). Yet with the rise of digital technologies, the tiresome adage that ‘excavation is destruction’ has increasingly been called into question.
Digital documentation techniques have the potential to record archaeological stratigraphy faster and more accurately than traditional pen and paper approaches (De Reu et.al 2014, 260-261). For instance, laser scanners can be used to accurately model the topography of excavation surfaces by using a large number of individual point measurements to reproduce 3D space (Doneus and Neubauer 2005a, 197; Doneus and Neubauer 2005b, 227). Photogrammetry and computer vision has become exceedingly popular in recent years as the development of software programs, such as AgiSoft Photoscan, has allowed users to automate the entire process of creating 3D models of
1The second portion of the site name is italicized as per the naming conventions of the
8
material surfaces from photographs. This methodology results in quantitatively precise measurements of archaeological surfaces even faster and more cost-effectively than laser scanning, which is often out of the price range of many excavations (Ducke et.al 380; Olsen et. al 2013, 244-245; Tschauner and Siveroni Salinas 2007, 274). Moreover, the generated 3D models can be used as important tools for disseminating knowledge by
packaging it in a visually engaging format which is legible to the general public (fig.1.1)(De Reu et.al 2013, 1119-1120). By providing a means of holistically recording excavation data, digitization techniques improve archaeologists’ ability to preserve and communicate archaeological information. Thus, changing our thinking to “excavation is digitization” rather than destruction may prove incredibly beneficial for the discipline as a whole (Roosevelt et.al 2015, 325).
Figure 1.1: 3D reconstruction of Late Medieval horse skeletons at Lede “Domein Mesen,” Belgium created through computer vision techniques using Agisoft Photoscan (De Reu et. al 2013, 1119).
1.2 3D GIS
9
represent spatial relationships between data (Lock 2003, 165). Such novel technological capabilities inevitably opened up new directions in archaeological theory and research (Zubrow 2006, 14-15). This is most notable in landscape archaeology which sought to use GIS to better understand human behavior in relation to spatial variables (Richards-Rissetto 2017, 10).
Yet, attempting to represent 3D objects within a real-world context inherently necessitates the use of the third dimension. GIS software has traditionally involved x,y coordinates depicting 2D topology with elevation data stored as a single z-value for every x,y coordinate in the GIS system. This is most notable in commonly used digital elevation models (DEMs) and topographic maps: vertical or overhanging surfaces can not be modeled. Furthermore, if multiple objects (such as artifacts) are located in the same x, y coordinate but at different elevations, they would be plotted as a single overlapping point. Since true 3D spatial relationships are not possible in this system, scholars have dubbed this 2.5D GIS (Fritsch 1996, 2015, Klinkenberg 2016, 39, van Leusen and van Gessel 2016, 33-34; Zlatanova 2002, 27).
Disciplines such as geology and archaeology have a need to depict more complex 3D relationships and volumetric data. Thus, 3D GIS has developed over the past two decades through intensive research and an expansion of software capabilities (Stoter and Zlatanova 2003, 1). Ultimately, 3D GIS combines database and spatial information recorded using photogrammetry, total station, and other techniques into a volumetric model that shows the spatial relationships between layers, features, and objects in full three dimensions (van Leusen and van Gessel 2016, 34). As Klinkenberg points out, a true 3D GIS system is capable of working in three dimensions not only for visualizing spatial data, but also for all other aspects of GIS functionality: data entry, database management, and analysis and manipulation (Klinkenberg 2016, 40).
1.3 Previous Research and Theoretical Implications
10
A major issue in the adoption of 3D GIS methodologies is the limit of software capabilities since most GIS programs are still primarily in 2.5D (Stoter and Zlatanova 2003; Rahman et. al 2008, 3-4). Furthermore, opening up the possibility of building 3D GIS models necessitates a change in excavation documentation workflows geared toward the collection of 3D data. This is a challenge in and of itself (Huggett 2013, 22). As such, there have a been a number of investigations by various scholars experimenting with various workflows and understanding the theoretical implications of applying digital documentation methods.
11
Figure 1.2: 3D GIS model of a portion of the Çatalhöyük archaeological site created from multiple datasets. This model incorporates the spatial location of artifacts with 3D representations of excavation layers (Forte et.al 2015, 50).
12
1.4 Stratigraphic Studies of Chalcolithic Cyprus
That being said, 3D GIS only serves a purpose if there is a purpose to serve. In the case of this project, 3D GIS methodology will be employed to contribute to stratigraphic research of west Cyprus in the Middle and Late Chalcolithic periods using the case study of the Palloures.excavations. There are few examples of excavated sites in west Cyprus dating to these periods, and even fewer with visible architectural features. Most excavations have been carried out through the Lemba Archaeological Project (LAP) beginning in 1976 (https://www.ed.ac.uk) and in general exhibit a standard arrangement of free-standing roundhouses surrounded by open spaces and pathways. However, at a few sites there are noticeable changes in architecture and the organization of the built environment over time and this necessitates a more thorough investigation into inter-site variability of settlement arrangements (Papaconstantinou 2013, 130-131).
13
1.5 The Case Study: Chlorakas-
Palloures
The case study used for this project is the Middle to Late Chalcolithic (early 3rd millennium BC) site of Chlorakas-Palloures located in southwest Cyprus (fig. 1.3). This site was excavated from 2015 to 2017 as part of the Palloures Archaeological Project lead by Dr. Bleda Düring of Leiden University. As the plot was scheduled to be developed, the rescue excavation entailed uncovering as much of the site as possible during a limited time frame (Düring et. al 2016; Düring 2017; http://Palloures.eu). The 3D GIS visualization workflow study area includes adjacent trenches BU13, BV13, and BX13 (fig. 1.4).
Palloures is well-suited for research into 3D GIS since the excavations have been
documented almost entirely using digital methods. This includes a digital database of excavation data in Microsoft Access and recording spatial data (including elevation) of contexts, features, and artifacts using a total station. The trenches and special features, such as burials, were photographed from all angles in order to attain a collection of photographs for creating 3D models using photogrammetry. Additionally, aerial photographs of the site were taken before the start of excavation using a DJI.Phantom. vision+ quadcopter drone. The photographs were processed using Agisoft Photoscan in
order to create a digital terrain model (DTM) of the site for further GIS analysis (Düring et. al 2016, 8, http://Palloures.eu).
14
Figure 1.4: Trenches excavated at Chlorakas-Palloures during the 2015-2017 field seasons. Trenches modeled using the 3D GIS workflow presented in this project are highlighted in red (Figure by author).
1.6 Research Goals and Questions
The aim of this research has three components. First, I want to offer a reflexive review of current research on 3D GIS methodologies. Next, using Palloures as a case study, I plan on proposing a practical and standardized workflow for building a volumetric 3D GIS model of an excavation. I wish to express what the advantages and disadvantages of this workflow are, as well as warn of the potential pitfalls and technical limitations that may arise. Finally, I hope to contribute to stratigraphic research of Chalcolithic Cyprus by reviewing the stratigraphy of the site and discussing the differences between analysis using 3D GIS and 2D analog methods.
15
1. Considering the technological limitations of 3D GIS software, what is a feasible post-excavation workflow for creating a 3D GIS model using total station data and photogrammetric 3D models?
2. What contributions (if any) can 3D GIS modeling make to post-excavation stratigraphic analysis?
o What is the added value of using 3D GIS in comparison to traditional 2D methods?
3.
What can a stratigraphic analysis of Chlorakas-Palloures tell us about the settlement dynamics at the site?1.7 Methodology and Thesis Structure
The methodology employed to answer the questions listed above involves both literature-based research and a practical component. First, I discuss the history of 3D GIS in archaeological research in chapter 2. My intention is not to offer a discussion on the theory behind the various 3D data acquisition techniques such as photogrammetry, laser scanning, and LiDAR. A more thorough evaluation of these techniques can be found in other publications (van Riel 2016, 12-19). As my project focuses on post-processing of 3D spatial data, this research will instead involve a focused discussion of the various 3D GIS model-building workflows proposed by scholars in the past two decades.
In chapter 3, I present a literature-based review of prior excavations of Middle and Late Chalcolithic sites in west Cyprus focusing on the settlement dynamics evident in the archaeological record. This research centers around the sites of Kissonerga-Mosphilia, Kissonerga-Mylouthkia, and Lemba-Lakkous,. all excavated under the direction of Peltenburg. Because Peltenburg has been instrumental to the study of Chalcolithic Cyprus, this study is heavily influenced by his work. This chapter also includes a brief discussion of 2D stratigraphic documentation methods as they relate to the case study.
The practical portion of this research involves developing a workflow for combining spatial datasets from the Palloures.excavation in ESRI ArcScene 10.5.1, a 3D GIS platform with spatial analysis capabilities. Though it is not open-source, ESRI GIS programs are commonly licensed through universities and are thus available for archaeological research projects.
16
I begin by organizing and cleaning the total station data of the archaeological contexts recorded in the field. This step involves identifying and digitizing any missing excavation units using the GIS software ESRI ArcMap. The cleaned unit spatial information and photogrammetric models of three trenches (BU13, BV13, and BX13) are then converted into 3D formats compatible with the software and imported into ESRI ArcScene. Next, I propose three different vector-based modeling methods for representing the volumes of stratigraphic units using the capabilities of the 3D Analyst toolkit provided in ArcScene. Finally, the information contained in the excavation database are joined to the resulting volumetric models of the trench stratigraphy.
The final 3D GIS models are presented in chapter 5 along with interpretations of the stratigraphic processes at Palloures as evident within the modeled trenches. This chapter also evaluates the results of the workflow in terms of whether or not it fits the definition of a true 3D GIS and critically compares the results of the three volumetric modeling methods tested during the project.
Overall, the findings of this project have both methodological and socio-cultural implications. In chapter 6, I discuss the challenges encountered during the modeling process and present suggestions for improvement of post-processing and data acquisition techniques for creating 3D GIS systems. This discussion compares the workflow presented in this project with the workflows presented by other scholars. Next, I provide an analysis of the strengths and weaknesses of 3D GIS and 2D plan and section drawings for the purposes of stratigraphic visualization and interpretation. Additionally, I discuss how the stratigraphy of Palloures conforms to or deviates from the settlement patterns visible at contemporary sites.
17
Chapter 2: 3D GIS
3D GIS is not an entirely new concept in the field of archaeology. Indeed, researchers have been experimenting with this technique to aid in archaeological investigation since the advent of GIS itself. This chapter provides a working definition of 3D GIS and presents a history of how this approach was developed. Moreover, it summarizes how it has been applied in recent research contexts and discusses several methods developed by archaeologists to use 3D GIS for site documentation and stratigraphic analysis. These methods will be revisited in chapter 6, where they are compared and contrasted to the workflow introduced in this project. Finally, the chapter concludes with a discussion on the theoretical challenges of implementing 3D GIS workflows to archaeological research.
2.1 Defining 3D GIS
What exactly is 3D GIS? There are many definitions of this method in literature and thus it is necessary to establish what 3D GIS entails for the purposes of this research project. In their discussion of the potential use of 3D GIS in archaeological investigations, van Leusen and van Gessel define a 3D GIS model as “a volumetric model specifying BOTH layers, features and objects in three dimensions AND their spatial relationships” (van Leusen and van Gessel 2016, 34). They differentiate this solid volumetric modeling with 2D surface visualization in regular GIS applications. Instead of visualizing the outside of an object, what 3D GIS is concerned with is on the inside: the volume. The authors offer a geological model as an example (fig. 2.1)(van Leusen and van Gessel 2016, 34).
18
Figure 2.1: Three dimensional geological model of the Bitterfeld area showing geological stratigraphy (http://www.3d-geology.de) (van Leusen and van Gessel 2016, 34 Figure 1, per Martin Luther University Halle-Wittenberg).
Similarly, Klinkenberg cites Wheatley and Gillings who state that a GIS system is composed of four subsystems akin to the ones mentioned above: (1) data entry, (2) spatial database, (3) manipulation and analysis, and (4) reporting and visualization (Klinkenberg 2016, 39; Wheatley and Gillings 2002, 8-9). A true 3D GIS system must therefore be capable of performing all four functions in 3D in order to be considered successful. This definition has far-reaching implications as it opens up opportunities for using this approach for a variety of purposes aside from simply visualizing 3D relationships. Similar to regular GIS applications as discussed further in this chapter, 3D GIS should theoretically allow for the development of new methodological approaches for storing and analysing archaeological data. Thus, this is the definition employed in this project.
2.2 The History of GIS in Archaeological Research
19
the user to interact with and form interpretations of spatial data (Connolly and Lake 2006b, 11).
The history of GIS can be traced back to as early as 1950 when computers were first utilized for cartography. However, it is not until the 1960s when advances in technological capabilities and data storage facilitated the development of specialized computer programs to meet the demand for complex and nuanced spatial analysis and resource management. Commercialized GIS software began to appear in the 1970s, starting with the release of a vector-based software created by the Environmental Systems Research Institute (ESRI) (Wheatley and Gillings 2002, 8-10). Nowadays, both commercial and open-source GIS programs are used by a vast variety of disciplines and are prolific across all computer operating systems.
20
2.3 2.5D v. 3D
The limitations of the software became more apparent as archaeologists and professionals in other fields began applying GIS methodology to a plethora of spatial problems. One of the major concerns was the lack of three dimensional functionality. This is problematic as the earth’s surface is inherently three-dimensional and GIS software represented complex geological formations such as mountains and valleys in a 2D interface (Fritsch 1996, 1). The development of 3D functionality in GIS was, and continues to be, quite slow. Early solutions to this issue involved storing elevation data as an attribute: each x,y coordinate in geographical space was assigned a z-value to represent elevation. The resulting continuous surface with a singe z-value for each point on that surface was dubbed 2.5D (Fritsch 1996, 1). A classic example of 2.5D is a topographical map representing changes in elevation (fig. 2.2).
Figure 2.2: An example of a 2.5D GIS: a topographic map (http://geospatialtraining.com).
21
the volume of the unit (Tschauner and Siveroni Salinas 2007, 274). On the other hand, a
true 3D system would take volume into account and display the true spatial relationship between materials (Klinkenberg 2016, 39).
2.4 3D GIS Software Development:
Being able to visualize and analyze materials in three dimensions is critically important for a number of disciplines which deal with spatial information, especially georelated fields such as archaeology, geology, hydrographic survey, and oil exploration (Fritsch 1996, 1; Rahman et.al 2008, 3). The pressing need for improved functionality lead various GIS research groups to work on developing 3D software and structures as early as the late 1980s and well into the 1990s.
Rahman et. al . (2008) succinctly describe the challenges faced by developers, stating that adding a third dimension presents a slough of problems in and of itself and that the development of a 3D GIS environment “needs a thorough investigation of many aspects of GIS including a different concept of modeling, representations and aspects of data structuring” (Rahman et.al 2008, 3). Proposed solutions included a variety of data models such as integrating relational databases with a triangulated irregular network (TIN) system and combining CAD with DTM to incorporate topographical information with 3D objects (Rahman et.al 2008, 5-6).
A few commercial developers offered 3D capabilities early on, such as ESRI, which released a 3D Analyst (3DA) module in the late 1990s as part of their software package ArcView. However, 3DA was primarily oriented towards 3D display and visualization and lacked essential analytical capabilities (Rahman et.al 2008, 8-9; ). Another early software package is the Imagine system developed by ERDAS Inc. which included a module called VirtualGIS. This program, originally developed for image processing and remote sensing tasks, was similar to 3DA as it offered a visualization component but the analysis functions were lacking. GeoMedia Terrain created by Integraph Inc. and PAMAP GIS Topographer made by PCI Geomatics Inc. also offered 3D capabilities before the turn of the century yet this was also confined mainly to visualization (Rahman et.al 2008, 9-10).
22
used and the most developed of these is ESRI’s ArcScene which offers a user-friendly interface which does not require the end user to have extensive training in IT. Recent updates to the software have expanded the capabilities of its 3D Analyst extension and improved the memory allocation settings and speed of rendering within the program (Dell’Unto et.al 2016, 81).
2.5 3D GIS v. CAD
This discussion necessitates a quick note on the comparison of 3D GIS and CAD drawing methods. Originally intended for engineering and architecture design purposes, Computer-aided design (CAD) software allows for precise and “easy scalability between vector drawing on a computer and a real-world object(s)” (Jensen 2017, 3.1). Not surprisingly, it has been extensively used by archaeologists since the 1990s to aid in excavation documentation. Thus, it is arguable that digitally documentations methods akin to 3D GIS are not new in archaeology. Similar to vector drawings in GIS applications, CAD drawings are scale-able, have accurate spatial measurements, and may be linked to data within attribute tables (Beex 1995, 101). Indeed, early research on developing 3D GIS models integrated spatial data with the high-quality geometric modeling and structuring capabilities of CAD. Some of the first efforts included combining CAD objects with DTM or triangular irregular network (TIN) data structures to incorporate topographical data (Rahman et.al 2008, 5).
23
Figure 2.3: GIS v. CAD functionality: similarities and differences (Jensen 2017, 3.1).
2.6 Uses of 3D GIS in Archaeology
Now that I have established the history of 3D GIS development, I turn to how this approach can be applied within the field of archaeology. Indeed, moving beyond looking at sites from the perspective of flat 2D drawings to seeing them in a more intuitive 3D space opens up a variety of possibilities for archaeological research. An in-depth discussion on all the uses of 3D GIS is beyond the scope of this project (for a more nuanced summary of 3D GIS case studies as analytical tools, please refer to Piccoli 2018). However, I would like to highlight a few case studies exploring the analytical potential of this methodology.
24
illustration of the accessibility and visibility of iconographic features in architectural space which may be lost in traditional 2D visualizations (Richards-Rissetto 2017, 12-16). In this way, 3D methodologies can re-insert a human perspective back into GIS analysis.
Figure 2.4: A wall within the 3D model of Insula V 1 in Pompeii. Each colored area is linked to a different level of risk for heritage preservation as described by the associated table and matrix (Campanaro et.al 2015, 330, figure 10).
Overall, these studies highlight the potential for 3D GIS to supersede the limitations of 2D approaches for spatial analysis. Moreover, they emphasize how expanding our thinking to the three dimensions can benefit our understanding of the past. I now turn to the particular focus of this research project: the use of 3D GIS for the documenting archaeological excavations and for intra-site stratigraphic analysis.
With the advent of 3D digital recording technologies such as laser scanners and photogrammetry software, various workflows have also been presented for a complete digital documentation of archaeological sites and features. Yet, many recent attempts at incorporating digital recording techniques often fall short of true 3D GIS functionality and commonly utilize 3D models merely for “geometrical reference in support of the graphic documentation,” which reduces their usefulness for complex spatial analysis (Dell’Unto et. al 2017, 632). Take, for instance, the case study of Portonovo in Italy (Barbaro et.al 2015,
25
layers are not fully visualized. True 3D GIS workflows, on the other hand, are far more rare in excavation practice. A few important case studies are discussed in the next section.
2.7 Comparative Studies for Developing Effective 3D GIS Workflows
The aim of this paper is to develop a feasible workflow for creating a true 3D GIS system which allows for the analysis of site stratigraphy. Several research projects share a number of similarities with the workflow employed in this endeavor. These projects are summarized here and will be revisited in chapter 6 in order to explore best practices for building 3D GIS models for intra-site stratigraphic analysis.
First, methods for designing a holistic 3D GIS documentation system were explored at the stratigraphically complex Neolithic site of Çatalhöyük in Turkey. During their investigations, researchers experimented with laser scanning, computer vision, and photogrammetry techniques to find the most efficient method of creating 3D models in the field primarily aiming to facilitate a more reflexive system of on-site interpretation (Forte et. al 2012, 370-374; Forte et. al 2015, 44-47). The project involved integrating various typologies of data including 3D models of the excavation and data collected from previous field seasons within a 3D GIS environment using ESRI ArcScene. The resulting 3D environment was used for a spatial analysis to identify different activity areas within a house (see fig. 1.2)(Forte et. al 2015, 50-53). Furthermore, this methodology made it possible to transfer the created model to a virtual reality platforms. This allowed researchers to explore and form interpretations of the site from a completely different perspective as embodied observers within the architectural space (Forte et.al 2015, 49). Though the results of this case study are very promising, most archaeological investigations do not have access to as many resources as a famous site like Çatalhöyük. For instance, the virtual reality platform used in this case study may be out of the price range of smaller excavation projects.
Another workflow of interest is the recording system developed for excavating the site of Kaymakçi within the Kaymakçi Archaeological Project (KAP). Along with being “100% digital,” this recording system stands out in its focus on volumetric 3D recording (Roosevelt et. al 2015, 329). This workflow closely follows a single-context documentation
26
Pro. This orthoimage is then imported into an ArcMap GIS environment in which the extent of the unit is drawn in as a polygon feature (Roosevelt et.al 2015, 334). After this, the entire unit is excavated in its entirety and the bottom of this unit is documented using the aforementioned procedure. Using this dataset, researchers recreate the volume of each stratigraphic deposit by combining the 3D model point clouds of the top and bottom of each unit into a single model in the open-source program CloudCompare (fig. 2.5)(Roosevelt et.al 2015, 338-339). This method forces excavators to think volumetrically and be mindful of the stratigraphic relationships identified in the field. However, carefully cleaning and combining point clouds for all units at a large stratigraphically dense site may not be practical as this would require an exceptionally long processing time.
Figure 2.5: Volumetric 3D model of the stratigraphic units of a granary uncovered at Kaymakçi created using the KAP recording system. The end result is a water-tight representation of the stratigraphy of the feature (Roosevelt et.al 2015, 338).
27
PCs to process trench photographs and generate 3D models while on-site. These models are georeferenced using ground control points recorded using an RTK Geo Positioning System (GPS) .These georeferenced 3D models are then imported into ESRI ArcScene and excavated units are digitally recorded within the 3D GIS interface as 3D polyline features directly on top of the imported trench models. All associated data collected in the field is recorded into the 3D GIS geodatabase, which is structured based on traditional context sheets (Dell’Unto et. al 2017, 636-640; van Riel 2016, 33, 44-47). The end result is a comprehensive database management system (DBMS) within the GIS software that combines recorded excavation data and various spatial data sets including vector data and 3D models (fig. 2.6). For future reference within this thesis, this workflow will be dubbed the ‘Uppåkra’ workflow as per the sites at which it was developed.
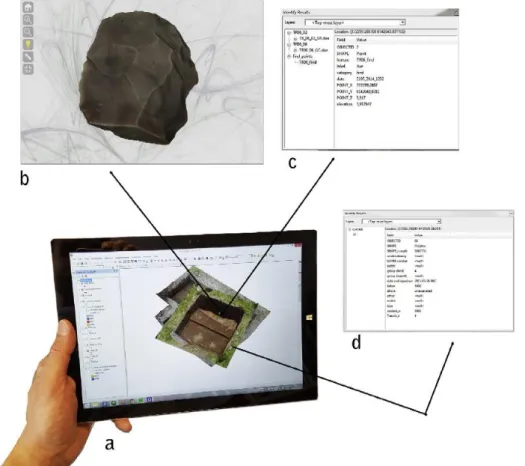
Figure 2.6: Data available through the ArcScene using the Uppåkra workflow, including (a) visualization of the site in 3D; (b) access to three-dimensional models of artifacts found within the trenches; (c) information regarding those artifacts; and (d) context sheets recorded on-site (Dell’Unto et.al 2017, 637, figure 5).
28
authors argue that this method leads to reflexive excavation practices as all the documented data can be queried and referenced during the digging phase (Dell’Unto et. al 2017, 638; van Riel 2016, 48). Indeed, the research team was able to import 3D models
of retrieved artifacts and situate them in the 3D GIS environment as they were uncovered in-situ. This practice made the spatial relationships between finds readily explicit thus helping to inform the excavation process (Dell’Unto et. al 2017, 640-642). The Lund University team further experimented with creating models of each excavation layer in order to reconstruct the stratigraphic composition of the trench and to better understand the spatial distribution of artifacts (Dell’Unto et. al 2017, 642-643). The results of this modeling process has not been extensively discussed in publications.
2.8 Voxel-Based 3D GIS Model Building
Most of the case studies described above and the workflow introduced through this thesis use vector-based modeling to visualize excavation units. Vector-based systems utilizes the principles of constructive solid modeling typically associated with CAD drawing; 3D objects are created by connecting 2D vectors or combining geometrical primitives such as cubes, spheres or cylinders. The resulting models are “boundary representations describing only the surface of a solid” (Tschauner and Siveroni Salinas, 2007, 281). Aside
from this data structure, there is another noteworthy volumetric modeling approach
which has been explored for the purposes of 3D GIS archaeological investigation:
voxel-based modeling.
Instead of vectors, voxel-modeling systems extend a raster surface into the third
29
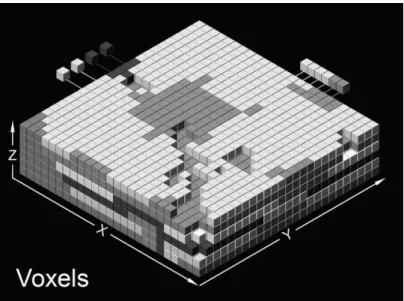
Figure 2.7: Example of a voxel data structure. A solid is modeled using identically-sized cubes thus preserving a uniform resolution throughout (Tschauner and Siveroni Salinas, 2007, 282, figure 12).
In general, voxels are used to represent the three-dimensional volume of objects and are often employed in the field of geology to model geological formations and soil layers (Fritsch 1996, 4; Lieberwirth 2008b, 80; Nguyen-Gia et. al. 2017, 128; Stoter and Zlatanova 2003, 2). Although not a new development (the use of voxels in 3D GIS applications in geological sciences dates back to the 1990s), this data structure is increasingly becoming a more prominent area of interests for 3D GIS modeling in archaeology (Fritsch 1996, 4; Tschauner and Siveroni Salinas 2007, 274).
30
There are, however, some methodological disadvantages that are important to take into account. First, it requires an incredibly high file size depending on the resolution of the model and thus necessitates high computer memory, storage space, and processing power (Rahman et.al 2008, 4-5; Stoter and Zlatanova 2003, 2; van Leusen and van Gessel 2016, 35). The issue of scale poses another challenge in that researchers are often interested in a wider geographical area as well as more localized inter-site research contexts (van Leusen and van Gessel 2016, 37). Even a single excavation level, the memory required to store stratigraphic data is enormous (Tschauner and Siveroni Salinas, 2007, 281). Furthermore, handling uncertainty in representation and the absence of data may
pose problems as voxel-based modeling requires one to ‘fill in the gaps.’ In which case, how would we compare different models with different degrees of uncertainty (van Leusen and van Gessel 2016, 37)? Theoretical implications aside, the main obstacle to using voxel-based 3D GIS remains similar to that of 3D GIS in general: there is little consensus on how to implement it in practice and software capabilities are lacking. After all, modeling solids requires dimensional information of all surfaces which is difficult to accurately attain for archaeological units (Forte et.al 2015, 55; http://www.csanet.org).
Nevertheless, Lieberwirth argues that voxel-based modeling could potentially offer significant benefits to stratigraphic analysis. Able to represent continuous overlapping phenomenon, voxels may be used to represent stratigraphic units of excavations (van Leusen and van Gessel 2016, 35). The advantages of this technique are numerous: in a GIS environment, spatial location of artifact finds may be incorporated and volumetric calculations may aid in determining artifact densities for various artifact classes. Lieberwirth offers a possible workflow for making voxel-based modeling a reality using Grass GIS, an open source GIS software (Lieberwirth 2008a, 2).
31
in any direction to study the stratigraphy from all sides (Lieberwirth 2008a, 7; Lieberwirth 2008b, 85). Additionally, this program allows her to add vector points to show artifact positions and to measure distances between objects within the model. Lieberwirth concludes that voxel-based modeling may offer the possibility to re-excavate a trench “step by step, disregarding the excavation method, following the natural course of the soil types” (Lieberwirth 2008a, 7).
Figure 2.9: The resulting 3D voxel-based model of the stratigraphy of trench IX, Akroterion, Kythera, created in GRASS GIS and visualised in ParaView (Lieberwirth 2008a 6, figure 7).
2.9 Critiques and Theoretical Considerations
I now turn to the theoretical challenges researchers face for employing 3D GIS in archaeological investigations. In order to fully understand the current role of 3D GIS in archaeology, it is important to look deeper into the critiques surrounding its development since the potential of this methodology for furthering archaeological research has been a point of contention since its initial conception. The title of Klinkenberg’s article, ‘Are we there yet?’ (Klinkenberg 2016, 39), is testament to this controversy. As with many other digital techniques introduced since the technological revolution of the 1960s, 3D GIS has been criticised extensively for its limited contribution to the field of archaeology and the implications of the technique on academic research are yet to be fully investigated. The fundamental questions remain: is it useful? And does it work?
32
becoming ‘technocrats’ by applying new software indiscriminately (Zubrow 2006, 14, 26). This critique is common in GIS research and especially in landscape archaeology, which has gone through a theoretical overhaul to incorporate anthropological and cognitive theory in an attempt to mitigate the over-simplification of geographic information presented through GIS computations (Lock 2003, 173; Richards-Rissetto 2017, 10-11).
On the other hand, Zubrow argues that the development of new technologies plays a significant role in advancing archaeological theory as its opens up opportunities to ask questions that could not previously be answered using prior methodologies. However, there must be a tangible archaeological value to justify their use (Piccoli 2018, 74-75; Zubrow 2006, 15-16). For instance, photogrammetry and computer vision techniques have the potential to revolutionize the practice of field documentation by offering an inexpensive and accurate method of capturing the surface of archaeological sites (De Reu et. al 2013, 1110-1112). GIS offered novel analytical techniques such as cost surface
analysis (Lock 2003, 172-173). Following this pattern, it is important to ask what valuable questions 3D GIS could answer that cannot be answered using an existing methodology.
Thus, the answer to “is it useful?” lies in the ability of 3D GIS to transcend the capabilities of traditional recording, visualization, and analysis methods. As Zubrow points out, there is no sense in applying a new technique on a problem that already has a simple solution (Zubrow 2006, 14, 26). In other words, before archaeologists shift excavation documentation methods to focus on the acquisition of digital data for the creation of 3D GIS models, a retrospective analysis is crucial to identify the added value of this technique upon archaeological practices and interpretations. If the same information can be derived from simple section and plan drawings, then there is no added advantage of using a complex 3D GIS tool requiring high computer processing power and a novel data organization structure.
Additionally, it is important to consider functionality. Does it work? 3D GIS faces the challenge of moving beyond simply a visualization technique. Despite the examples given in this chapter regarding the use of 3D GIS in current research, the old adage that digital models are nothing more than ‘pretty pictures’ inevitable comes up. Though this critique is more often directed at 3D reconstructions of architectural features, it may also be applied in this case as well. For instance, archaeologists have begun incorporating photogrammetry into the documentation strategy. However, 3D models are rarely used for purposes other than record-keeping and visualization (Dell’Unto 2016, 310; De Reu et. al 2013, 1119-1120). This issue primarily stems from the limitations of 3D GIS software.
33
the market. Most software packages have focused on providing a high-quality visual display of 3D features. However, developing analytical functionality commonly found in 2D GIS, such as buffering, intersection, and measurement tools, involves more work (Rahman et.al 2008, 1-4).
Unlike Rahman et.al , Klinkenberg writes after the release of ESRI ArcScene and improved 3D functionality in open-source GIS software. His evaluation of the 3D GIS offers a few case studies from his own research of Tell Sabi Abyad in Syria, and highlights the existing possibilities for database management and spatial analysis using ESRI ArcScene. Taking a more positive stance than his predecessors, Klinkenberg concludes that 3D GIS can and should be used for more than just visualization and may be leveraged to answer research questions regarding the spatial configuration of features and artifacts at archaeological sites (Klinkenberg 2016, 46). However, more research is necessary in order to explore the analytical possibilities inherent in this approach.
2.10 Data Accessibility and Sustainability
Other essential considerations concerning the implementation of 3D GIS are the issues of data accessibility and sustainability. Data accessibility describes “a user's ability to access or retrieve data stored within a database or other repository” (Richards-Rissetto and von Schwerin 2017, 39). As the functionality between software programs varies, access to 3D GIS models is limited to users with licenses to the programs in which these models were created and computer systems with enough memory and processing power to handle them.
34
is beyond the scope of this project, moving forward, any discussion on the applicability of 3D GIS should involve thinking about how to make sure that the data collected today is accessible and usable by future researchers.
35
Chapter 3: Stratigraphic Studies in West Cyprus
(Chalcolithic Period: c. 3800-2500 BC)
This project is concerned with applying 3D GIS methodology in order to better understand the archaeological stratigraphy of Chlorakas-Palloures. Thus, this chapter discusses the particular issues involved in stratigraphic analysis of Chalcolithic Cypriot sites and provides an overview of prior research undertaken at three nearby Chalcolithic sites around Palloures: Kissonerga-Mosphilia,.Kissonerga-Mylouthkia,.and.Lemba-Lakkous The excavation at Palloures is introduced and some of the issues with traditional 2D documentation strategies are reviewed.
3.1 The Lemba Archaeological Project
Chlorakas-Palloures is located in the Paphos district in western Cyprus. This area has been primarily studied by Edgar Peltenburg who served as the director for the Lemba Archaeological Project (LAP), a research effort set up by the Department of Archaeology at the University of Edinburgh in cooperation with the Department of Antiquities of Cyprus. Beginning in 1976, extensive survey and excavation efforts were carried out through LAP at the key Chalcolithic sites in the Lemba region including Kissonerga-Mosphilia,. Kissonerga-Mylouthkia,. Souskiou Village, Souskiou-Laona,. and. Lemba-Lakkous. The overall aim of the Lemba project was to instigate the prehistory of the region with a particular focus on better understanding the Chalcolithic period (c. 3800-2500 BCE) (https://www.ed.ac.uk). Although the chronological phasing in Cyprus is contested and regional variations exist, in the context of this thesis I will be using subdivisions listed below (Peltenburg et al 2013, 2):
Early Chalcolithic: c. 3800-3400 BCE Middle Chalcolithic: c. 3400-2900 BCE
Late Chalcolithic: c. 2800-2400 BCE
3.2 Studies of Stratigraphy at Chalcolithic Cypriot Sites
36
periods and they are mainly located in the Paphos district and the Southern Chalk Plateaus regions in the western and southern coasts of the island (Peltenburg et al 2013, 6). Furthermore, sites are often disturbed by extensive post-depositional processes including terracing, plowing, and natural erosion. The effects of these have been exacerbated in modern times due to a growth of the tourism industry and changes in agriculture practice (Croft 2003, xxxi).
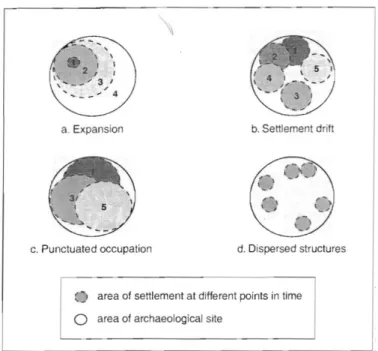
The effects of land development in the region had enormous negative impact on the archaeological record because the stratigraphic layers at prehistoric Cypriot sites typically are already shallow (Papaconstantinou 2013, 129; Peltenburg 1991, 19). Some scholars attribute the shallowness of the archaeological layers to the lack of defensive walls around settlements or their geographic position away from hilltops which may promote the accumulation of deposits (Webb and Frankel 2004, 135). Ephemeral sites are susceptible to dispersal as they are “less fixed in space than their Near Eastern counterparts” (Frankel et.al 2013, 15). Stratigraphic analysis of these sites is thus further complicated by shifting settlements and a variety of settlement use patterns evident in the archaeological record (fig. 3.1) (Frankel et. al 2013, 15-17; Papaconstantinou 2013, 129).
Figure 3.1: Examples of various patterns of settlement use: (a) expansion; (b) settlement drift;(c) punctuated occupation; (d) dispersed structures (Webb and Frankel 2004, 135, fig. 9.10).
macro-37
scale chronologies” (Frankel et. al 2013, 17). It is necessary to also link the patterns observed within individual sites to the greater geographic region. Overall, researchers have relied on other lines of evidence, such as ceramic and radiocarbon dating, when comparing chronological sequences between sites (Frankel et. al 2013, 15). However, there are a few sites on the island in which the architectural features may provide evidence of a stratigraphic sequence, especially in contexts with multiple layers associated with living floors. The most prominent architectural changes occur in the transition from the Chalcolithic to the Early Bronze Age period in which circular buildings give way to more rectilinear forms. On the other hand, we do not yet have a complete understanding of architectural development within the Chalcolithic period, although it is evident that local and regional variations exist (Bolger 2013, 2). Detecting changes and inter-site variations during the 3rd millenium is quite difficult given the fragmentary nature of the archaeological record (Papaconstantinou 2013, 129-130). Three prominent Chalcolithic sites, Kissonerga-Mosphilia,. Kissonerga-Mylouthkia,. and. Lemba-Lakkous. (fig. 3.2),. are discussed below.
Figure 3.2: Map of Paphos District showing location of major archaeological sites including Chlorakas-Palloures, Lemba-Lakkous, Kissonerga-Mosphila. and Kissonerga-Mylouthkia (figure by author).
3.2.1 Kissonerga-Mosphilia
38
earliest prehistoric periods to the beginning of the Bronze Age (c. 4500-2300 BCE). At 12 hectares, the site is characterized by its exceptional size as other contemporaneous sites are significantly smaller, usually averaging around 3 hectares (Papaconstantinou 2013, 131; Peltenburg 1991, 19-20). Due to its large size, the site is referred to as Kissonerga. Other sites of the Lemba cluster, such as Kissonerga-Mylouthkia, are thus differentiated by their secondary name. Excavations from 1979 to 1992 opened up two areas of the site for investigation: the Main Area and the Upper Terrace in the north of the site (Frankel et.al 2013, 21). As with many other Cypriot sites, the stratigraphy is characteristically shallow with most deposits less than one meter deep and consisting primarily of superimposed architectural units. Kissonerga has also been subject to severe post-depositional damage due to erosion, plowing, and terracing (Peltenburg 1991, 19). Chronology of the site has therefore been derived from radiocarbon dating and material finds (mainly ceramics) associated with “securely stratified local sequences” (Frankel et.al 2013, 23).
39
Figure 3.3: Single-phase plans of Kissonerga-Mosphilia: (A) Early-Middle Chalcolithic; (B) Late Chalcolithic (Peltenburg et al. 1998, fig. 31 in: Papaconstantinou 2013, 132, fig. 4.1; Peltenburg et al. 1998, fig. 39 in: Papaconstantinou 2013, 134, fig. 4.2).
40
3.2.2 Kissonerga-
Mylouthkia
Located just one kilometer northwest of Kissonerga-Mosphilia, the site of Kissonerga-Mylouthkia is an eroded coastal site which is considered a part of the Lemba cluster of Chalcolithic sites in the Kitma Lowlands of west Cyprus. Henceforth referred to as Mylouthkia, the site was excavated from 1976 to 1996 by the LAP. Much like other sites in the region, it has been extensively affected by agricultural and housing development (Peltenburg et.al 2003, xxxiii-xxxiv).
Excavations revealed two distinct types of buildings at Mylouthkia which correlate to the Early Chalcolithic and Middle Chalcolithic periods. Examples of the Early Chalcolithic house type consist of highly eroded circular hollows in the ground surrounded by multiple post-holes. Evidence of a plaster-lined floor surface and structural mud ridges lead scholars to infer that these structures were likely constructed from timber and mud walls of indeterminate height (Croft and Thomas 2003, 123). The Middle Chalcolithic houses are similar to those found at Kissonerga period 3B and are best exemplified by building 200 which showed evidence of four consecutive phases of construction, occupation, destruction, and collapse (fig. 3.4)(Croft and Thomas 2003, 119). The walls of this structure are built from plastered rubble and there is evidence of continued re-plastering of the interior. Postholes within the structure point to a wooden roof construction and there may be some evidence of spatial partitioning in the earlier phases. The hearth consists of a firebowl in the center of the building, a common Chalcolithic feature (Croft and Thomas 2003, 125-126).
41
3.2.3 Lemba-Lakkous
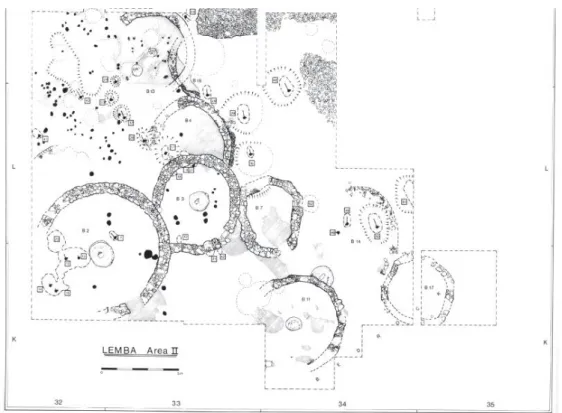
Lemba-Lakkous is located in the foothills of the low Paphos Plateau ca. 4km north of the town of Paphos in the Lemba region and around 2 km south of Kissonerga. It is a small elongated settlement of around 3 hectares nestled between two streams on its northern and southern sides. Excavated from 1976 to 1983 by the LAP (Peltenburg and Baird 1985, 1-4), the site was predicted to span a greater part of the Chalcolithic period. Unfortunately, the stratigraphy was difficult to establish due to a variety of issues including the shallow depth of ancient remains, irregular bedrock deposits, and complex post-depositional disturbances. The scarce evidence of structures that were found indicates that the site was in use from the middle of the 4th to the early 3rd millennium BCE and was organized similar to the settlement found at Mosphilia. The Middle Chalcolithic phase was characterized by several uniform buildings clustered together with a circular hearth and ridges dividing the floor space. Burials were grouped together in large open communal areas between buildings (fig. 3.5)(Papaconstantinou 2013, 135).
Figure 3.5: Plan of Area II at Lemba-Lakkous (after Peltenburg and Baird 1985, fig. 122 in: Papaconstantinou 2013, 136, fig. 4.4).
42
communal areas (Papaconstantinou 2013, 135-137). There appears to be some settlement drift toward the south along the slope of the hillside. Much like other sites in the area, the chronology was reconstructed based on ceramics and 14C dates (Frankel et.al 2013, 25-26).
3.3 Chlorakas-
Palloures
The site of Chlorakas-Palloures is located 1 km south of Lemba-Lakkous and 2.3km south of Kissonerga within the Lemba cluster of Chalcolithic sites in the Kitma lowlands of the Paphos District (Düring et.al .2018, 12). In 2015, the Palloures Archaeological Project was set up to investigate the site by Leiden University in collaboration with the Department of Antiquities of the Republic of Cyprus in Nicosia. During the 2015 to 2017 field season, the project. focused on a rescue excavation of a field with land registry number 568 which was expropriated from the owners as it was scheduled for development (Düring 2017, 1). As with other prehisotric sites in west Cyprus, Palloures was expected to be heavily influenced by post-depositional disturbances and had been greatly disturbed by agricultural and urban development since the 1970s (Düring et. al 2016, 1; Düring 2017, 5). Ceramic evidence from survey and excavations dates the site to the Middle and Late Chalcolithic periods. Thus, further research may contribute to a better understand of the transition between these two periods (Düring 2017, 12-13).
As demonstrated above, there is great variation in settlement size and settlement arrangements during the Chalcolothic period (Papaconstantinou 2013, 130). There are also few sites available for study and much difficulty involved in creating relative chronologies between them even with the support from ceramic analyses (Crewe 2014, 138). Unlike the three sites discussed above, the stratigraphy of Palloures is exceptionally deep and thus, research into the stratigraphic nature of the site may benefit our understanding of the chronological sequence and regional variations in settlement patterns during this period.
43
stratigraphy of over one meter in trench BU13, trenches BV13 and BU13 contain large structures and several plaster floor layers. The intention of this project is to determine whether a 3D GIS model could clarify the stratigraphic relationships between these features.
3.4 2D Stratigraphic Documentation
In order to aid in a stratigraphic analysis of Palloures, it is also important to review the methods with which stratigraphy is traditionally documented at archaeological sites. Harris states that the stratigraphy of a site “is an unconsciously compiled record of past societies and their activities” (Harris 1989, 20). Therefore, the careful study of this stratigraphy would lead to an informed interpretation of past human activity. However, stratigraphic information is commonly recorded and published as 2D plan and section drawing which are prone to methodological issues inherent to the medium. First, projecting 3D information onto a 2D plane inevitably reduces its effectiveness to present complex 3D data. Section drawings are also often difficult to interpret for non-archaeologists (Reilly 1990, 133). Moreover, spatial data is often published as separate drawings and figures which leads to “notoriously selective and inaccessible collections of spatial data,” thus “rewarding creative interpretation rather than “mere” collection of evidence” (Tschauner and Siveroni Salinas 2007, 273-274). This section reviews the issues within 2D section and plan drawing and asks the question: could 3D GIS provide a solution?
Section drawings are utilized to visualize the stratigraphic sequence of a site and to record the vertical dimension of deposits. As such, they provide a pseudo-3D reconstruction of the site’s taphonomic processes and clarify stratigraphic relationships between units (Harris 1989, 72; Roskams 2001, 143-144). Roskams identifies two different types of section drawings: balk and cumulative. Balk sections are usually drawn at the end of an excavation by directly recording the stratigraphic sequence evident in trench walls or balks (Roskams 2001, 144-145). Cumulative sections are created by sequentially recording underlying units as they are uncovered, usually along a predetermined line across a specific area of interest. Unlike balk sections, the entire sequence is never seen in its entirety as units are removed before the next deposit is recorded (Roskams 2001, 145).
44
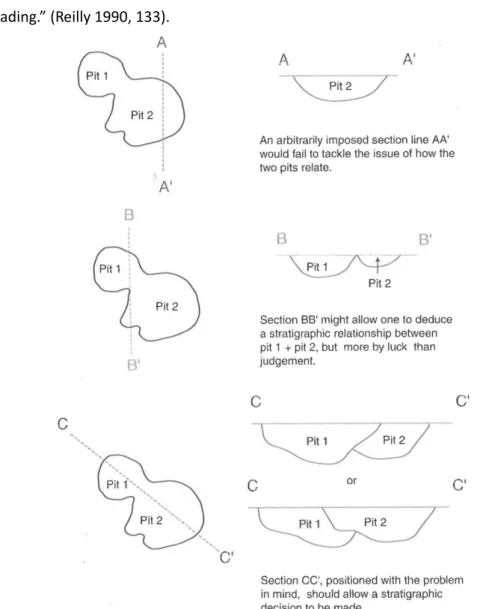
drawings never contain a complete stratigraphic sequence evident at the site or even within a single trench (Harris 1989, 71; Roskams 2001, 145; Tschauner and Siveroni Salinas 2007, 274). This is problematic for sites with ephemeral and irregular architectural features such as those found at Chalcolithic sites in Cyprus. This problem is compounded by the fact that cutting two adjacent deposits at different angles results in different interpretations of the data (fig. 3.6). Hence, additional individual sections of specific stratigraphic problems must be drawn in order to faithfully convey the spatial relationships between deposits. Yet, unless all unit relationships are detailed in this manner, the result of this documentation strategy is a “biased and partial record, which is potentially misleading.” (Reilly 1990, 133).
45
Along with section drawings, archaeologists employ several types of horizontal plan drawing methods each with their own theoretical underpinnings. These are top plans, single-phase plans, and single-context plans (fig. 3.7)(Roskams 2001, 137).
Figure 3.7: Examples of three types of plan drawings (after Roskams 2001, 138).
Top plans are drawings of the horizontal extent of an excavated area, drafted at a specified point in the excavation process. This method is inherently arbitrary; features are included in the drawing regardless of whether they belong to the same period. The resulting visualization thus do not represent an actual moment in the development of the site, but rather a snap-shot of the excavation process (Roskams 2001, 139). On the other hand, single-phase plans provide a horizontal visualization of only those features interpreted as belonging to a single point in time (Roskams 2001, 139). Yet, the value of this kind of drawing “depends on the validity of the phasing interpretation, which is at the discretion of the excavators (van Riel 2016, 61). Düring further critiques this approach stating that such phase interpretations often over-simplify past occupational processes into discrete periods in which all similar architectural features are represented as having been constructed, used, and abandoned at roughly the same time. In actuality, each architectural unit has its own life history that may not be easily correlated to other stratigraphic layers within the site. Settlements are “in a state of constant flux” and thus looking for overarching continuous occupational phases will often prove ineffectual (Düring 2012, 331). Düring suggests that focusing on a micro-stratigraphy of specific areas of excavations which may most reliably linked to other strata “if direct stratigraphic relationships exist or by means of a good series of radiocarbon dates” (Düring 2012, 331). Such micro-stratigraphies may serve as a more reliable means of depicting the nuances of complex site formation processes.
46
stratigraphic unit (layer, feature, or cut) is described separately and linked to adjacent stratigraphic units by means of a Harris Matrix” (Düring 2012, 325). As such, the Harris Matrix serves as a conceptual tool for mapping out spatial relationships between archaeological strata. Yet, single-context recording is not without its critiques. Roskam points out that this method may reduce the possibility of on-site interpretations as “each unit seem(s) to float free of any of its associates” (Roskams 2001, 1). On the other hand, I would argue that this approach actually facilitates stratigraphic interpretations in the field rather than detracts from it as the excavator becomes hyper aware of the relationships between the unit in question in comparison to other deposits (Harris 1989, 34). This is evident in the KAP recording system laid out by Roosevelt.et.al .(2015) which is geared toward single-context excavation and is highly focused on recording the top and bottom interfaces between deposits. This method “encourages best practices of material collection and stratigraphic separation because it prevents contexts that physically overlap whatsoever from simultaneous excavation” (Roosevelt et.al 2015, 334).
Overall, van Riel suggests that “a good practice could be to document single-context where possible, and a composite drawing where necessary” to ensure complete documentation of the archaeological record (van Riel 2016, 60). 3D GIS models of site stratigraphy may additionally offer a solution to some of these critiques.
47
Chapter 4: Methods
To generate a three-dimensional dataset for stratigraphic analysis, it is important to convert all spatial data collected in the field to a 3D format for use in ArcScene. In this chapter, I review the documentation methods used at Palloures and then describe the workflow I used to create a 3D GIS system following the definition presented in chapter 2: a volumetric model representing the spatial relationships of materials in the third dimension. As per Klinkenberg, this model must be capable of data entry, can serve as a spatial database, and should allow for analysis and visualization of spatial relationships (Klinkenberg 2016, 39). The aim of this research is to present an effective and feasible workflow which may be applied to future archaeological projects.
It is important to note that the dataset utilized for this research has been provided by Klinkenberg and has been partially post-processed by other members of the Palloures team. This work affects the subsequent steps in the 3D GIS workflow. The data acquisition practices and the post-processing done before the start of this research is outlined below.
4.1
Palloures
Documentation Methods
Before describing the workflow used for post-processing, I summarize how the dataset was collected in the field. With a few minor exceptions, excavations at Palloures followed the same documentation methods during the 2015-2017 field seasons.
48
Figure 4.1: Trenches excavated at Chlorakas-Palloures during the 2015-2017 field seasons (figure by author).
Using different Total Stations each year lead to slight technical differences in the data collected. This is important to note because different post-processing procedures were necessary for each dataset in order to arrive at the final 3D GIS model. Budget constraints and issues in availability of resources commonly lead to differences in equipment between field seasons at many excavations. The intent of the workflow presented later in this chapter is to demonstrate how a 3D GIS system can be set up despite such changes.
Table 4.1: Differences in Total Stations used each year (table by author).
49
3D models were created with photogrammetry techniques by processing ground-based photographs of features and trenches in the software AgiSoft Photoscan. Models were made for each special feature, including burials, architectural remains, and complex find contexts such as floors with multiple layers. Additionally, photogrammetry models were created for each trench at the end of its excavation. These trench models were used to generate orthophotos of the plan and of each section of each trench. These orthophotos were then annotated by the trench supervisor to depict the stratigraphic sequence within the sections and to create a composite plan of the units visible at the bottom of each trench.
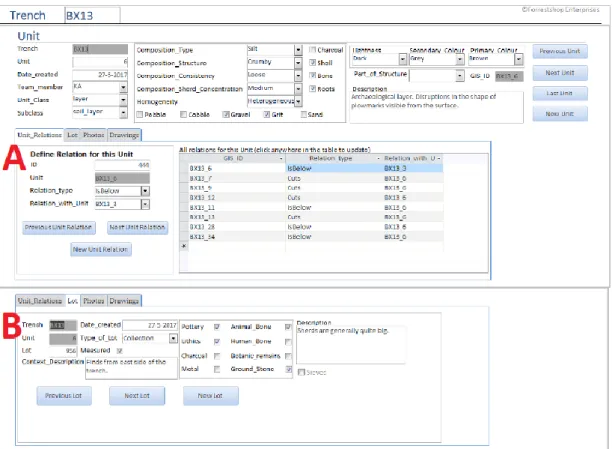
Additionally, an excavation database was set up in Microsoft Access (fig. 4.2). Instead of using paper context sheets, information regarding each unit and lot was recorded in the field directly into the database using a tablet assigned to each trench. Along with descriptive data, the recorded information includes the stratigraphic relations between units identified in the field. A list of possible unit relations can be found in table 4.2.