Perspective
Relationship between shifts in food system
dynamics and acceleration of the global nutrition
transition
Barry M. Popkin
Editor’s Note:
In celebration of the 75thanniversary ofNutrition Reviews, the journal’s editors envisioned the publication of articles that examined the changing landscape of nutrition research and the food systems required to ensure sustainability of the global food supply that feeds the projected 9 billion people on earth. In this Perspective article, Dr. Popkin highlights the global nutrition transition that has been fueled by approximately 4 decades of research on food processing, preservation, and retail. This transition has also been influ-enced by changes in economic development and dramatic reductions in many communicable diseases (although new infectious agents have also been discovered) with a concomitant rise in chronic, non-communicable diseases that ultimately threaten the well-being of mankind. Whether research will allow scientists to reset the balance for our food supply remains unknown, but the editors of this journal believe that the forthcoming articles in 2017 and beyond will stimulate thought leaders to formulate solutions that will be our “moonshot” to ensure the production of quality food in a sustainable manner with minimal environmental impact to feed the growing population of the world.
Naomi K. Fukagawa, MD, PhD Editor-in-Chief
Over the past 2 decades a remarkable change in the way the world’s population shops and eats has occurred. Related to that has been a transformative change in the chain of food – from farm to fork – and the forces that control it. While most populations in the post World War II era consumed much of their diet in the form of home-cooked basic com-modities – vegetable, tuber, or animal-source foods, this has shifted remarkably. Now it seems that the task of cook-ing has vanished from many households1and the food con-sumed in much of the world is shifting from purchases made at local fresh markets to packaged and processed ready-to-eat or ready-to-heat food.2–4
The broader system that is defined by the activities, infrastructure, and people involved in feeding the global population (eg, the growing, processing, distribution, con-sumption, and disposal of foods) is referred to here as our “food system.” It includes the web of processes by which institutions, organizations, and individuals transform in-puts into foods and individual ingredients into the food we consume (eg, seed, fertilizer, chemicals, and
pharmaceuticals go into poultry which becomes chicken nuggets).5 All food systems interact with aspects of their environmental, societal, political, and economic con-texts.6 A core element of all food systems is the “food supply chain” or “food value chain” through which food moves from farm to fork.7Increasingly, environmental sustainability has become one of the major concerns related not only to our food system but also to our mod-ern diet. In my opinion, it is clear that the modmod-ern diet must change, and with it our food system, if the human population is to reduce global emissions, cut water use, and enact many other agriculture-related changes that will foster a more sustainable food supply and a health-ier population; however, there are key gaps in our knowledge, which are noted below.
My opinions and ideas described herein were first real-ized while wandering through the modern retail stores of Asia and Africa – be they small convenience stores in vil-lages, or large modern supermarkets, or mega-markets in larger cities. I later realized, the phenomenon I’d been
Affiliation:B.M. Popkinis with the Department of Nutrition and the Carolina Population Center, University of North Carolina, Chapel Hill, North Carolina, USA. Correspondence:B.M. Popkin, Carolina Population Center, University of North Carolina, 137 E. Franklin St. Chapel Hill, NC 27516, USA. Email: [email protected]. Phone:þ1-919-962-6139.
Key words: convenience, food processing, food system, nutrition transition, processed food, food regulation, sustainability.
observing had been documented by the agricultural econo-mist Thomas Reardon,8–11 who was later joined by other agricultural economists as well as scholars from other dis-ciplines as this present documentation shows. In my own research using 24-hour recall surveys in China in 2011 and Mexico in 2012, my colleagues and I found that large portions of the foods consumed were packaged and pro-cessed. This knowledge allowed us to investigate the dietary intake side of this large growth of packaged and processed foods in the retail sector in other countries as well.4,12
The next major insight was gained by our work in the United States (and globally) aimed at understanding the enormity of the packaged/processed foods and beverages industry and the degree of processing under way. We found major shifts in the United States toward foods and beverages that were mainly ready-to-eat or ready-to-heat,2 marked differences in how various racial or ethnic groups purchased highly processed vs minimally processed foods and ingredients, and changing trends in the numbers of people who do and do not cook.3,13This research has been accelerated globally by Carlos Monteiro and his team, who have highlighted the major roles that ultra-processed or highly processed foods have in modern diets.14,15
Finally, Thomas Reardon, Bart Minten, and others who have followed the food chain from the farm to the consumer in India, Bangladesh, and China showed that what farmers grow and to whom they sell is governed by the same economic actors as those seen in high-income countries like the United States for decades (eg, agribusinesses, retailers, food manufacturers, food ser-vice companies).25They additionally highlighted a true transformation in how food is produced and handled throughout the global food system.25
The nutritional implications of the post World War II revolution in production and control of farming has led to a very different set of major actors affecting our diets. The implication of these changes is highly disputed. Some will say that processing has produced many posi-tive improvements with minimal costs,16,17while others will point out potential conflicts,18and yet others will en-tirely disagree and feel that the modern processed food supply is a major cause of widespread poor health.14
No matter where the causal pathway lies, the world now faces far more obesity and diet-related noncommuni-cable diseases (NCDs) than in the past. Well over 2 billion individuals are overweight or obese, and most countries face higher mortality from these nutrition-related NCDs than from undernutrition and infectious diseases, which were the scourges of the past millennium. The modern agriculture system poses problems for the way countries must work to improve our diets. The text below takes us through the way our food system has rapidly changed and what this has done to our diet. The overview ends with a discussion of how some nations are attempting to meet
their populations’ diet-related health challenges through regulation; however, since no country has reversed obesity rates to date, the global challenge remains immense.
My purpose in writing this piece is to help the nu-trition community understand (1) how rapidly the sys-tem underlying what we eat has shifted, (2) how these shifts are affecting human health across the world, and (3) how these changes have shifted the ways countries are attempting to encourage healthier diets using the policy options they have available to them.
TRANSFORMATION OF THE GLOBAL RETAIL FOOD SYSTEM
While the first self-service grocery market in the United States was Piggly Wiggly, the first major chain selling retail food nationally was the Greater Atlantic and Pacific Tea Company. At first, this chain sold only tea and coffee (before the 1900s), but over time it developed into the dominant full-service grocery store chain (the A&P) in North America.19,20In Europe, stores such as Tesco in England and Ahold (which began as Albert Heijn) and Aldi in Germany emerged early in the 20th century.The density of European cities delayed the emergence of the larger supermarkets (and mega mar-kets) and today’s mega-chains such as Walmart were mainly post–World War II phenomena. The two largest global companies, Carrefour and Walmart, started their major growth in the 1960s and 1970s, respectively.21
In the United States, the current dominance of the modern supermarket in the food system is very obvi-ous.22,23While small shops and other types of conveni-ence stores abound and drug stores, gas stations, and other venues sell selected food and beverages, the bulk of purchases occur at grocery stores, supermarkets, and mega-markets for all racial and ethnic subpopulations.22,23
and Hong Kong and, most recently, by domestic clones of these stores.28,30Yet, this major market looms large for all global food retailers.
In Africa, growth in the retail sector has emanated more from South African chains that moved into urban centers on both sides of the continent.10,31
In 2 separate studies, my colleagues and I docu-mented the components of the Mexican and Chinese diets that came from packaged and processed food. In both cases, we used 24-hour recall surveys – the 2012 National Nutrition Survey (ENSANUT) for Mexico and the 2011 China Health and Nutrition Survey for China.4,12In each survey, we asked whether each food consumed came from a wrapped package or a con-tainer. In China in 2015, we went a step further and scanned the barcodes of all the food items in each household’s food storage facilities (unpublished data).
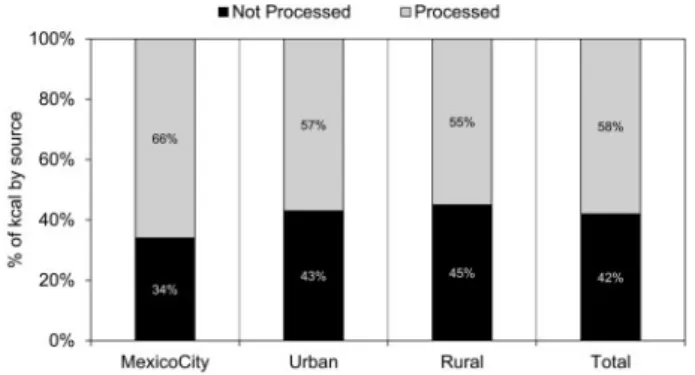
Figure 1 shows that in China in 2012, 30% of all food consumed came from packaged and processed food. The sample for that survey represented 12 prov-inces (containing about 50% of the country’s popula-tion). Figure 2 shows that in Mexico in 2011 a much larger proportion of packaged and processed food was consumed, with 58% of all kilocalories per capita per day coming from these food types. In both studies, higher percentages of packaged and processed food consumption were found in the most urbanized cities.
Having identified that consumption of packaged and processed foods has become more common, we now explore the more contentious question: What is the composition of this packaged and processed food, and is it healthful?
THE MODERN PACKAGED AND PROCESSED FOOD SUPPLY: WHAT DO WE KNOW?
There is a great deal of controversy about what people should eat. On one side are many who promote only so-called “real food,” encapsulated by Michael Pollan’s famous quotes: “Eat food, not too much, mostly plants”32 and “Don’t eat anything your great-grandmother wouldn’t recognize as food.” Scholars like Monteiro have promoted a similar diet, as seen in the Brazilian food guidelines.33 The Pan American Health Organization has adopted an approach to food labeling and diet promotion that is essentially based on Monteiro’s approach to food processing, with the idea of reducing what he called ultra-processed foods from the diet.34 The basic argument of Monteiro, Pollan, and many others is that we need to return to a diet based only on basic, unprocessed, or minimally processed food (such as flour and milk). For Brazil, a diet based on Monteiro’s philosophy would derive from a period in which the foods typically consumed
were rice, beans, some fish and animal-source foods, and some fruit and vegetables. Is this realistic, or is this romanticism based on an earlier reality? Furthermore, within the modern food supply, which is highlighted below, can we turn back the clock and move to this type of diet, or do we need to work to get a more healthful supply of packaged and pro-cessed food while also promoting increased cooking and use of basic foods?
The Global Food Research Program at the University of North Carolina is working with data sets of scanned food purchases for several countries. The segment on which my colleagues and I have focused particular attention is packaged and processed food for the United States. Jennifer Poti has essentially used product descriptions and ingredients to categorize 1.2 million unique packaged and processed foods from 2000 to 2012 into a food system quite comparable to Monteiro’s.2,3 In addition to noting the degree of pro-cessing, she also categorized food by convenience, in both cases based on detailed descriptors of each food and their ingredients. Both this system and Monteiro’s are different from the International Food Information
Figure 1Percentage of foods in China prepared at home, in restaurants, or prepackaged in 2011.Reproduced from Popkin (2014)4with permission.
Council approach, which has been adopted by the American Society for Nutrition and other organiza-tions.16,17 These groups use a more simplistic way of categorizing foods and have not gone deeply into prod-uct composition or ingredients.
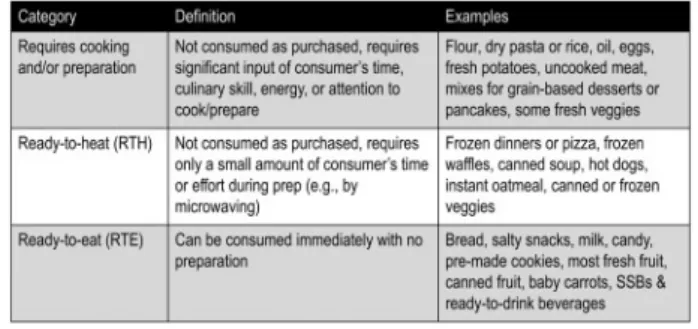
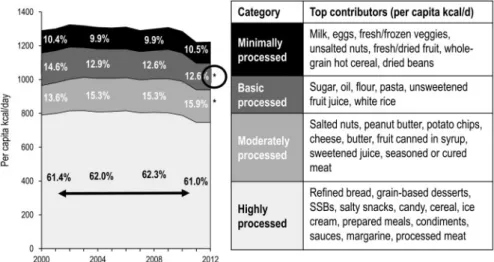
Figures 3and 4show the Poti method of categor-ization, which is based on the total packaged food sup-ply of 1.4 million unique barcoded products and uses product descriptors, ingredients, and other data to cat-egorize them.3,35Except for terminology (eg, Poti uses the term “highly processed” rather than “ultra-pro-cessed”), it is quite similar to the Monteiro system.14,36 What is important to notice are the final 2 categories, highly (or ultra-) processed ingredients and highly pro-cessed foods. Much controversy revolves around whether these foods can be manufactured in a way that would be deemed healthful.
Figure 5 shows that in a nationally representative longitudinal sample of US households, processed and ultra-processed foods dominated purchasing patterns by collectively providing over 75% of calories. The ultra-processed foods, which tend to be significantly higher in sodium, saturated fat, and total sugar, repre-sented consistently more than 60% of all food purchases among the packaged and processed foods.37
Figure 6 categorizes these foods and beverages by level of convenience. Most important, over 80% of cal-ories purchased were ready-to-eat or ready-to-heat products. The first Poti paper2 describes how conveni-ence was categorized, and the figure provides a good sense of these patterns, which did not change much over the 2000–2012 period.
Most of the negative focus on food processing by journalists and scholars has focused on highly or ultra-processed food15,34,36,38however, others are pushing for a greater shift from processed foods of all types toward real food, with the exception of classic methods of freez-ing, fermentation, and other types of minimal process-ing in order to preserve food and reduce food waste. Critical questions that are not addressed by these
groups are the degree of processing, beyond minimal processing, that is necessary to save food from spoilage and waste, and if it is possible to transform a highly processed food supply into one that is both healthy and plentiful. In contrast, other organizations, including some that receive extensive food industry funding have been less critical of food processing.16,17 But there are many unanswered questions about the current and potential healthfulness of highly pro-cessed foods. The missing element in the current re-search is clinical trials that compare ad libitum real foods-based diets with some version of diets containing highly or ultra-processed food that would be deemed healthful. If the objective is to have a greater proportion of food containing whole grains instead of refined grains, then the resulting food would be defined as moderately processed instead of ultra-processed. I expect this debate will continue, but aside from the lim-ited promotion by governments and nonprofit organ-izations to eat more fruits and vegetables, the world seems to be increasing its consumption of ultra-processed food. Discussed below are the various types of regulations and taxes that some countries are imple-menting to reduce intake of the least healthy food and beverage products – those higher in added sugar, so-dium, and saturated fats. This is particularly important since the Pan American Organization has come out very strongly against all ultra-processed food and calls for nations in the region to tax, ban marketing of, and attempt to remove these foods from their food supply.34
GLOBAL DIET, BODY COMPOSITION, AND NUTRITION-RELATED NCDS
Over the past several years, there have been some highly publicized meta-analyses related to consumption of cer-tain components of the global diet, such as the recent push against sugar.39–41 Similarly, there have been re-views on obesity and overweight prevalence, studies on trends in overweight and obesity, and several on NCDs
Figure 3 Classifications system for degree of processing of food and beverage products.Data from Poti et al. (2015).2
related to these conditions.42There is little value in re-peating discussion of the vast changes in diets,43body composition, or nutrition-related NCDs, but I want to emphasize a few puzzles related to body composition.
Global shifts in diets
Mozaffarian and colleagues have used a compilation of individual dietary surveys of varying quality and representativeness from across the globe to provide a careful global review of sugar-sweetened beverages (SSBs), fruit juices and milk, fats and oils, and dietary quality.43–46 A recent review looked at sodium in-creases globally based on dietary and urinary sodium excretion studies.47Our work and in-depth studies by others in China, Brazil, Mexico, and elsewhere show growth in the levels of consumption of nonessential foods containing excessive added sugars, added salt,
refined carbohydrates (namely, SSBs), grain-based desserts, and savory snacks.48–52
In a separate review of recent trends in SSB sales with identical sales data, it was shown that SSB con-sumption is going down in select high-income coun-tries and regions and increasing in most low- and middle-income countries (LMIC) and regions.53
Two major shifts in diet are of particular concern for global sustainability: (1) the shift toward accelerating consumption of animal-source food in LMICs while higher income countries have barely reduced their sumption of these products and (2) the increase in con-sumption of ultra-processed food. To date, there is an extensive body of literature on the changes in animal-source food intake and the effects this is having on cli-mate emissions, water use, and antibiotics in our water supply, so these issues are not addressed here.54–59 However, there is really no study that has attempted to
Figure 5Trends in food and beverage CPG purchases by degree of processing.Data from Poti et al. (2015).2
establish the global sustainability footprint for pack-aged, highly processed food. Many companies have worked to reduce both water and energy use at their factories in attempts to reduce their overall environ-mental footprint; however, tracking the entire system from farm to fork for one food product let alone the en-tire set of processed food products has not been done.
The global dietary shifts examined here have not occurred in a vacuum. The roles of supply and demand are terribly complex; however, one of the themes ad-dressed here is that of the diminishing role of govern-ment in food systems due to the shift in influence of farm production from governments to retailers, food manufacturers, agribusinesses, and food service chains. At the same time, there is great documentation of the impact that modern marketing, peer pressure, and con-venience is having on our diets.60–67 Those issues are not addressed here.
Body composition
Many studies have documented large increases in the proportion of people who are overweight and obese.68–70 Some of these have shown that body mass index (BMI) levels have increased among the obese. That is, the entire distribution of BMIs among those called obese with a BMI30 have shifted rightward.71 What is most per-plexing is that among individuals with normal and over-weight BMI levels that remained the same we have seen an increase in waist circumference. This has been observed in data from the few LMICs and high-income countries where nationally representative repeated sur-veys collected this information along with weight and height data.71–73
While I do not want to discuss the relative merits of various measures of body composition,74,75it is im-portant to remember that current BMI guidelines that delineate cutoffs of 25 and 30 for overweight and obes-ity, respectively, are inappropriate cutoffs for the cardi-ometabolic outcome risks faced by many populations. Hispanics, Asians, and many other subpopulations across the globe have very different distributions of fat, different genetic predispositions to disease, and face many nutrition and health conditions going back to pregnancy and infancy. All of this means that, for many, the risks of diabetes, hypertension, and other dis-eases rises at BMI levels of 20–23 and not 25 and 30.76–80 There is much speculation related to dietary changes and shifts in physical activity that might ex-plain the observed increases in waist circumference, but there is so little research on it that we cannot highlight a clear cause with any confidence. Is it the excess sugar and fructose consumed, with their linkage with visceral
fat?81–89 Diets with a high glycemic index have been linked to a greater accumulation of abdominal fat.30
Non-communicable diseases
In general, in all LMICs, the proportion of deaths, disabilities, and years lived with disability have increased.90 NCDs have risen generally over the last several decades, but particularly in LMICs.42Diabetes and hypertension seem to be the first diseases to emerge in most of the Asian, African, and Latin American countries, which get clear publicity and lead to regulatory actions.91
While the focus of my own work is obesity and obesity-related NCDs, more recent research suggests that many health problems related to poor infant feed-ing practices may be linked to these same food supply shifts. Documentation presently indicates that large proportions of infants are fed SSBs, savory snacks, and many other types of highly processed nutrient-poor foods, even in the first 6 month of life.92–94
GOVERNMENT ACTIONS TO IMPROVE DIETS
Most government efforts have focused around 4 activ-ities: (1) taxation of SSBs and other broader categories of nonessential or junk foods, (2) marketing control with much of the focus on marketing to children, (3) front-of-package labeling profiles with a positive or negative logo, (4) special regulations related to schools and/or other government facilities.
There are excellent resources where one can see the full list of actions taken by various levels of gov-ernment around the world.95 The “Nourishing Framework” section of the World Cancer Research Fund International website is, by far, the most up-to-date resource.96
dynamics, and usual dietary intake over the full first year of the Berkeley tax.
The following countries are also worth highlighting for their unique efforts.
Mexico.Mexico was the first LMIC to pass a reasonably high SSB tax of about 10%. They also passed a nones-sential food tax of 8% on much of what might be called junk food. Rigorous evaluations that looked at how the taxes shifted trends in consumption of these products and their substitutes have been undertaken by a joint National Institute of Public Health (Mexico) and University of North Carolina team. First, the evalua-tions showed that the taxes were passed through to con-sumers.99Using detailed household food purchase data representing urban Mexico, the researchers found sig-nificant declines in purchases for these taxed beverages, with great negative purchasing effects on lower socioe-conomic status households.100,101 The impact of this same tax in year 2 will be forthcoming.102
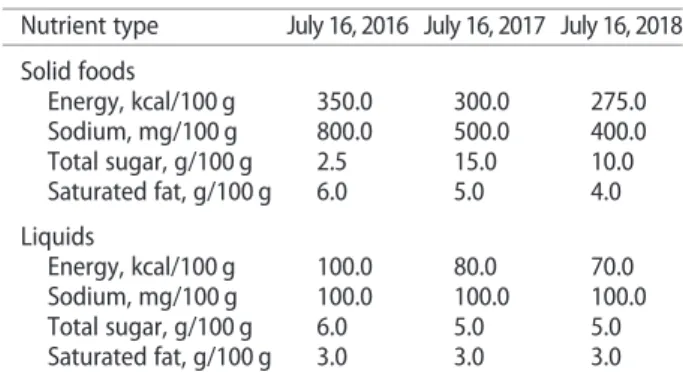
Chile.Officially now a higher income country, Chile has instituted a series of laws and continues to prepare for new ones. This government truly wants to improve diets and reduce the very high levels of obesity and NCDs. As a first step, they increased their value-added tax on SSBs by 5% and reduced the tax on other bever-ages by 3%. That change is currently being evaluated by the Global Food Research Program in cooperation with colleagues from the Institute of Nutrition and Food Technology, University of Chile. Second, Chile began a very comprehensive marketing law applying to all foods and beverages deemed unhealthful. They are imple-menting that law in 3 stages (seeTable 1). This country is also planning to implement a law that will forbid most advertising of the same food and beverage products deemed unhealthful in all media from 6 am to 10 pm.
Colombia and South Africa.Both of these countries are in the midst of serious consideration of implementing taxes of 18% and 20%, respectively, on SSBs. In each country, the Ministries of Health and of Finance sup-port the taxes and the government backs the tax as a critical step towards addressing obesity, diabetes, and other cardiometabolic problems linked with excessive SSB consumption. Both measures face strong industry opposition but, thus far, the governments remain sup-portive of implementing the taxes.
Thailand. Thailand has adopted a front-of-package-label similar to the Choices International logo under the name “Healthier Choice.” This is similar to the Healthy Choices program Singapore has used for decades, but it
initially covers a limited subset of foods and beverages deemed most unhealthy.103
Pacific Islands. Thirteen islands have adopted various levels of SSB taxes over the past decade.104 No evalua-tion of these taxes has been conducted to date.
Many countries have initiated revisions of school food programs to increase their healthfulness and reduce consumption of SSBs and junk food. The most innovative school food program in Brazil has yet to be evaluated. Brazil passed a law requiring that 30% of the food served in schools be real food purchased from local farmers and an additional 40% of the food to be mini-mally processed.105,106
SUSTAINABLE DEVELOPMENT GOALS AND THE MODERN DIET
The new Sustainable Development Goals (SDGs), which were adopted by most countries in a United Nations consensus, have paid limited attention to nutrition and NCDs.107One of the 169 proposed targets of the SDGs is to reduce premature deaths from NCDs by 1=3; another is to end malnutrition in all forms. The remark-able transformation of food systems across the LMICs of the world stands in stark contrast to the goals of the SDGs. The transformation to modern food systems began in the period following World War II with poli-cies designed to meet a very different set of nutritional and food needs and continued with globalization in the 1990s and beyond. There are huge challenges and knowledge gaps in 2 areas. The first is that no country has truly attempted to create programs to significantly reduce animal-source food consumption with its immense environmental footprint not only on carbon emissions but also water, fertilizer, and the use of anti-biotics and pesticides. An even bigger gap exists in our knowledge of the environmental impact of packaged, processed foods and beverages. Creating a sustainable
Table 1Nutrient limits and implementation dates for front-of-package logo requirements and marketing bans in Chile
Nutrient type July 16, 2016 July 16, 2017 July 16, 2018
Solid foods
Energy, kcal/100 g 350.0 300.0 275.0 Sodium, mg/100 g 800.0 500.0 400.0 Total sugar, g/100 g 2.5 15.0 10.0 Saturated fat, g/100 g 6.0 5.0 4.0
Liquids
diet requires a much greater effort aimed at reducing our intake, particularly of beef and milk. It also requires greater effort to fill existing research gaps and then to create policies around the issues that are identified as affecting the sustainability of our modern diet. It is my opinion that we all must work hard to meet the SDGs, and this will involve all countries seriously considering ways to address the harmful effects that the modern diet and the underlying food system are having on health. This is indeed the challenge facing populations across the world.
Acknowledgments
The following individuals are thanked for their assis-tance: Dr Phil Bardsley and Dr Donna Miles for excep-tional assistance with the data management, Dr Jennifer Poti for providing several of the figures and many dis-cussions regarding food processing, Mrs Frances D. Burton for administrative assistance, and Ms Denise Ammons for graphics support.
Funding. This author’s work is supported by the National Institutes of Health (grant numbers R01DK108148, DK098072; DK56350, HD30880), the Bloomberg Philanthropies, and the Carolina Population Center and its NIH Center grant (P2C HD0550924). None of the funders had a direct role in the design, analysis, or preparation of this work.
Declaration of interest.The author has no relevant inter-ests to declare.
REFERENCES
1. Smith LP, Ng SW, Popkin BM. Resistant to the recession: US adults maintain cooking and away-from-home eating patterns during times of economic turbu-lence. Am J Public Health. 2014;104:840–846.
2. Poti JM, Mendez MA, Ng SW, et al. Is the degree of food processing and conven-ience linked with the nutritional quality of foods purchased by US households? Am J Clin Nutr. 2015;99:162–171.
3. Poti JM, Mendez MA, Ng SW, et al. Highly processed and ready-to-eat packaged food and beverage purchases differ by race/ethnicity among US households. J Nutr. 2016;46:1722–1730
4. Popkin BM. Nutrition, agriculture and the global food system in low and middle income countries. Food Policy. 2014;47:91–96.
5. Babu SC, Blom S. Building capacity for resilient food systems. In: S Fan, R Pandya-Lorch, S Yosef, eds, Resilience for Food and Nutrition Security. Washington, DC: International Food Policy Research Institute. 2014:119–226.
6. Ericksen P, Stewart B, Dixon J, et al. The value of a food system approach. In: J Ingram, P Ericksen, D Liverman, eds. Food Security and Global Environmental Change. London: Earthscan; 2014:25–45.
7. Hawkes C. Identifying inovative interventions to promote healthy eating using consumption-oriented food supply chain analysis. J Hunger Environ Nutr. 2009;4:336–356.
8. Reardon T, Timmer CP, Minten B. Supermarket revolution in Asia and emerging development strategies to include small farmers. Proc Natl Acad Sci. 2012;109:12332–12337.
9. Reardon T, Timmer CP. The economics of the food system revolution. Ann Rev Resource Econ. 2012;4:225–264.
10. Reardon T, Timmer CP, Barrett CB, et al. The rise of supermarkets in Africa, Asia, and Latin America. Am J Agr Econ. 2003;85:1140–1146.
11. Reardon T, Berdegue´ J. The rapid rise of supermarkets in Latin America: chal-lenges and opportunities for development. Dev Policy Rev. 2002;20:371–388. 12. Zhou Y, Du S, Su C, et al. The food retail revolution in China and its association
with diet and health. Food Policy. 2015;55:92–100.
13. Smith LP, Ng SW, Popkin BM. Resistant to the recession: US adults maintain cooking and away-from-home eating patterns during times of economic turbu-lence. Am J Public Health. 2014;104: 840–846.
14. Monteiro CA, Levy RB, Claro RM, et al. Increasing consumption of ultra-processed foods and likely impact on human health: evidence from Brazil. Public Health Nutr. 2011;14:5–13.
15. Monteiro C. The big issue is ultra-processing [commentary]. World Nutr. 2010;1:237–269.
16. Eicher-Miller HA, Fulgoni VL, Keast DR. Contributions of processed foods to diet-ary intake in the US from 2003–2008: a report of the Food and Nutrition Science Solutions Joint Task Force of the Academy of Nutrition and Dietetics, American Society for Nutrition, Institute of Food Technologists, and International Food Information Council. J Nutr. 2012;142(Suppl):2065S–2072S.
17. Dwyer JT, Fulgoni VL, Clemens RA, et al. Is “Processed” a four-letter word? The role of processed foods in achieving dietary guidelines and nutrient recommen-dations. Adv Nutr. 2012;3:536–548.
18. Botelho R, Araujo W, Pineli L. Food formulation and not processing level: concep-tual divergences between public health and food science and technology sec-tors. Critical Rev Food Sci Nutr. 2016;doi:10.1080/10408398.10402016.11209159. 19. Levinson M. The Great A&P and the Struggle for Small Business in America. New
York, New York: Macmillan; 2011.
20. Walsh WI. The Rise and Decline of the Great Atlantic & Pacific Tea Company. Fort Lee, New Jersey: Lyle Stuart; 1986.
21. Walton S, Huey J. Sam Walton, Made in America: My Story. New York, New York: Bantam; 1993.
22. Stern D, Poti JM, Ng SW, et al. Where people shop is not associated with the nutrient quality of packaged foods for any racial-ethnic group in the United States. Am J Clin Nutr. 2016;103:1125–1134.
23. Stern D, Robinson WR, Ng SW, et al. US household food shopping patterns: dynamic shifts since 2000 and socioeconomic predictors. Health Aff. 2015;34:1840–1848.
24. Reardon T, Berdegue JA. The rapid rise of supermarkets in Latin America: chal-lenges and opportunities for development. Dev Policy Rev. 2002;20:371–388. 25. Reardon T, Chen KZ, Minten B, et al. The quiet revolution in Asia’s rice value
chains. Ann NY Acad Sci. 2014;1331:106–118.
26. Reardon T, Barrett CB, Berdegue´ JA, et al. Agrifood industry transformation and small farmers in developing countries. World Dev. 2009;37:1717–1727. 27. Wang H, Dong X, Rozelle S, et al. Producing and procuring horticultural crops
with Chinese characteristics: The case of Northern China. World Dev. 2009;37:1791–1801.
28. Zhang QF, Pan Z. The transformation of urban vegetable retail in China: wet mar-kets, supermarkets and informal markets in Shanghai. J Contemporary Asia. 2013;43:497–518.
29. Garnett T, Wilkes A. Appetite for Change: Social, Economic and Environmental Transformations in China’s Food System. Oxford, UK: Food Climate Research Network; 2014.
30. Hu D, Reardon T, Rozelle S, et al. The emergence of supermarkets with Chinese characteristics: challenges and opportunities for China’s agricultural develop-ment. Dev Policy Rev. 2004;22:557–586.
31. Tschirley D, Reardon T, Dolislager M, et al. The rise of a middle class in East and Southern Africa: implications for food system transformation. J Int Dev. 2015;27:628–646.
32. Pollan M. In Defense of Food: An Eater’s Manifesto. New York, NY: Penguin Press; 2008.
33. Dietary Guidelines for the Brazilian Population, 2nd edn. Brasilia: Brazil Ministry of Health, Secretariat of Health Care Primary Health Care Department; 2014:152. 34. Pan American Health Organization. Pan American Health Organization Nutrient
Profile Model. Washington, DC: PAHO; 2016:32.
35. Poti JM, Mendez MA, Ng SW, et al. Is the degree of food processing and conven-ience linked with the nutritional quality of foods purchased by US households? Am J Clin Nutr. 2015;99:162–171.
36. Monteiro CA, Moubarac JC, Cannon G, et al. Ultra-processed products are becom-ing dominant in the global food system. Obes Rev. 2013;14:21–28.
37. Smith Tallie L, Poti JM. Associations of cooking with dietary intake and obesity among Supplemental Nutrition Assistance Program participants. Am J Prev Med. In Press.
38. Monteiro C, Gomes F, Cannon G. The snack attack. Am J Public Health. 2010;100:975–981.
40. World Cancer Research Fund International. Curbing Global Sugar Consumption: Effective Food Policy Actions to Help Promote Healthy Diets and Tackle Obesity’. 2015. Available at: http://www.wcrf.org/int/policy/our-policy-work/curbing-global-sugar-consumption. Accessed December 18, 2016
41. Johnson RK, Appel LJ, Brands M, et al. Dietary sugars intake and cardiovascular health: a scientific statement from the American Heart Association. Circulation. 2009;120:1011–1020.
42. Kwan GF, Mayosi BM, Mocumbi AO, et al. Endemic cardiovascular diseases of the poorest billion. Circulation. 2016;133:2561–2575.
43. Singh GM, Micha R, Khatibzadeh S, et al. Global, regional, and national consump-tion of sugar-sweetened beverages, fruit juices, and milk: a systematic assess-ment of beverage intake in 187 countries. PLoS ONE. 2015;10:e0124845. 44. Singh GM, Micha R, Khatibzadeh S, et al. Estimated global, regional, and national
disease burdens related to sugar-sweetened beverage consumption in 2010. Circulation. 2015;doi:10.1161/CIRCULATIONAHA.1114.010636.
45. Imamura F, Micha R, Khatibzadeh S, et al. Dietary quality among men and women in 187 countries in 1990 and 2010: a systematic assessment. Lancet Global Health. 2015;3:e132–e142.
46. Micha R, Khatibzadeh S, Shi P, et al. Global, regional, and national consumption levels of dietary fats and oils in 1990 and 2010: a systematic analysis including 266 country-specific nutrition surveys. BMJ. 2014;348:g2272.
47. Powles J, Fahimi S, Micha R, et al. Global, regional and national sodium intakes in 1990 and 2010: a systematic analysis of 24 h urinary sodium excretion and diet-ary surveys worldwide. BMJ Open. 2013;3:e003733.
48. Stern D, Piernas C, Barquera S, et al. Caloric beverages were major sources of energy among children and adults in Mexico, 1999–2012. J Nutr. 2014;144:949–956.
49. Zhai FY, Du SF, Wang ZH, et al. Dynamics of the Chinese diet and the role of urbanicity, 1991–2011. Obes Rev. 2014;15:16–26.
50. Du SF, Wang HJ, Zhang B, et al. China in the period of transition from scarcity and extensive undernutrition to emerging nutrition-related non-communicable diseases, 1949–1992. Obes Rev. 2014;15:8–15.
51. Pereira R, Souza A, Duffey K, et al. Beverages consumption in Brazil: Results from the first national dietary survey. Public Health Nutr. 2015;18:1164–1172. 52. Pereira RA, Duffey KJ, Sichieri R, et al. Sources of excessive saturated fat, trans fat
and sugar consumption in Brazil: an analysis of the first Brazilian nationwide indi-vidual dietary survey. Public Health Nutr. 2014;17:113–121.
53. Popkin BM, Hawkes C. Sweetening of the global diet, particularly beverages: pat-terns, trends, and policy responses. Lancet Diabetes Endocrinol. 2016;4:174–186. 54. Anand SS, Hawkes C, de Souza RJ, et al. Food consumption and its impact on car-diovascular disease: importance of solutions focused on the globalized food sys-tem a report from the Workshop convened by the World Heart Federation. J Am Coll Cardiol. 2015;66:1590–1614.
55. Delgado CL. Rising consumption of meat and milk in developing countries has created a new food revolution. J Nutr. 2003;133(Suppl 2):3907S–3910S. 56. Food and Agriculture Organization of the United Nations. Livestock’s Long
Shadow: Environmental Issues and Options. Rome, Italy:. Food and Agriculture Organization of the United Nations; 2007.
57. Weis T. The Ecological Hoofprint: The Global Burden of Industrial Livestock. London: Zed Books; 2013.
58. Zhai FY, Du SF, Wang ZH, et al. Dynamics of the Chinese diet and the role of urbanicity, 1991–2011. Obes Rev. 2014;15:16–26.
59. Landers TF, Cohen B, Wittum TE, et al. A review of antibiotic use in food animals: perspective, policy, and potential. Public Health Rep. 2012;127:4–22. 60. Common Sense Media. Advertising to Children and Teens: Current Practices.
2014. Available at: https://www.commonsensemedia.org/research/advertising-to-children-and-teens-current-practices. Accessed on December 21, 2016. 61. Montgomery KC, Chester J. Interactive food and beverage marketing: targeting
adolescents in the digital age. J Adolesc Health. 2009;45(Suppl):S18–S29. 62. Cheyne AD, Dorfman L, Bukofzer E, Harris JL. Marketing sugary cereals to
chil-dren in the digital age: a content analysis of 17 child-targeted websites. J Health Commun. 2013;18:563–582.
63. McGinnis JM, Gootman JA, Kraak VI. Food marketing to children and youth: threat or opportunity?: National Academies Press; 2006.
64. Palmer E, Carpenter C. Food and Beverage Marketing to Children and Youth: Trends and Issues. Media Psychology. 2006;8:165–190.
65. Federal Trade Commission. A Review of Food Marketing to Children and Adolescents: Follow-Up Report. 2012. Available at: https://www.ftc.gov/sites/ default/files/documents/reports/review-food-marketing-children-and-adolescents-follow-report/121221foodmarketingreport.pdf. Accessed on December 21, 2016. 66. Harris JL, Pomeranz JL, Lobstein T, Brownell KD. A crisis in the marketplace: how
food marketing contributes to childhood obesity and what can be done. Annu Rev Public Health. 2009;30:211–225.
67. Cairns G, Angus K, Hastings G, Caraher M. Systematic reviews of the evidence on the nature, extent and effects of food marketing to children. A retrospective summary. Appetite. 2013;62:209–215.
68. Ng M, Fleming T, Robinson M, et al. Global, regional, and national prevalence of overweight and obesity in children and adults during 1980–2013: a systematic analysis for the Global Burden of Disease Study 2013. Lancet. 2014:384:766–781
69. Jaacks LM, Slining MM, Popkin BM. Recent trends in the prevalence of under-and overweight among adolescent girls in low- under-and middle-income countries. Pediatr Obes. 2015;10:428–435.
70. Jaacks LM, Slining MM, Popkin BM. Recent underweight and overweight trends by rural–urban residence among women in low- and middle-income countries. J Nutr. 2015;145:352–357.
71. Popkin BM, Slining MM. New dynamics in global obesity facing low- and middle-income countries. Obes Rev. 2013;14:11–20.
72. Albrecht SS, Gordon-Larsen P, Stern D, et al. Is waist circumference per body mass index rising differentially across the United States, England, China and Mexico? Eur J Clin Nutr. 2015;69:1306–1312.
73. Albrecht SS, Barquera S, Popkin BM. Exploring secular changes in the association between BMI and waist circumference in Mexican-Origin and white women: a comparison of Mexico and the United States. Am J Hum Biol. 2014;26:627–634. 74. World Health Organization. BMI Classification. 2006. Updated 2016. Available at:
http://apps.who.int/bmi/index.jsp?introPage¼intro_3.html. Accessed on December 18, 2016.
75. World Health Organization. Physical Status: The Use and Interpretation of Anthopometry: Report of a WHO Expert Committee. Geneva, Switzerland: World Health Organization; 1995.
76. Albrecht S, Mayer-Davis B, Popkin B. The association with BMI and diabetes and pre-diabetes in US adults: an examination of secular and race/ethnic trends. Diabetes/Metabolism Res Rev. In Press.
77. Wells JC, Pomeroy E, Walimbe SR, et al. The elevated susceptibility to diabetes in India: an evolutionary perspective. Front Public Health. 2016;4:45.
78. Popkin BM, Adair LS, Ng SW. Global nutrition transition and the pandemic of obesity in developing countries. Nutr Rev. 2012;70:3–21.
79. World Health Organization Expert Consultation. Appropriate body-mass index for Asian populations and its implications for policy and intervention strategies. Lancet. 2004;363:157–163.
80. Colin Bell A, Adair LS, Popkin BM. Ethnic differences in the association between body mass index and hypertension. Am J Epidemiol. 2002;155:346–353. 81. Stanhope KL. Sugar consumption, metabolic disease and obesity: the state of
the controversy. Crit Rev Clin Lab Sci. 2016;53:52–67.
82. Stanhope KL. Role of fructose-containing sugars in the epidemics of obesity and metabolic syndrome. Annu Rev Med. 2012;63:329–343.
83. Stanhope KL, Griffen SC, Bremer AA, et al. Metabolic responses to prolonged consumption of glucose- and fructose-sweetened beverages are not associated with postprandial or 24-h glucose and insulin excursions. Am J Clin Nutr. 2011;94:112–119.
84. Bray GA, Popkin BM. Dietary sugar and body weight: have we reached a crisis in the epidemic of obesity and diabetes?: Health be damned! Pour on the sugar. Diabetes Care. 2014;37:950–956.
85. Stephan BC, Wells JC, Brayne C, et al. Increased fructose intake as a risk factor for dementia. J Gerontol A Biol Sci Med Sci. 2010;65:809–814.
86. Bray GA. Fructose: pure, white, and deadly? Fructose, by any other name, is a health hazard. J Diabetes Sci Technol. 2010;4:1003–1007.
87. Bray GA. Fructose: should we worry? Int J Obes. 2008;32 (Suppl 7):S127–S131. 88. Lustig RH. Fructose: It’s “alcohol without the buzz”. Adv Nutr. 2013;4:226–235. 89. Lustig RH, Mulligan K, Noworolski SM, et al. Isocaloric fructose restriction and
metabolic improvement in children with obesity and metabolic syndrome. Obesity. 2016;24:453–460.
90. Vos T, Flaxman AD, Naghavi M, et al. Years lived with disability (YLDs) for 1160 sequelae of 289 diseases and injuries 1990–2010: a systematic analysis for the Global Burden of Disease Study 2010. Lancet. 2012;380:2163–2196.
91. World Health Organization. Global Action Plan for the Prevention and Control of NCDs 2013–2020. Geneva, Switzerland: World Health Organization; 2013:55. 92. Pries AM, Huffman SL, Mengkheang K, et al. High use of commercial food
prod-ucts among infants and young children and promotions for these prodprod-ucts in Cambodia. Matern Child Nutr. 2016;12:52–63.
93. Pries AM, Huffman SL, Adhikary I, et al. High consumption of commercial food products among children less than 24 months of age and product promotion in Kathmandu Valley, Nepal. Matern Child Nutr. 2016;12:22–37.
94. Feeley AB, Ndeye Coly A, Sy Gueye NY, et al. Promotion and consumption of commercially produced foods among children: situation analysis in an urban set-ting in Senegal. Matern Child Nutr. 2016;12:64–76.
95. Hawkes C, Jewell J, Allen K. A food policy package for healthy diets and the pre-vention of obesity and diet-related non-communicable diseases: the NOURISHING framework. Obes Rev. 2013;14:159–168.
96. World Cancer Research Fund International. Nourishing framework. Available at: http://www.wcrf.org/int/policy/nourishing-framework. Accessed on December 18, 2016.
97. Falbe J, Thompson HR, Becker CM, et al. Impact of the Berkeley excise tax on sugar-sweetened beverage consumption. Am J Public Health. 2016;106:1865–1871.
99. Colchero MA, Salgado JC, Unar-Munguıa M, et al. Changes in prices after an excise tax to sweetened sugar beverages was implemented in Mexico: evidence from urban areas. PLoS ONE. 2015;10:e0144408.
100. Colchero MA, Popkin BM, Rivera JA, et al. Beverage purchases from stores in Mexico under the excise tax on sugar sweetened beverages: observational study. BMJ. 2016;352:h6704.
101. Batis C, Rivera JA, Popkin BM, et al. First-year evaluation of Mexico’s tax on nones-sential energy-dense foods: an observational study. PLoS Med. 2016;13:e1002057. 102. Colchero MA, Rivera JA, Popkin BM, et al. Sustained consumer response:
evi-dence two-years after implementing the sugar-sweetened beverage tax in Mexico. Health Aff. In Press.
103. Foo LL, Vijaya K, Sloan RA, et al. Obesity prevention and management: Singapore’s experience. Obes Rev. 2013;14:106–113.
104. Snowdon W, Thow AM. Trade policy and obesity prevention: challenges and innovation in the Pacific Islands. Obes Rev. 2013;14:150–158.
105. Jaime PC, da Silva ACF, Gentil PC, et al. Brazilian obesity prevention and control initiatives. Obes Rev. 2013;14:88–95.
106. Coitinho D, Monteiro CA, Popkin BM. What Brazil is doing to promote healthy diets and active lifestyles. Public Health Nutr. 2002;5:263–267.