ISSN 2307-7743 http://scienceasia.asia
_______________
2010 Mathematics Subject Classification: 97D60.
Key words and phrases: Factor analysis, Principal component method, Regression, Correlation, Factor, Mathematics performance.
©2015 Science Asia 1 / 11 MODELING FACTORS INFLUENCING MATHEMATICS LEARNING AND
PERFORMANCE IN TANZANIAN SECONDARY SCHOOLS
JUSTIN KISAKALI AND DMITRY KUZNETSOV
Abstract: The purpose of this study is to develop a factor model describing factors affecting mathematics performance in Tanzania’s secondary schools. The factors were first identified by first administering structured questionnaires to 520 secondary school students with designed variables therein. Factor analysis/principal component method was used to identify the underlying factors affecting students’ performance in mathematics. It was revealed that lack of interest while studying mathematics, triviality and lack of practice by students, lack of drive and enthusiasm for teachers and students, perception and attitude towards the subject terming it to be difficult and lack of qualified mathematics teachers are the main contributors towards mathematics performance. Principal component analysis revealed that, lack of interest and triviality in studying mathematics were the most significant factors to the performance of students in mathematics. The factor model explained 50.5% of the total variation of the students’ mathematics performance. Furthermore, multiple linear regression and correlation analysis were conducted on the factors identified. Multiple linear regression revealed that lack of interest while studying mathematics and triviality and lack of practice by students are the main contributors towards the students’ performance in mathematics. Correlation analysis revealed that lack of interest while studying mathematics and lack of qualified mathematics teachers correlated with all other factors.
1. Introduction
knowledge will always remain an important tool (Baroody, 1987; Köğce, Yıldız, Aydın, & Altındağ, 2009).
A report by NECTA (2013) on Basic Mathematics performance in the Tanzania national examination shows that performance in the subject has been deteriorating. A similar trend was exhibited in the 2014 Form Four National Examination where Basic mathematics faired poorly in comparison to other subjects (NECTA, 2014). A score below 30% in an examination in Tanzania secondary schools is regarded as a fail (Mtulya, 2014). According to Zaya (2014), only 17.8% of the students who sat for the National Form Four Examinations in 2013 passed mathematics. A pass rate of only 19.58% in mathematics was recorded for candidates who sat for the 2014 National Form Four Examinations (Kilonge, 2015). This is due to the fact that the students think that, mathematics is a difficult subject to understand (Veloo, Ali, & Krishnasamy, 2014). This had led students not understanding mathematical concepts which are being taught. Thus this paper seeks to examine factors contributing towards mathematics performance and subsequently model the identified factors to performance in Tanzania National secondary school mathematics examinations.
2. Methodology
2.1 Study area and data collection
The study was conducted in Arusha and Kilimanjaro regions of Tanzania. The study used primary data gathered using a structured student questionnaire. The questionnaire was divided into two sections. The first part had 4 items while the second section had 22 variables, with each variable being a statement in a 5-point Likert scale ranging from 1 representing strongly disagree to 5 for strongly agree. A mathematics test was conducted and scores were used in formulating a multiple linear regression model. Simple random sampling procedure was used to select secondary schools and students that participated in the study. Ten secondary schools were chosen randomly with a sample (N) of 520 secondary school students (257 boys and 263 girls). Students were chosen randomly from the following classes, Form Two, to Form Six. The questionnaires were distributed to the 520 secondary school students and all questionnaires were completed and returned. 2.2 Data Analysis
(2008) cited in Mutodi and Ngirande (2014), an instrument is reliable if it has the Cronbach Alpha Coefficient of above 0.70. Hence, the instrument and the variables therein were reliable and acceptable.
A correlation matrix was computed and the determinant was found to be 0.003. The determinant is above 0.00001 which indicates an absence of multicollinearity (Yong & Pearce, 2013). The Kaiser–Meyer–Olkin Measure of Sampling Adequacy (KMO) and Bartlett’s test of sphericity values were checked to determine if the data were suitable for factor analysis. The KMO value should be at least 0.5 for factor analysis to be conducted (Field, 2009). The Bartlett’s test of sphericity should be significant, that is, the probability, p, should be less than 0.005. The KMO value was found to be 0.801 which is above the acceptable limit. The Bartlett’s test of sphericity was found to be, 𝜒2(231) = 2912.125, 𝑝 = 0.000 and it is highly significant. Child, (2006) cited in Yong and Pearce (2013) argues that the KMO statistics for an individual variable should be checked by observing the diagonal of the Anti-Image Matrix. All the values of the Anti-Image Matrix were above 0.5 which allowed the inclusion of each variable in the factor analysis. This enabled extraction of distinct and reliable factors.
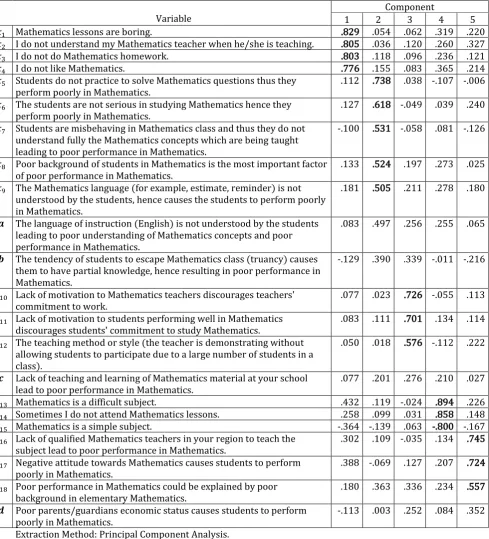
Factor analysis was conducted using Principal Component Method (Hamilton, 2008; Rencher, 2003). The aim of using the principal component method was to identify the underlying factors that affect the students’ mathematics performance. An oblique rotation (direct oblimin) was used to extract factors so as to allow the correlation between factors. An orthogonal rotation (varimax) was not appropriate because it did not produce a symmetrical component transformation matrix. The oblique rotation produced pattern matrix which contains factors (see Table 1). The pattern matrix was rotated to produce structure matrix which shows the correlations between variables and factors (see Table 2). The aim of factor rotation was to improve the interpretation of the factor model after getting a solution i
paper, we have used at least three variables with the factor loading at least 0.5 to denote a factor. Hence, five factors were extracted and named accordingly. The five factors explained 50.5% of the total variation of the students’ mathematics performance. The
factors were (where xi fori1,2,3,...,18 notate variables used in naming factors and
writing the factor model see Table 2)
Factor 1 (F1), include the variables 𝑥1, 𝑥2, 𝑥3 𝑎𝑛𝑑 𝑥4 and is named as lack of interest while studying mathematics.
Factor 2 (F2), include the variables 𝑥5, 𝑥6, 𝑥7, 𝑥8 𝑎𝑛𝑑 𝑥9 and is named as triviality and lack of practice by students.
Factor 3 (F3), include the variables 𝑥10, 𝑥11 𝑎𝑛𝑑 𝑥12 and is named as lack of drive and enthusiasm for teachers and students.
Factor 4 (F4), include the variables 𝑥13, 𝑥14 𝑎𝑛𝑑 𝑥15 and is named as perception and attitude towards the subject terming it to be difficult.
Factor 5(F5), include variables 𝑥16, 𝑥17 𝑎𝑛𝑑 𝑥18 and is named as lack of qualified mathematics teachers.
These five factors were used to build the factor model. However, the four variables named a, b, c and d (see Table 2) were excluded in the factor model because they did not have any significant correlations between these variables and the factors. Further analysis was done on the five factors, that is, multiple linear regression model and Pearson correlation model. The aim was to determine strengths and relationships among factors extracted.
3. Model development 3.1 Factor model
The following is the factor model that describes the factors that affect students’ performance in Mathematics in Arusha and Kilimanjaro regions.
30 . 0 0.22 0.32
0.06 0.05
0.83 1 2 3 4 5
1= F + F + F + F + F
x
32 . 0 0.33 0.26
0.12 0.04
0.81 1 2 3 4 5
2= F + F + F + F + F
x
34 . 0 0.12 0.24
0.10 0.12
0.80 1 2 3 4 5
3= F + F + F + F + F
x
37 . 0 0.21 0.37
0.08 0.16
0.78 1 2 3 4 5
4= F + F + F + F + F
x
38 . 0 0.01 0.11
0.04 0.74
0.11 1 2 3 4 5
5= F + F + F F F
52 . 0 0.24 0.04 0.05 0.62
0.13 1 2 3 4 5
6= F + F F + F + F
x 67 . 0 0.13 0.08 0.06 0.53
0.10 1 2 3 4 5
7= F + F F + F F
x 68 . 0 0.03 0.27 0.20 0.52
0.13 1 2 3 4 5
8= F + F + F + F + F
x 67 . 0 0.18 0.28 0.21 0.51
0.18 1 2 3 4 5
9= F + F + F + F + F
x 44 . 0 0.11 0.06 0.73 0.02
0.08 1 2 3 4 5
10= F + F + F F + F
x 50 . 0 0.11 0.13 0.70 0.11
0.08 1 2 3 4 5
11= F + F + F + F + F
x 61 . 0 0.22 0.11 0.58 0.02
0.05 1 2 3 4 5
12= F + F + F F + F
x 15 . 0 0.23 0.89 0.02 0.12
0.43 1 2 3 4 5
13= F + F F + F + F
x 26 . 0 0.15 0.86 0.03 0.10
0.26 1 2 3 4 5
14= F + F + F + F + F
x 32 . 0 0.17 0.80 0.06 0.14
0.36 1 2 3 4 5
15= F F + F F F
x 39 . 0 0.75 0.13 0.04 0.11
0.30 1 2 3 4 5
16= F + F F + F + F
x 41 . 0 0.72 0.21 0.13 0.07
0.39 1 2 3 4 5
17 = F F + F + F + F
x 51 . 0 0.56 0.23 0.34 0.36
0.18 1 2 3 4 5
18= F + F + F + F + F
x
3.2 Regression model
A multiple linear regression model was constructed using five factors extracted and it was used to determine the statistical significance of the effect of each factor to student performance in mathematics. The performance in the test administered (scores) was used as a dependent variable. Table 3 shows the variable names of factors and their description used in the regression and correlation models.
Table 3: Variable names and their descriptions
Variable name Description
LACKINT Lack of interest while studying mathematics. TRILACK Triviality and lack of practice by students.
LACKDRIV Lack of drive and enthusiasm for teachers and students.
PERCATT Perception and attitude towards the subject terming it to be difficult. LACKQUAL Lack of qualified mathematics teachers.
Two factors among the five were identified to have a significant effect on the mathematics performance. These factors were lack of interest while studying mathematics and triviality and lack of practice by students. Similar results were obtained by studies conducted by (Gitaari, Nyaga, Muthaa, & Reche, 2013; Mbugua, Kibet, Muthaa, & Nkonke, 2012). The model was significant at a significance level 0.05.
The multiple linear regression model formulated was
LACKQUAL PERCATT
+
LACKDRIV +
TRILACK +
LACKINT =
e Performanc
1.07 0.97
0.37 2.13
1.31 20.18
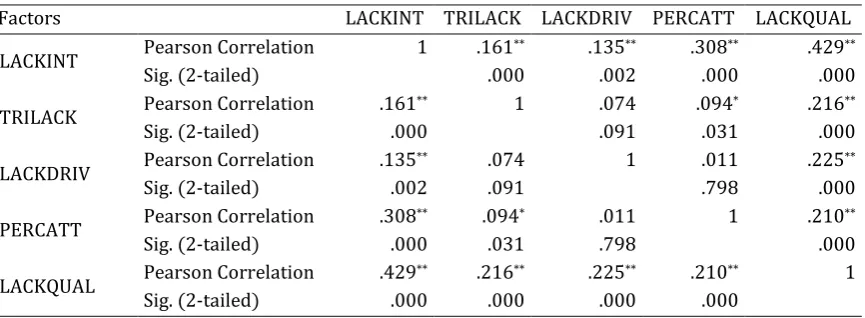
3.3 Correlation model
Correlation analysis was conducted to check the relationship between the factors extracted. Table 4 below shows the correlations between the factors.
Table 4: Correlations between factors (N = 520)
Factors LACKINT TRILACK LACKDRIV PERCATT LACKQUAL LACKINT Pearson Correlation 1 .161
** .135** .308** .429**
Sig. (2-tailed) .000 .002 .000 .000
TRILACK Pearson Correlation .161** 1 .074 .094* .216**
Sig. (2-tailed) .000 .091 .031 .000
LACKDRIV Pearson Correlation .135** .074 1 .011 .225**
Sig. (2-tailed) .002 .091 .798 .000
PERCATT Pearson Correlation .308** .094* .011 1 .210**
Sig. (2-tailed) .000 .031 .798 .000
LACKQUAL Pearson Correlation .429** .216** .225** .210** 1 Sig. (2-tailed) .000 .000 .000 .000
There are significant correlations between the first and all other factors, and the fifth and all other factors. There is a moderate relationship between lack of interest while studying mathematics and lack of qualified mathematics teachers. There is also a weak relationship between lack of interest while studying mathematics and the perception and attitude towards the subject terming it to be difficult (Al-Agili, Mamat, Abdullah, & Maad, 2012).
4. Conclusion and recommendations 4.1 Conclusion
Factor analysis modeling was used to describe factors affecting students’ performance in mathematics for secondary school students in Tanzania. The formulated model comprises of five factors with eighteen (18) equations. These factors are, lack of interest while studying mathematics, triviality and lack of practice by students, lack of drive and enthusiasm for teachers and students, perception and attitude towards the subject terming it to be difficult and lack of qualified mathematics teachers.
The factor model explained 50.5% of the total variation of the students’ mathematics performance. A correlation analysis was conducted on the five factors to check the relationship between the factors. There was a moderate relationship between lack of interest while studying mathematics and lack of qualified mathematics teachers. A multiple linear regression model was used to represent the five factors and identify the most significant factors affecting students performance in mathematics. The factor model appropriately fitted analysis of factors that affect the students’ mathematics performance in Tanzania secondary schools.
4.2 Recommendations
REFERENCES
[1] Al-Agili, M. Z., Mamat, M. B., Abdullah, L., & Maad, H. A. (2012). The Factors Influence Students’ Achievement in Mathematics: A Case for Libyan’s Students. World Applied Sciences Journal, 17 (9), 1224-1230.
[2] Baroody, A. J. (1987). Children's Mathematical Thinking: A Developmental Framework for Preschool, Primary, and Special Education Teachers: Teachers College Press.
[3] Field, A. (2009). Discovering Statistics Using SPSS (3rd edition). Los Angeles, CA: SAGE Publictions Ltd. [4] Gitaari, E. M. E., Nyaga, G., Muthaa, G., & Reche, G. (2013). Factors Contributing to Students Poor
Performance in Mathematics in Public Secondary Schools in Tharaka South District, Kenya. Journal of Education and Practice, 4 (7), 93-99.
[5] Hamilton, L. C. (2008). Statistics with Stata : Updated for Version 10. (7 ed.). Los Angeles, CA: Cengage Learning.
[6] Kilonge, D. (2015). Ufaulu Kidato cha Nne 2014 wapanda kwa asilimia 10. Retrieved from http://tarumbetaafrica.blogspot.com/2015/02/ufaulu-kidato-cha-nne-2014-wapanda-kwa.html
[7] Köğce, D., Yıldız, C., Aydın, M., & Altındağ, R. (2009). Examining Elementary School Students’ Attitudes Towards Mathematics in Terms of Some Variables. Procedia-Social and Behavioral Sciences, 1 (1), 291-295.
[8] Mbugua, Z. K., Kibet, K., Muthaa, G. M., & Nkonke, G. R. (2012). Factors contributing to students’ poor performance in mathematics at Kenya certificate of secondary education in Kenya: A case of Baringo county, Kenya. American International Journal of Contemporary Research, 2 (6), 87-91.
[9] Montanari, A., & Viroli, C. (2010). The independent factor analysis approach to latent variable modelling. Statistics, 44 (4), 397-416.
[10] Mtulya, A. (Producer). (2014, February Saturday). Form Four Candidates Post Improved Results www.thecitizen.co.tz. Retrieved from http://www.thecitizen.co.tz
[11] Mutodi, P., & Ngirande, H. (2014). The Influence of Students Perceptions on Mathematics Performance. A Case of a Selected High School in South Africa. Mediterranean Journal of Social Sciences, 5 (3), 431. [12] NECTA. (2013). Examiners’ Report on the Performance of Candidates CSEE, 2012 (D. o. I. a. C.
Technology, Trans.) 041 Basic Mathematics (pp. 64). Dar es Salaam: NECTA.
[13] NECTA. (2014). Examiners' Report on the Performance of Candidates CSEE, 2013 (D. o. I. a. C. Technology, Trans.) 041 Basic Mathematics. Dar es Salaam: The National Examinations Council of Tanzania.
[14] Rencher, A. C. (2002). Methods of Multivariate Analysis (2nd edition). New York: John Wiley & Sons, Inc. Publication.
[16] Veloo, A., Ali, R. M., & Krishnasamy, H. N. (2014). Affective determinants of Additional Mathematics achievement in Malaysian technical secondary schools. Paper presented at the International Conference
on Education & Educational Psychology 2013 (ICEEPSY 2013), Malaysia.
[17] Yong, A. G., & Pearce, S. (2013). A beginner’s guide to factor analysis: Focusing on exploratory factor analysis. Tutorials in Quantitative Methods for Psychology, 9 (2), 79-94.
[18] Zaya, E. (2014). Matokeo Kidato Cha Nne 2013:Ufaulu Wapanda. Retrieved 22nd February 2014, from http://www.ippmedia.com/frontend/?l=65062
JUSTIN KISAKALI,SCHOOL OF COMPUTATIONAL AND COMMUNICATION SCIENCE AND ENGINEERING,NELSON MANDELA AFRICAN INSTITUTION OF SCIENCE AND TECHNOLOGY,ARUSHA,TANZANIA
P.O.BOX 447TENGERU,ARUSHA,TANZANIA
DMITRY KUZNETSOV, SCHOOL OF COMPUTATIONAL AND COMMUNICATION SCIENCE AND ENGINEERING,NELSON MANDELA AFRICAN INSTITUTION OF SCIENCE AND TECHNOLOGY,ARUSHA,TANZANIA
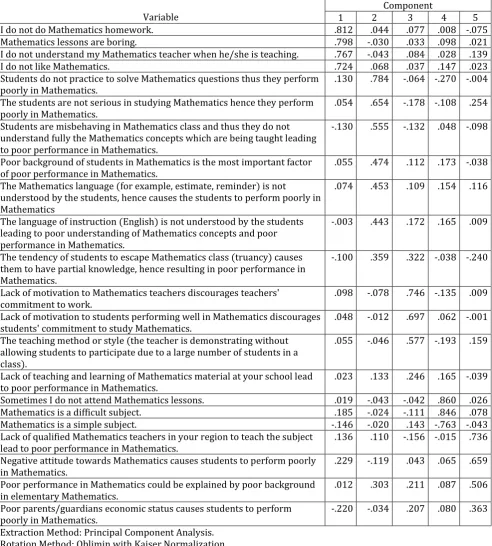
Appendices
Table 1: A pattern matrix with component/factors before rotation (N = 520)
Variable
Component
1 2 3 4 5
I do not do Mathematics homework. .812 .044 .077 .008 -.075
Mathematics lessons are boring. .798 -.030 .033 .098 .021
I do not understand my Mathematics teacher when he/she is teaching. .767 -.043 .084 .028 .139
I do not like Mathematics. .724 .068 .037 .147 .023
Students do not practice to solve Mathematics questions thus they perform poorly in Mathematics.
.130 .784 -.064 -.270 -.004 The students are not serious in studying Mathematics hence they perform
poorly in Mathematics.
.054 .654 -.178 -.108 .254 Students are misbehaving in Mathematics class and thus they do not
understand fully the Mathematics concepts which are being taught leading to poor performance in Mathematics.
-.130 .555 -.132 .048 -.098
Poor background of students in Mathematics is the most important factor of poor performance in Mathematics.
.055 .474 .112 .173 -.038 The Mathematics language (for example, estimate, reminder) is not
understood by the students, hence causes the students to perform poorly in Mathematics
.074 .453 .109 .154 .116
The language of instruction (English) is not understood by the students leading to poor understanding of Mathematics concepts and poor performance in Mathematics.
-.003 .443 .172 .165 .009
The tendency of students to escape Mathematics class (truancy) causes them to have partial knowledge, hence resulting in poor performance in Mathematics.
-.100 .359 .322 -.038 -.240
Lack of motivation to Mathematics teachers discourages teachers' commitment to work.
.098 -.078 .746 -.135 .009 Lack of motivation to students performing well in Mathematics discourages
students' commitment to study Mathematics.
.048 -.012 .697 .062 -.001 The teaching method or style (the teacher is demonstrating without
allowing students to participate due to a large number of students in a class).
.055 -.046 .577 -.193 .159
Lack of teaching and learning of Mathematics material at your school lead to poor performance in Mathematics.
.023 .133 .246 .165 -.039 Sometimes I do not attend Mathematics lessons. .019 -.043 -.042 .860 .026 Mathematics is a difficult subject. .185 -.024 -.111 .846 .078 Mathematics is a simple subject. -.146 -.020 .143 -.763 -.043 Lack of qualified Mathematics teachers in your region to teach the subject
lead to poor performance in Mathematics.
.136 .110 -.156 -.015 .736 Negative attitude towards Mathematics causes students to perform poorly
in Mathematics.
.229 -.119 .043 .065 .659 Poor performance in Mathematics could be explained by poor background
in elementary Mathematics.
.012 .303 .211 .087 .506 Poor parents/guardians economic status causes students to perform
poorly in Mathematics.
-.220 -.034 .207 .080 .363 Extraction Method: Principal Component Analysis.
Table 2:A structure matrix showing correlations between variables and component/factors after rotation (N = 520)
Variable
Component
1 2 3 4 5
𝑥1 Mathematics lessons are boring. .829 .054 .062 .319 .220
𝑥2 I do not understand my Mathematics teacher when he/she is teaching. .805 .036 .120 .260 .327
𝑥3 I do not do Mathematics homework. .803 .118 .096 .236 .121
𝑥4 I do not like Mathematics. .776 .155 .083 .365 .214
𝑥5 Students do not practice to solve Mathematics questions thus they
perform poorly in Mathematics.
.112 .738 .038 -.107 -.006 𝑥6 The students are not serious in studying Mathematics hence they
perform poorly in Mathematics.
.127 .618 -.049 .039 .240 𝑥7 Students are misbehaving in Mathematics class and thus they do not
understand fully the Mathematics concepts which are being taught leading to poor performance in Mathematics.
-.100 .531 -.058 .081 -.126
𝑥8 Poor background of students in Mathematics is the most important factor
of poor performance in Mathematics.
.133 .524 .197 .273 .025 𝑥9 The Mathematics language (for example, estimate, reminder) is not
understood by the students, hence causes the students to perform poorly in Mathematics.
.181 .505 .211 .278 .180
𝒂 The language of instruction (English) is not understood by the students leading to poor understanding of Mathematics concepts and poor performance in Mathematics.
.083 .497 .256 .255 .065
𝒃 The tendency of students to escape Mathematics class (truancy) causes them to have partial knowledge, hence resulting in poor performance in Mathematics.
-.129 .390 .339 -.011 -.216
𝑥10 Lack of motivation to Mathematics teachers discourages teachers'
commitment to work.
.077 .023 .726 -.055 .113 𝑥11 Lack of motivation to students performing well in Mathematics
discourages students' commitment to study Mathematics.
.083 .111 .701 .134 .114 𝑥12 The teaching method or style (the teacher is demonstrating without
allowing students to participate due to a large number of students in a class).
.050 .018 .576 -.112 .222
𝒄 Lack of teaching and learning of Mathematics material at your school lead to poor performance in Mathematics.
.077 .201 .276 .210 .027 𝑥13 Mathematics is a difficult subject. .432 .119 -.024 .894 .226
𝑥14 Sometimes I do not attend Mathematics lessons. .258 .099 .031 .858 .148
𝑥15 Mathematics is a simple subject. -.364 -.139 .063 -.800 -.167
𝑥16 Lack of qualified Mathematics teachers in your region to teach the
subject lead to poor performance in Mathematics.
.302 .109 -.035 .134 .745 𝑥17 Negative attitude towards Mathematics causes students to perform
poorly in Mathematics.
.388 -.069 .127 .207 .724 𝑥18 Poor performance in Mathematics could be explained by poor
background in elementary Mathematics.
.180 .363 .336 .234 .557 𝒅 Poor parents/guardians economic status causes students to perform
poorly in Mathematics.
-.113 .003 .252 .084 .352 Extraction Method: Principal Component Analysis.
Rotation Method: Oblimin with Kaiser Normalization.