Published by Science and Education Publishing DOI:10.12691/jfs-8-3-1
Income Diversification Strategies and Household Food
Security among Rice Farmers: Pointers to Note
in the North Tongu District of Ghana
Romeo Oduro Akrasi1,*, Prince Ntrie Eddico2, Rejoice Adarkwah3
1
Excise Division, Ghana Revenue Authority, Kumasi, Ghana
2
Department of Agricultural Economics and Agribusiness, University of Ghana, Accra
3
Department of Agricultural Economics and Extension, KNUST, Kumasi *Corresponding author: rodewise@yahoo.co.uk
Received July 04, 2020; Revised August 05, 2020; Accepted August 14, 2020
Abstract Food security has remained topical over the period and Africa in among the world’s most food insecure
regions. Several strategies have been adopted by rural dwellers to improve food security but the situation remains prevalent. One such approach is the adoption of income diversification strategies. This study assesses the effect of income diversification strategies of rice farmers on household food security in the North Tongu District of the Volta Region of Ghana with the use of a semi-structured questionnaires. The strategies of concern include ‘Rice income only’ (R); ‘Rice income plus other agricultural incomes’ (RA); ‘Rice income plus non-agricultural incomes’ (RN) and; ‘Rice income plus other agricultural and non-agricultural incomes’ (RAN). The ‘Rice income only’ (R) were those respondents that did not diversify in any way at all; they cultivated only rice The Multinomial Logit Model was used to estimate factors affecting the choice of income strategies. Being a household head, household size, employable skills and household food expenditure significantly affected choice of diversification. Respondents’ household food security was measured using the household dietary diversity score (HDDS). The mean HDDS was 5.81 indicating moderate food security. The Poisson Regression was used to model the effect of income diversification on food security. All the 3 diversification strategies had a positive and significant effect on food security. The study concluded that income diversification had a positive effect on food security and that attainment of high food security was associated with diversification into non-agricultural activities. The study recommends that farmer-field workshops should be organized periodically in the area to train farmers to equip them with non-farm skills so they can explore other opportunities outside of farming. Also, farmer awareness on the need for crop diversification and livestock production should be intensified in the area.Keywords
: income diversification, livelihoods strategies, food security, north Tongu, Ghana, rice farmers, multinomial logit, Poisson regressionCite This Article: Romeo Oduro Akrasi, Prince Ntrie Eddico, and Rejoice Adarkwah, “Income
Diversification Strategies and Household Food Security among Rice Farmers: Pointers to Note in the North Tongu District of Ghana.” Journal of Food Security, vol. 8, no. 3 (2020): 77-88. doi: 10.12691/jfs-8-3-1.1. Introduction
Improving food security remains a key objective of most African countries. Participating countries at the 1996 World Food Summit renewed their pledge to fight against poverty and hunger [1]. Even though several interventions have been rolled out to ensure food security in Africa over the years, food insecurity is still prevalent in the continent. In a survey by [2], it was found that some 226.7 million people in the continent are still undernourished. An earlier report by [3] indicated that about 1.2 million people in Ghana, representing about 5% of the population were food insecure and another 2 million people would be vulnerable to food insecurity should there be an unexpected shock in the food system.
One major factor that contributes to food insecurity in Ghana is poverty [4]). The Millennium Development Goal (MDG) on hunger called for the proportion of hungry people across the globe to be halved by the end 2015. The second of the new Sustainable Development Goals (SDGs) of the FAO has even targeted an end to global hunger and ensuring that all persons everywhere especially the poor and vulnerable have access to food all year round by 2030 [5]. [6] and [7] identified farming households in Ghana to be more vulnerable to poverty than those of other sectors, with about 46% falling below the poverty line.
alternative livelihood activities could therefore worsen the plight of these farmers. It is for this reason that income diversification is crucial. [9] defined income diversification as switching from one crop to a combination of food crops or high value cash crops (crop diversification) or moving from farming into non-farm ventures (non-farm diversification). [10] viewed diversification in rural context as a dynamic adaptation process through which farmers respond to threats and opportunities as well as manage risk and gain extra income thereby securing their livelihoods and improving their standard of living.
For this study, income diversification is the process of combining rice farming with other income sources (farm or non- farm) in order to improve living standards. According to [8] smallholder farmers with less than a hectare on the average are predominant in the North Tongu District. Smallholders are more likely to run out of food and be forced to buy in the lean season when market prices are usually at their peak [4]. Non-participation in alternative livelihood activities could therefore worsen the plight of these farmers. This is because farmers do not depend on what they produce alone to meet their food needs and the needs of their households but they also buy as well. Seasonal hikes in food prices is a source of concern for poor farming households since their access to foods during such periods becomes hindered [4].
The focus on rice farmers in this study is mainly due to the crop’s poverty alleviating role in Ghana and the study area [11]. This study contributes to the body of knowledge needed to address the problem of food insecurity by answering the question: Does income diversification influence household food security? The specific research questions are: What factors affect rice farmers’ choice of income diversification strategy? What is the household food security status of rice farmers? And what effect does farmer’s income diversification have on household food security?
2. Materials and Methods
2.1. Sampling and Data Collection Approach
Adopting a multistage sampling approach, rice farmers in the Volta region were purposively selected because aside the three northern regions (now five regions because of the splitting of Northern region into three in 2019), the Volta Region had the highest absolute poverty rate in the 6th round of the GLSS. Also, the region recorded a worsening welfare distribution [8]. Additionally, studies on food security in Ghana have largely focused on northern Ghana. The next stage involved the purposive selection of rice farmers as the subject of the study. This is because of the cereal’s importance in Ghana’s food system and its role as an important cash crop in the growing areas [11].
The North Tongu district was selected then since it is an important rice producing area after which the three leading rice growing communities in the district were purposively selected. These are Battor, Aveyime and Alabonu. Using data from the district agricultural in the area, a sample size of 215 was randomly targeted from the three selected communities using the formula proposed by [12]:
( )
2 1N n
N e =
+ (1)
Where n = Sample size; N = size of the population; e = significance level (0.05 for this study).
The number of respondents selected from each community was proportionally obtained; 54 from the Alabonu area and 161 from the Battor-Aveyime area. The study however ended up with 204 respondents for the analysis as some questionnaires had to be taken out during data cleaning for the purposes of data quality.
A cross-sectional data for major cropping season of 2015 (which covered March through to August) was collected from the selected rice farmers using a well-structured questionnaire.
2.2. Methods of Data Analysis
2.2.1. Analysis of the Factors Influencing the Choice of Income Diversification Strategy
by Rice Farmers
In estimating the determinants of choice of income diversification strategy among rice farmers, the respondents were grouped into four categories based on their choice of income strategy.
Rice farm income only (R Strategy): This group comprises farming households that rely solely on rice farming for income and neither grow other crops nor engage in other livelihood activities aside rice farming. Farmers who chose this income portfolio did not diversify their incomes.
Rice farm income plus other agricultural sources (RA Strategy): This group of rice farmers derive their livelihood from within the agricultural sector. Included in this group are rice farmers who combine all or any of the following income-generating activities in addition to their rice cultivation: Growing other crops; keeping livestock; fishing and/or investing in fishing-related activities (such as renting out fishing equipment for income); seeking farm wage employment either in commercial farms or farms belonging to other persons to gain income.
Rice farm plus Non-agricultural income (RN Strategy): This group of respondents are those who in addition to their rice farming engage in other income-generating activities not within the agricultural sector. This includes non-agricultural wage employment, non-agricultural self- employment of any kind, owning a shop, engaging in trade, and earnings from artisans among others.
Rice farm plus other agricultural and non-agricultural incomes (RAN Strategy): This category is made up of rice farmers who simultaneously earn incomes from all the above sources thus, within the agricultural sector as well as the non-agricultural sector.
The Multinomial Logit
of the unobserved portion of the utility across all the options, the Multinomial Logit can be represented by:
. ( ) . . ( ) 4 . 1 .
B Xnj y Hnj nj
B Xnj y Hnj j e P e + = ′ ′ ′ + ′ Σ = (2)
Setting the β’s and γ’s to zero for ‘Rice income only’ strategy (R) which will be used as the base category, the Multinomial Logit for each strategy (j≠ strategy R) can be represented as:
.
( )
.
, 1 .
( )
4 .
2 1
B Xnj y Hnj nj j
B Xnj y Hnj j e P e ′ ′ ′ ′ + ≠ + = = + Σ (3) and 1 . ( ) 4 . 1 1 . 1 n
B Xnj y Hnj
j P e + ′ = ′ = + Σ (4)
The above equation can be estimated using maximum likelihood method. The Hn and Xn are pooled together under broad ‘asset-based’ variables.
The explicit form of the model is specified as below
0 1 1 2 2 3 3 13 13
ij
P =B +B X +B X +B X +…+B X +ε (5)
( 2,3,4) 0 1 1 2 2
3 3 13 13
ij j
P B B X B X
B X B X ε
= = + +
+ +…+ + (6)
Where 𝑃𝑃1= Probability of a farmer choosing income strategy 𝑗𝑗 and ‘j’ is any of the four available income strategies a rice farmer can choose.
𝐵𝐵0= Constant term
𝑋𝑋𝑖𝑖 = Set of independent variables hypothesized to affect
the choice of income diversification strategy ɛ = Error term.
2.2.2. Estimating the Food Security Status of Rice Farmers’ Households
Considering the direct link between income and economic access to food, the study focused on the ‘access’ pillar of food security as this study is on income diversification. Food security of rice farmers’ households was measured using the Household Dietary Diversity Score (HDDS). Developed by the Food and Nutrition Technical Assistance (FANTA) Project, the HDDS serves as a proxy indicator for household access to food by measuring food consumption qualitatively.
Dietary diversity can be used to collect information either at household or individual level. According to [13], the household dietary diversity score reveals in a glimpse a household’s economic access to food variety while the individual dietary diversity score (IDDS) reflects an individual’s nutrient adequacy. This study chose to collect data on household level because of the belief that the food security of the farmer is dependent on the food security situation of his household. Also, since household members are likely beneficiaries of the farmer’s production through cash and/or direct food produce contribution, it is
appropriate to collect data on the household level even though the primary focus of the study is the individual farmer’s livelihood strategy.
Collecting data on dietary diversity is fairly straightforward, requiring less complicated training of field staff. There is also less possibility of recall bias on the part of the respondent since the reference period is only 24 hours. [14] argue that household dietary diversity is a preferred proxy indicator because a more diversified diet is known to be very much correlated with factors like caloric and protein adequacy, consumption of high quality protein (animal source protein), as well as household income. Furthermore, an increase in food expenditure as a result of rising incomes (even in the case of poor households) is associated with increase in both diet quantity and quality. A more diversified diet is also associated with a number of improved outcomes in areas such as birth weight, child anthropometric status, and improved haemoglobin concentrations. The respondents were asked to describe the different food items (meals and snacks) they or any member of their households had consumed over the recall period. This included all foods prepared at home and consumed either at home or outside home but excluded foods that were bought and consumed outside home. Respondents were also asked to provide information on the different ingredients used to prepare composite foods (mixed dishes which contain ingredients belonging to different food groups). Small quantities of food items consumed were captured because the HDD score is designed to reflect economic access to food. As such, even small quantities of a food item reflect some ability to purchase since household resources were used to acquire them.
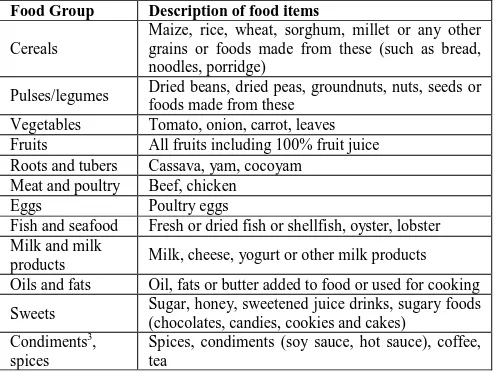
The score was constructed by counting the different food groups consumed by the household or an individual over the preceding 24 hours using FAO’s preferred list of 12 reference food groups. The reference food groups used are presented in Table 1.
Table 1. Food Groups Used for the Computation of the Household Dietary Diversity Scores
Food Group Description of food items
Cereals
Maize, rice, wheat, sorghum, millet or any other grains or foods made from these (such as bread, noodles, porridge)
Pulses/legumes Dried beans, dried peas, groundnuts, nuts, seeds or foods made from these
Vegetables Tomato, onion, carrot, leaves Fruits All fruits including 100% fruit juice Roots and tubers Cassava, yam, cocoyam
Meat and poultry Beef, chicken
Eggs Poultry eggs
Fish and seafood Fresh or dried fish or shellfish, oyster, lobster Milk and milk
products Milk, cheese, yogurt or other milk products Oils and fats Oil, fats or butter added to food or used for cooking
Sweets Sugar, honey, sweetened juice drinks, sugary foods (chocolates, candies, cookies and cakes)
Condiments3, spices
Spices, condiments (soy sauce, hot sauce), coffee, tea
1Food group is a group of food items with similar nutritional and caloric
qualities.
2A food item cannot be separated further into distinct foods. That
notwithstanding, fish or poultry and other generic terms are considered to be food items for sake of this analysis.
3Condiments denote foods that are usually consumed in very small
Following the recommendation of [13] along with the approach by [14], tertiles were created using the mean HDDS for the sample and standard deviation.
2.2.3. Estimating the Effects of Rice Farmers’ Income Diversification on Household Food Security Theoretical background
The relationship between income diversification and food security falls in the domain of Sustainable Livelihood Framework. The Sustainable Livelihood Framework by [15] and [16] show how sustainable livelihoods can be realized in different contexts through access to a diverse livelihood resources (natural, economic, human and social capitals). Different livelihood strategies can be pursued by combining these resources to yield sustainable livelihood outcomes. The choice of livelihood strategy is influenced by certain organizational and institutional factors that affect a household/individual’s access to resources.
The Sustainable Livelihood Framework by [16] identifies food security as an outcome of livelihood strategy because the household’s access to food depends on its ability to generate income. Many studies in the context of developing countries have reinforced the importance of income generation in determining access to food. Even subsistence farming groups in developing African countries are known to be net purchasers of food, highlighting further the significant role income generation plays in determining food access [17]. As incomes rise, poor households spend more on food (albeit proportionately less than the corresponding rise in income).
These households purchase a more diverse variety of foods, and shift to higher quality foods with greater nutritional value [18]. Hence, we can say that food security depends on the choice of income strategy adopted. Applying the above to this study, the relationship between food security and income strategy can be represented mathematically as:
(
)
.
Food Security= f Income Strategy (7)
The income strategies of the farmers can thus be regressed on their household food security using an appropriate econometric model in order to estimate the effects of income diversification on household food security.
Model specification
In modeling the effects of income diversification on household food security, the Poisson regression model was used. The number of different food groups consumed represented by the HDDS is the measure used for household food security in this study (dependent variable). Since it is a discrete variable, it is appropriate to use a model for count data based on a Poisson distribution. Following [19], the study defines yi as the number of food groups consumed by the household i in the past 24 hours leading to the survey (where i=1, 2,…, 12). The variable yi is assumed to be distributed as a Poisson distribution with parameter λi given as:
(
)
λλ!
yi i
i i
i e
P Y y
y −
= = (8)
Where 𝜆𝜆𝑖𝑖can be specified by a vector of covariates Xi that includes the variables in Table 2. More often than not, 𝜆𝜆𝑖𝑖is log linear function which assumes the form:
(
)
ln λ =i B xi i (9)
The log linear model guarantees that the number of food groups consumed by the household is a non-negative integer and is given as:
(
|)
B xi i.i i i
E y x =λ =e (10)
The empirical model is given as:
0 1 2 2
3 3 11 11
1 .. |
.
( )
i E yi xi X X
X X
λ β β β
β β ε
= + +
= +
+ + + (11)
Where yi is the number of food groups consumed by household i over the reference period, β0 is the constant term, βi are the coefficients, Xi is the set of explanatory variables in Table 2 and ε is the error term.
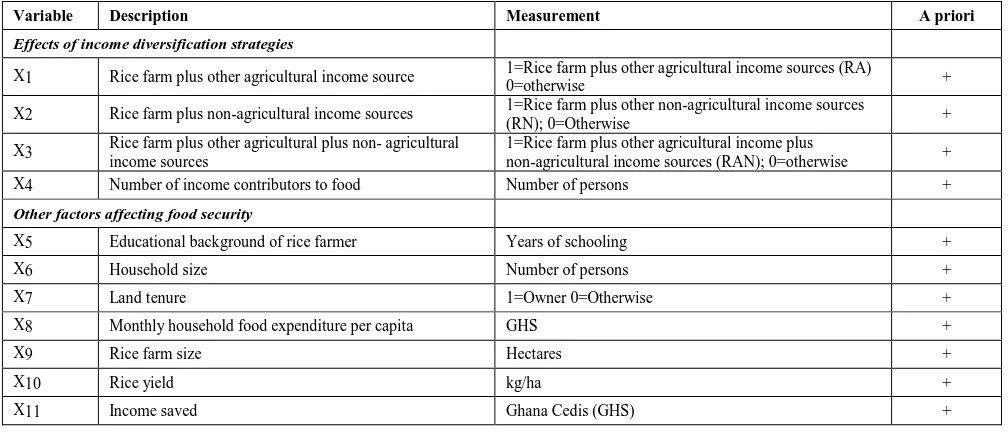
Table 2. Description of Variables Included in the Poisson Model and their Apriori Expectations
Variable Description Measurement A priori
Effects of income diversification strategies
X1 Rice farm plus other agricultural income source 1=Rice farm plus other agricultural income sources (RA) 0=otherwise +
X2 Rice farm plus non-agricultural income sources 1=Rice farm plus other non-agricultural income sources
(RN); 0=Otherwise +
X3 Rice farm plus other agricultural plus non- agricultural income sources 1=Rice farm plus other agricultural income plus non-agricultural income sources (RAN); 0=otherwise +
X4 Number of income contributors to food Number of persons +
Other factors affecting food security
X5 Educational background of rice farmer Years of schooling +
X6 Household size Number of persons +
X7 Land tenure 1=Owner 0=Otherwise +
X8 Monthly household food expenditure per capita GHS +
X9 Rice farm size Hectares +
X10 Rice yield kg/ha +
Hypothesis
a) Ho: Rice based income strategies have no effect on the food security status of a rice farmer’s household
Ha: Rice based income strategies have a positive effect on the food security status of a rice farmer’s household
b) Ho: Number of income contributors to household food has no effect on the food security status of a rice farmer’s household
Ha: Number of income contributors to household food has a positive effect on a rice farmer’s household food security.
The same hypothesis was repeated for all the other variables in Table 2 with positive apriori expectation.
c) Ho: Household size has no effect on household food security
Ha: Household size has a negative effect on the household food security status
3. Result and Discussions
3.1. Socio-demographic Characteristics
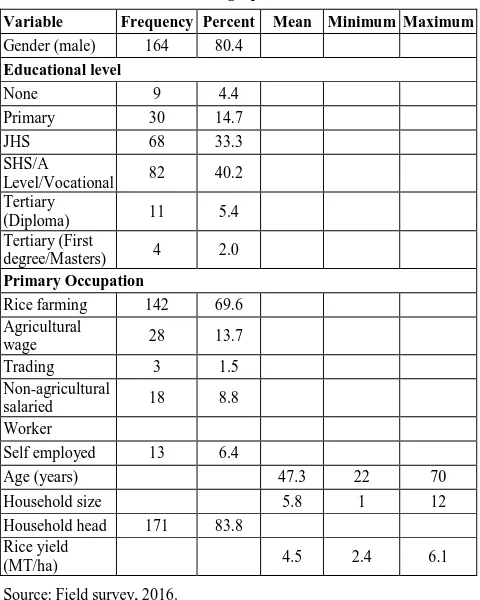
Gender of the respondents: About 19.6 percent of the respondents were females while the remaining 164 (80.4 percent) were males. The male dominance could possibly be due to strenuous and capital intensive nature of rice cultivation as females are relatively disadvantaged in that regard.
A summary of the socio-demographic profile of respondents is presented in Table 3.
Table 3. Socio-demographic Characteristics
Variable Frequency Percent Mean Minimum Maximum
Gender (male) 164 80.4
Educational level
None 9 4.4
Primary 30 14.7
JHS 68 33.3
SHS/A
Level/Vocational 82 40.2
Tertiary
(Diploma) 11 5.4
Tertiary (First
degree/Masters) 4 2.0
Primary Occupation
Rice farming 142 69.6
Agricultural
wage 28 13.7
Trading 3 1.5
Non-agricultural
salaried 18 8.8
Worker
Self employed 13 6.4
Age (years) 47.3 22 70
Household size 5.8 1 12
Household head 171 83.8
Rice yield
(MT/ha) 4.5 2.4 6.1
Source: Field survey, 2016.
Primary occupation: The main jobs in the study area were rice farming, trading, agricultural wage employment,
self-employment and non-agricultural salaried work. The modal primary occupation among the respondents was rice farming; 69.6 percent of the respondents reported it as their primary occupation Even though some of them cultivate other crops in addition to the rice, none of them reported growing other crops as their primary occupation. That the farmers perceive rice as a more lucrative cash crop to grow compared to the other crops like maize, chilli and cassava grown in the study area explains this. This substantiates the argument by [11] who were of the view that rice is the most economically important cash crop in communities in Ghana where it is cultivated. Up to 13.7 percent of the respondents reported agricultural wage employment as their main occupation. This group of rice farmers were mainly those who were employed by the commercial farms such as Prairie Volta Limited, Musa Hamat Farms, Golden Exotic Farms, among others operating in and around the study area. About 8.8 percent of the respondents were involved in non-agricultural salaried work such as teaching as their main livelihood in addition to the rice farming.
Age distribution of the respondents: The age of the respondents ranged between 22 to 70 years with an average of 47.25 for the sample. The age distribution implies that majority of the farmers are within their economically active times and as such can engage in a multiple income-generating activities.
Distribution of household size of rice farmers: Majority of the farmers (74.5) lived in households with 5 to 9 members. The mean for the sample was 5.8 persons, which is well above the average household size of 4.2 and 4.4 persons recorded for the region and entire nation respectively in the 2010 population and housing census [8]. A large household size can mean more pressure on household food and non-food resources hence the need for farmers to adopt livelihood strategies to help meet these needs.
Household head: Majority of the respondents reached (83.8%) were heads of their respective households. This underlines the centrality of the economic activities of rice farmers in North Tongu to their household because being a household head also means bearing the economic responsibility of the entire household as per [8].
Distribution of rice yield: The average rice yield in the area of 4.5 metric tonnes (MT) per hectare was well above the national average yield of 2.54 tonnes per hectare reported by Statistics, Research and Information Directorate (SRID) even though this figure was still short of the achievable yield of 6.5 MT/ha. A bulk of the farmers recorded yields between 4.1-5 tonnes per hectare.
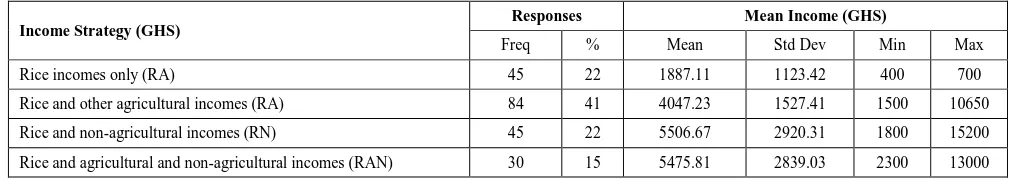
3.2. Income Strategies of the Respondents
group of respondents were those who earned income from all the income sources discussed above, hence their name, ‘Rice income plus other agricultural and non-agricultural incomes’ (RAN) formed 15.2 percent of the sample. The relatively small number of respondents in the RAN category could be attributed to the herculean nature of engaging in multiple income generating activities simultaneously even though it might have its rewards of high income.
Rice income only (R strategy): The mean income earned by the farmers in this group was GHS 1887.11 and the standard deviation was GHS 1123.42 (Table 4). The incomes of the respondents who used this income portfolio ranged from a minimum of GHS 400 to a maximum of GHS 7000. Out of the 45 persons in the group, up to 64.4 percent earned less than GHS 2000 for the entire season while 33.3 percent earned incomes within GHS 2001 to 4000. Only 1 person earned income between GHS 6001 to 8000.
Rice income plus other agricultural income sources (RA strategy): More than half of respondents (56.6%) who adopted the ‘RA strategy’ earned between GHS 2001 to 4000 for the season while 31.3 percent of them received incomes within GHS 4001 to 6000. The mean income for this category was GHS 4047.23 with a standard deviation of GHS 1527.41.
Rice income plus non-agricultural incomes strategy (RN strategy): The mean income of farmers who adopted the RN income strategy was GHS 5506.67 and the standard deviation around the mean was GHS 2920.31. The least earner in this category received GHS 1800 for the season while the highest earner had GHS 15,200. The modal income range for this group was GHS 2001 to 4000 and GHS 2001 to 4000. Up to 15.6% of the respondents who adopted the RN income strategy earned incomes in the excess of GHS 8000.
Rice income plus other agricultural plus non-agricultural income sources (RAN): The mean seasonal income of respondents who chose the RAN strategy was GHS 5475.81. The least earner for the season received GHS 2300 while the highest earner had GHS 13,000 as income. More than half (51.6%) of the respondents who adopted this income strategy earned incomes within GHS4001 to 6000 for the season while 29% of them earned between GHS 2001 to 4000. Similar to the case of those in the RN income strategy, 16.2% of the respondents in the RAN strategy earned more than GHS 8000 from their activities for the season.
The breakdown of income strategies of the 204 respondents interviewed is presented in Table 4.
3.3. Factors Influencing the Choice of Income
Diversification Strategy by Rice Farmers
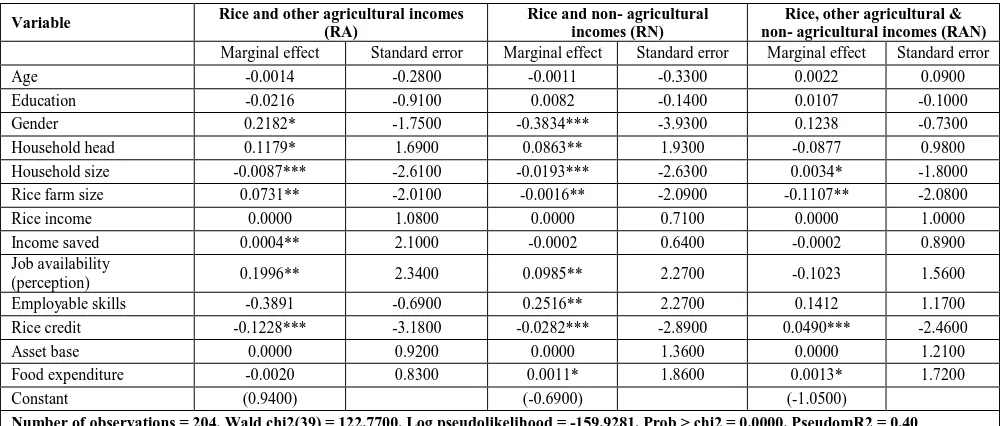
The Multinomial Logit results for the factors affecting income diversification among rice farmers in the study area is presented in this section. The outcome variable of interest, whether or not one diversifies, is categorical in nature. The reason is because a farmer may either be growing only rice and therefore has no other source of income aside the rice farm (no diversification) and thus be classified into “Rice only category” (R strategy) or may diversify and hence be classified into any of the other three categories of diversification; “rice plus other agricultural incomes” (RA), “rice plus non-agricultural income sources” (RN) and “rice plus other agricultural plus non- agricultural incomes” (RAN). “Rice income only” (no diversification) group was selected as the base category for the multinomial logit to determine the factors influencing income diversification of rice farmers so that all other choices of diversification strategies were compared to this group.
The entire model was statistically significant at 1 percent significance level as measured by the probability of the Wald chi-squared estimate. The marginal effects are discussed and not the coefficients since they tell not just the direction alone but also the actual probability/magnitude of change that will occur to the dependent variable as a result of changes in the independent variables.
Gender: The multinomial logit for males relative to females is 0.3834 units lower for being in RN diversification category relative to “rice only” given all other predictor variables in the model are held constant. What this means is that female rice farmers were more likely to adopt the RN diversification strategy compared to their male counterparts. This is because self-employment activities such as petty trading make up a significant proportion of non-farm activities in rural Ghana and women usually dominate this. Male farmers are rather likely to be involved in agricultural related activities as their diversification strategy. This assertion is confirmed by the fact that males were rather 21.82% more likely to take up other agricultural activities in addition to their rice farming (that is adopt RA diversification strategy) than their female counterparts. The fact that males have better land access over females in Ghana makes it easier for them to go into cultivation of other crops (usually on different piece of land), classified in this study as ‘RA income strategy’. This finding corroborates that of [4] and [19] who also reported that females are more likely to be involved in non-farm activities than males.
Presented in Table 5 are the estimated marginal effects from the analysis and the corresponding z-values.
Table 4. Mean Incomes Earned by the Different Strategies
Income Strategy (GHS) Responses Mean Income (GHS)
Freq % Mean Std Dev Min Max
Rice incomes only (RA) 45 22 1887.11 1123.42 400 700
Rice and other agricultural incomes (RA) 84 41 4047.23 1527.41 1500 10650
Rice and non-agricultural incomes (RN) 45 22 5506.67 2920.31 1800 15200
Rice and agricultural and non-agricultural incomes (RAN) 30 15 5475.81 2839.03 2300 13000
Table 5. Multinomial Logit Results for Factors Influencing Income Diversification Variable Rice and other agricultural incomes
(RA)
Rice and non- agricultural incomes (RN)
Rice, other agricultural & non- agricultural incomes (RAN)
Marginal effect Standard error Marginal effect Standard error Marginal effect Standard error
Age -0.0014 -0.2800 -0.0011 -0.3300 0.0022 0.0900
Education -0.0216 -0.9100 0.0082 -0.1400 0.0107 -0.1000
Gender 0.2182* -1.7500 -0.3834*** -3.9300 0.1238 -0.7300
Household head 0.1179* 1.6900 0.0863** 1.9300 -0.0877 0.9800
Household size -0.0087*** -2.6100 -0.0193*** -2.6300 0.0034* -1.8000
Rice farm size 0.0731** -2.0100 -0.0016** -2.0900 -0.1107** -2.0800
Rice income 0.0000 1.0800 0.0000 0.7100 0.0000 1.0000
Income saved 0.0004** 2.1000 -0.0002 0.6400 -0.0002 0.8900
Job availability
(perception) 0.1996** 2.3400 0.0985** 2.2700 -0.1023 1.5600
Employable skills -0.3891 -0.6900 0.2516** 2.2700 0.1412 1.1700
Rice credit -0.1228*** -3.1800 -0.0282*** -2.8900 0.0490*** -2.4600
Asset base 0.0000 0.9200 0.0000 1.3600 0.0000 1.2100
Food expenditure -0.0020 0.8300 0.0011* 1.8600 0.0013* 1.7200
Constant (0.9400) (-0.6900) (-1.0500)
Number of observations = 204, Wald chi2(39) = 122.7700, Log pseudolikelihood = -159.9281, Prob > chi2 = 0.0000, PseudomR2 = 0.40
*, ** and *** denote statistically significant variables at 10%, 5% and 1% significant levels respectively Source: Field survey, 2016.
Household head: Compared to cultivating only rice (no diversification), respondents who were heads of their households were 11.79 percent more likely to diversify into “rice and agricultural” (RA) and 8.63 percent more likely to choose ‘rice and non-agricultural’ (RN) diversification. This is because being a household head comes with added responsibility of being the major economic anchor of the household. Therefore, rice farmers who were household heads were likely to participate in other income-generating ventures so as to earn additional income to meet the needs of their entire household.
Household size: Adoption of RAN diversification strategy conformed to our apriori expectation of increase in the probability of income diversification as one’s household size increases. For each person added to the household, the likelihood that the rice farmer will adopt RAN diversification strategy increases by 0.34 percent. This observation is so because bigger household sizes imply more mouths to feed and also more needs to be met. It therefore makes sense that the rice farmer responds to this additional responsibility by participating in more income-generating ventures which will lead to an increase in his income. This confirms the argument by [10] in rural Malawi that larger household is associated with income diversification.
On the contrary, household size had an inverse effect on the choice of RA and RN income diversification strategies. Every person added to a respondent’s household decreased the probability of the rice farmer choosing RA and RN income diversification strategies by 0.87 and 1.93 percent respectively. This might be due to the fact that compared to smaller households, large households are likely to be made up of many income earners who would help raise the needed income for the household. The fact that overall income needs of larger households would be a shared burden among the many income earners might compel respondents therein not to take up multiple jobs but rather concentrate on in their rice production, hence specialization. This was what [21] reported in Borno State
of Nigeria where household size was inversely related with income diversification.
Size of rice farm: As rice farm size increases, a respondent was less likely to add on other non-farm income activities (RN and RAN strategies) because rice cultivation in itself is both capital and labour intensive. Increasing rice farm size means upsurge in both labour and capital commitments for the rice farm which the farmer would have needed if he/she were to go into other income ventures. Specifically, for every 1-hectare increase in rice farm size, respondents were 0.16 and 11.07 percent less likely to engage in RN and RAN diversification respectively. This finding supports the argument of [22] that larger farm size is an indicator of good asset holding and social status, hence persons with larger farm size are less likely to engage in non-farm income diversification. [23] also reported similar results in Ethiopia where participation in income diversification decreased with an increase in farm size among smallholder farmers.
The result however showed that an increase in rice farm size increased the probability that the rice farmer would add on cultivation of other crops and/or rearing animals (RA diversification strategy) by 7.31 percentage points. It is relatively easier for the typical rice farmer to go into crop diversification (which constitutes RA diversification) than to combine the rice production with an entirely new non-farm activity (which would imply RN or RAN strategy in this study) hence the observation. In a related study in Ogun State of Nigeria, [24] reported similar findings of marginal increase in crop diversification with increase in farm size
up another agricultural income-generating venture to the rice farming (RA diversification).
Farmer’s perception of available job/income-generating opportunities in the area: The availability of paid job and other income-generating opportunities in the area was measured using the farmer’s perception. To be able to take advantage of available income opportunities, one must first of all be able to spot such openings. Those who perceived opportunities in the area were more likely to choose RA strategy (19.96 percent) and RN strategy (9.85 percent) than those who thought otherwise. In other words, respondents who perceived they could earn additional income were more likely to diversify. Employable skills: The farmer’s employable skills was captured by asking them whether they had any special abilities aside their farming skills that could facilitate their getting employed or exploiting other income avenues aside farming. Respondents who gave affirmative responses were more likely to diversify into non-agricultural activities in addition to growing rice (RN) and had 25.16 percent likelihood of combining their rice farming with other non-agricultural activities to earn income. The limited skills of those who gave “no” responses meant that it would be relatively difficult for them to get involved in income-generating activities outside the farming circles. This finding is in line with a study conducted by [25] in Peru where human capital development through education and skill training influenced non-farm work availability to households.
Access to credit: Diversification into RAN followed the findings of [26] and [27] who argued that credit access would compel a farmer into income diversification. Consequently, this present study found that access to rice farm credit was likely to lead to a 4.9 percent increase in the probability that a farmer will choose the RAN diversification strategy. The opposite was however true for choice of RA and RN diversification strategies. Access to rice farm credit was rather likely to reduce the chances that a farmer would choose RA and RN income diversification strategies by 12.28 and 2.82 percent respectively. This ties in with the findings of [10] and [21] who both reported credit access to have a negative
influence on decision to diversify income. This is because the credit the farmers received was specifically meant for their rice farm hence it led to intensification of the rice farming rather than diversification.
3.4. Food Security of the Respondents
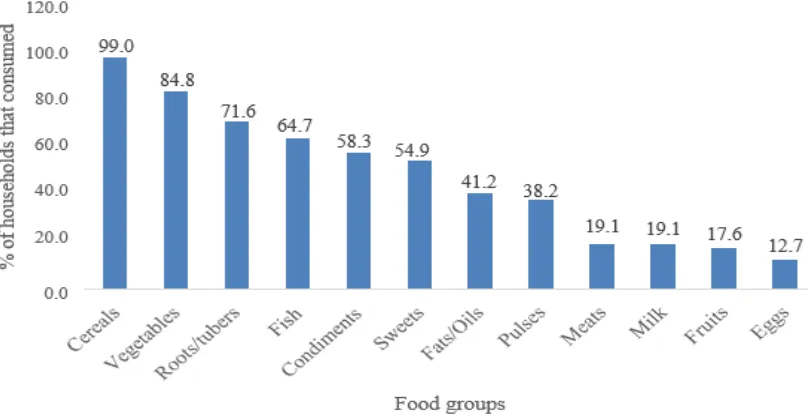
Out of the reference list of 12, the food groups consumed by at least fifty percent of the households in the sample were cereals, vegetables, roots and tubers, fish, condiments and sweets. Food groups which fell below fifty percent consumption by the sample included; fats and oils, pulses, meats, milk, fruits and eggs. After cereals (99% consumption), vegetables and roots/tubers were the most consumed food groups with 84.8% and 71.6% consumption rate respectively. The fact that the diet of the respondents was mostly cereal-based staple foods such as ‘banku’ (a composite Ghanaian dish prepared from cassava dough and corn dough), ‘akple’ (another composite Ghanaian dish prepared from maize flour), and rice explains this dietary pattern. These foods were mostly eaten in combination with some vegetable sauce/stew and some fish (which was the main dietary protein source for the households). The proximity of the study area to both the Volta Lake and Ada Junction (where fish and oysters abound) meant that fish and oyster were in relative abundance compared to other protein sources. Condiments, primarily spices and pepper (flakes) were consumed by 58.3 percent of the households.
Consumption of fruits was very low with only 17.6% of the respondents reporting it during the recall period. Banana was notably the most commonly consumed fruit in the area and was mostly eaten as snack. The presence of Musa Hamat Farms Limited, a commercial banana producing farm operating in the study area accounts for its relative availability compared to other fruits. Again, a little less than a fifth of the respondents ate food items from the meats and milk groups respectively while the lowest consumed group was eggs. The distribution of the different food groups consumed by the sample in the last 24 hours leading to the interview is presented in Figure 1.
The dietary pattern of the households is similar to what [28] reported for households in the Ejura Sekyeredumase District of Ghana where consumption of maize and other cereals as well as cassava was observed among most households. The results also uphold the findings of [29] who argued that persons in low income countries mostly derive their dietary energy from cereals and that only a minute proportion of their dietary energy comes from meat. The findings on consumption of roots and tubers however contradicted latter study as they reported much lower percentage (11%) contribution of roots and tubers to dietary energy.
The mean HDDS for the sample was 5.81 and the standard deviation around the mean was 1.34. What this means is that, the sampled households consumed approximately 6 different food groups on the average out of the maximum of 12 over the recall period. This is reflected in the dietary pattern where the number of different food groups consumed by more than 50 percent of the households was 6 (cereals, vegetables, roots and tubers, fish, condiments and sweets). The study is cautious in directly comparing this mean HDDS to other works in different places since the number of reference food groups in question might not be exactly the same as that used for this study. That notwithstanding, the general consensus is that a higher number of food group consumption is associated with better food access by the household [13]. In a study by [14] in Addis Ababa, Ethiopia using a reference of 12 food groups, the authors recorded a mean HDDS of 6.3. Similar to the finding of this present study, they also found cereals to be the highest consumed food group by the sample. In a related study in rural Mali, [3] recorded a much higher mean dietary diversity score of 7.8 for their sample over a 7-day recall period, albeit the individual HDD scores ranged from 4 to 10 just as in this present study.
3.4.1. Creating Tertiles using the Dietary Diversity Scores
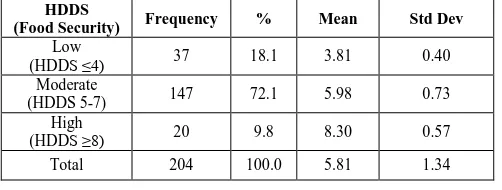
The HDDS for the sample followed a normal distribution as revealed by the Shapiro-Wilk test. The Shapiro-Wilk test which tests for normality was not statistically significant (Appendix A), implying that the null hypothesis of normality of the HDDS distribution holds. Therefore, following the recommendation by [13] and the approach used by [14], the sample was further divided into tertiles using the mean HDDS and standard deviation (5.81 ± 1.34).
The first tertile (Low Food Security households) comprised of respondents whose dietary diversity score was less or equal to 4. Respondents in this class had the lowest HDD scores in the sample. The mean HDD score for this tertile was 3.81 and the standard deviation around the mean was 0.40. In all, 18.1 percent of the respondents interviewed were in this tertile. Households in the second tertile, otherwise referred to as Moderate Food Security group had scores ranging from 5 to 7 with a mean score of 5.98. Majority of the respondents (72.1 percent) were in this tertile. The third tertile (High Food Security) comprised of respondents whose households had consumed 8 or more different food groups in the past 24 hours before the interview. They made up 9.8 percent of
the sample and their average HDDS score was 8.3. Presented in Table 6 is the number of people in a particular level of food security for the households and their respective mean scores.
Table 6. Distribution of Households in the Different Tertiles HDDS
(Food Security) Frequency % Mean Std Dev
Low
(HDDS ≤4) 37 18.1 3.81 0.40
Moderate
(HDDS 5-7) 147 72.1 5.98 0.73
High
(HDDS ≥8) 20 9.8 8.30 0.57
Total 204 100.0 5.81 1.34
Source: Field survey, 2016.
3.5. Effects of Income Diversification on
Household Food Security
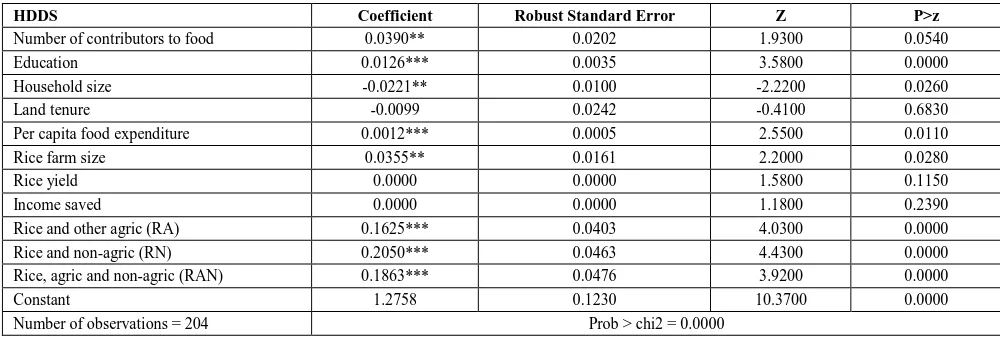
To shed extra light on both the direction and the extent of the relationship between income diversification of respondents and household food security, three dummy variables were included in the regression to represent each of the three diversifying income portfolios in the study. These were; diversification within the agricultural sector (RA strategy), combination of rice income with non-farm income (RN strategy) and combination of rice farm with both agricultural and non- agricultural incomes (RAN strategy). These variables test for the effects of the different income diversification strategies on household food security. Each of the diversification strategies farmers adopted (RA, RN and RAN) influenced household food security positively.
Table 7. Poisson Regression Results for Effect of Income Diversification on Household Food Security
HDDS Coefficient Robust Standard Error Z P>z
Number of contributors to food 0.0390** 0.0202 1.9300 0.0540
Education 0.0126*** 0.0035 3.5800 0.0000
Household size -0.0221** 0.0100 -2.2200 0.0260
Land tenure -0.0099 0.0242 -0.4100 0.6830
Per capita food expenditure 0.0012*** 0.0005 2.5500 0.0110
Rice farm size 0.0355** 0.0161 2.2000 0.0280
Rice yield 0.0000 0.0000 1.5800 0.1150
Income saved 0.0000 0.0000 1.1800 0.2390
Rice and other agric (RA) 0.1625*** 0.0403 4.0300 0.0000
Rice and non-agric (RN) 0.2050*** 0.0463 4.4300 0.0000
Rice, agric and non-agric (RAN) 0.1863*** 0.0476 3.9200 0.0000
Constant 1.2758 0.1230 10.3700 0.0000
Number of observations = 204 Prob > chi2 = 0.0000
Wald chi2 (11) = 255.9500, Deviance goodness-of-fit = 31.6039, Prob > chi2(192) = 1.0000, Pearson goodness-of-fit = 31.3822, Prob > chi2(192) = 1.0000, Log pseudolikelihood = -383.0425, Pseudo R2 = 0.0403
** and *** signify statistical significance at 5% and 1% significance level respectively. Source: Field survey, 2016.
The results also revealed that adopting income diversification strategy RAN and RA will result in farmers increasing the difference in the log of expected household dietary diversity by 0.1863 and 0.1625 units respectively. Income diversification does not only raise income of farmers. It can also serve as an important risk mitigating strategy bearing in mind the risky nature of farming. By combining rice farm income with other agricultural and non-agricultural income sources, respondents smoothen their incomes which in turn smoothens or better still improves their household food security.
The positive and significant association between income diversification and dietary diversity in the Poisson model draws credence to the assertion by [26] that participation in off-farm activities improves food security status in the Sekyere-Afram Plains District of Ghana. In another study, [32] found a positive correlation between crop diversification (which in this study falls in the RA strategy), crop income and dietary diversity.
The results in Table 7 show a positive relationship between diversification and food security.
Rice farm size: An increase in size of rice farm of respondents was statistically significant and positively associated with dietary variety of the household. Farmers with relatively bigger farm sizes are more likely to get more output. The reason is that farmers with large rice farm sizes can produce more to get more income. This will enable them to purchase more food variety for their households leading ultimately to household food security. The argument by [32] that one way by which food production can be increased is by expanding area under cultivation supports this very assertion. This finding concords with [26] who maintained that the odds ratio of being food secure increases with an increase in the area under cultivation.
Education: The results show that if a farmer were to increase his education by one year, the difference in the logs of expected household dietary diversity would be expected to increase by 0.0126 unit, ceteris paribus. Education is generally associated with higher incomes as it improves one’s chances of getting better job opportunities. Dietary diversity can also increase with education possibly because farmers with higher
education might have better knowledge about dietary intake and the importance of dietary quality hence will incorporate the consumption of more food groups into their habitual household diets than those with relatively low level of education. This substantiates [33] who reported attainment of college education to be positively and significantly related to dietary diversity.
Number of contributors to household food: Contribution to household food took into account the value in-cash and in-kind (food produce from own farm) provided by household members. An increase in the number of contributors to household food could mean two things. In one vein, an increase in the number of persons making in-kind contributions to food could suggest a higher food variety for the household. This is because for a typical household with 3 different farmers for instance, there is the tendency that all the farmers in question are contributing different food stuffs from their respective farm to the home since chances are that they might all be cultivating different crops. This will inevitably lead to an increase in the variety of food items available to the household. In another scenario, an increase in the number of household cash contributors to food expenditure with a constant household size implies a rise in the available household per capita income for food. This is because relatively more persons will now be sharing the burden of household food expenditure hence the household will be able to purchase a variety of food items/food groups, leading to a better dietary quality for that household. A study by [34] revealed that a high number of non-working household members puts pressure on the food and non-food resources of the household which increases the household food insecurity, thus supporting the finding of this study.
funds available per head for food and other needs. This will limit the household’s ability to purchase food since the same amount of money which was hitherto allocated for the needs of the household is now going to be shared by relatively more persons. If a farmer’s household size increases by one person, the difference in the logs of expected household dietary diversity would be expected to decrease by 0.0221 unit, holding all other predictor variables unchanged. This finding further confirms the result of the correlation test between dietary diversity and household size above which was inverse and statistically significant. The result however differs from that of [35] but conforms to the finding of [33] who also reported an inverse relationship between household size and dietary diversity.
Per capita food expenditure: Though this study considered dietary diversity at the household level, per capita expenditure on food was used for the analysis of this objective to control for the effects of household size on spending. The Poisson regression results revealed a positive and a significant relationship between per capita monthly food expenditure and household dietary diversity at 1 percent significance level. An increase in per capita food expenditure will predictably lead to 0.0012 unit increase in the difference in the logs of expected counts of household dietary diversity. As spending increases, households try new food items leading to more dietary variety. Similar to this finding, another study by [32] involving 8 different developing countries across different continents also revealed a positive and significant relationship between dietary diversity and household food expenditure. In another study to find out the associations between dietary diversity score and commonly used indicators of socioeconomic status in Bangladesh, [36] also found a positive correlation between dietary diversity and household food expenditure.
4. Conclusions and Recommendations
The following conclusions are made from the study: Most of the respondents diversified their income sources, chief among was engaging in other income activities within the agricultural sector (‘Rice and other agricultural incomes’ strategy. Income also increases with diversification since farmers who did not diversify earned the least incomes for the season.
Gender, household size, being a household head, rice farm size, income saved, perception of job availability, employable skills, rice credit access and total household monthly food expenditure influenced the rice farmers’ decision to participate in income diversification.
Majority of the households had moderate food security (middle HDDS tertile). Only 18.1% of the households were in the low food security group (least HDDS tertile).
Attainment of high food security is associated with diversification into non-agricultural activities since.
Based on these findings and, the following recommendations were made:
The North Tongu District Directorate of Agriculture (formerly called District MOFA Office) should in collaboration with NGOs organize farmer-field workshops periodically in the area to train farmers in order to develop
their skills and increase their awareness of available opportunities in the area so they can take on non-farm jobs to complement their farming.
Farmer awareness on the need for crop diversification and livestock production should also be intensified in the area. This can be achieved through on-site demonstration for different crops and livestock that can do well in the area. Advice on particular crop and/or livestock to choose should be based on the margins that emerge from the field trials.
References
[1] FAO (1996). Declaration on world food security. World Food
Summit, FAO, Rome.
[2] FAO (2014). The state of food insecurity in the world: Strengthening the enabling environment for food security and nutrition. Food and Agriculture Organization, Rome.
[3] Torheim, L. E., Ouattara, F., Diarra, M. M., Thiam, F. D., Barikmo, I., Hatløy, A., & Oshaug, A. (2004). Nutrient adequacy and dietary diversity in rural Mali: association and determinants.
European Journal of Clinical Nutrition, 58(4), 594-604.
[4] Hjelm, L., & Dasori, W. (2012). Comprehensive food security and
vulnerability analysis: Focus on northern Ghana. Accra: World
Food Program, Ghana Statistical Service and Ministry of Food and Agriculture.
[5] Loewe, M., & Rippin, N. (2015). The Sustainable Development Goals of the Post-2015 Agenda: Comments on the OWG and SDSN Proposals.
[6] World Food Program (WFP), (2009). World Hunger Series:
Hunger and Markets. London, Sterling (VA): Earthscan.
[7] Demi, S., Amegashie D. P. K, & Kuwornu, J. K. M. (2013). Analysis of food security status of farming households in the forest belt of the Central Region of Ghana. Russian Journal of
Agricultural and Socio-Economic Sciences, 13(1).
[8] Ghana Statistical Service (GSS). (2014). 2010 Ppulation and
Housing Census, District Analytical Aeport, North Tongu District.
Accra: Ghana Statistical Service.
[9] Minot, N., Epprecht, M., Anh, T. T. T., & Trung, L. Q (2006). Income diversification and poverty in the Northern Uplands of Vietnam. Research report. International Food Policy Research
Institute (IFPRI), Washington DC.
[10] Asfaw, S., McCarthy, N., Paolantonio, A., Cavatassi, R., Amare, M., & Lipper, L. (2015). Livelihood diversification and
vulnerability to poverty in rural Malawi (ESA Working Paper No.
15-02). Rome: FAO.
[11] Asuming-Brempong, S., & Osei-Asare, Y. B. (2007). Has imported rice crowded-out domestic rice production in Ghana? What has been the role of policy? African Association of Agricultural Economists (AAAE) Conference Proceedings. Accra.
Ghana.
[12] Yamane, T. (1967). Elementary Sampling Theory. Englewood Cliffs, New Jersey, Prentice-Hall.
[13] Indicator guide: Food and Nutrition Technical Assistance Project,
Academy for Educational Development. Washington, DC
[14] Birhane, T., Shiferaw, S., Hagos, S., & Mohindra, K. S. (2014). Urban food insecurity in the context of high food prices: a community based cross sectional study in Addis Ababa, Ethiopia.
BMC Public Health, 14(1).
[15] Scoones, I. (1998). Sustainable Rural Livelihoods: a framework for analysis (IDS Working Paper No. 72). University of Sussex. [16] Department for International Development. (1999). Sustainable
Livelihoods Framework. London: DFID.
[17] Benson, T., Mugarura, S., & Wanda, K. (2008). Impacts in Uganda of rising global food prices: the role of diversified staples and limited price transmission. Agricultural Economics, 39(1), 513-524.
[18] Hoddinott, J., & Yohannes, Y. (2002). Dietary diversity as a food security indicator. Food consumption and nutrition division discussion paper, 136, 2002.
searching, screening and signalling. Research Policy, 35(2), 309-323.
[20] Newman, C., & Canagarajah, S. (2000). Gender, poverty, and nonfarm employment in Ghana and Uganda. World Bank Policy
Research Working Paper, (2367).
[21] Ahmed, F. F. (2012). Income diversification determinants among farming households in Konduga, Borno State, Nigeria. Academic
Research International, 2(2), 555.
[22] Man, N. (2009). Factors affecting the decision making in off farm employment among paddy farmers in Kemasin Semerak.
Pertanika Journal of Social Sciences & Humanities, 17(1), 7-15.
[23] Teshome, B., & Edriss, A. K. (2013). Determinants and patterns of income diversification among smallholder farmers in Akaki district, Ethiopia. Journal of Research in Economics and
International Finance (JREIF) 2(4), 68-78.
[24] Idowu, A. O., Ambali, O. I., & Onasanya, A. S. (2014). Living condition, livelihood and crop diversification among rural farm households in remo division of Ogun State, Nigeria. Asian Journal
of Agricultural Extension, Economics and Sociology, 3(6),
619-629.
[25] Escobal, J. (2001). The determinants of non-farm income diversification in rural Peru. World Development, 29(3), 497-508. [26] Aidoo, R., Mensah, J. O., & Tuffour, T. (2013). Determinants of
household food security in the Sekyere Afram plains district of Ghana. European Scientific Journal, ESJ, 9(21).
[27] Akaakohol, M. A., & Aye, G. C. (2014). Diversification and farm household welfare in Makurdi, Benue State, Nigeria. Development
Studies Research. An Open Access Journal, 1(1), 168-175.
[28] Jolly, P., Jiang, Y., Ellis, W., Awuah, R., Nnedu, O., Phillips, T., & Williams, J. (2006). Determinants of aflatoxin levels in Ghanaians: sociodemographic factors, knowledge of aflatoxin and
food handling and consumption practices. International Journal of
Hygiene and Environmental Health, 209(4), 345-358.
[29] Schönfeldt, H. C., & Hall, N. G. (2012). Dietary protein quality and malnutrition in Africa. British Journal of Nutrition, 108(S2), S69-S76.
[30] Thiele, S., & Weiss, C. (2003). Consumer demand for food diversity: evidence for Germany. Food Policy, 28(2), 99-115. [31] Owusu, V., Abdulai, A., & Abdul-Rahman, S. (2011). Non-farm
work and food security among farm households in Northern Ghana. Food Policy, 36(2), 108-118.
[32] Najafi, B. (2003). An overview of current land utilization systems and their contribution to agricultural productivity in Report of the APO Seminar on Impact of Land Utilization System on
Agricultural Productivity. Agricultural Productivity Organization
(APO), Iran.
[33] Stewart, H., & Harris, J. M. (2005). Obstacles to overcome in promoting dietary variety: the case of vegetables. Applied
Economic Perspectives and Policy, 27(1), 21-36.
[34] Ojogho, O. (2010). Determinants of Food Insecurity among Arable Farmers in Edo State, Nigeria. Agricultural Journal, 5(3), 151-156. Chicago.
[35] Gaiha, R., Kaicker, N., Imai, K., Kulkarni, V. S., & Thapa, G. (2012). Diet Diversification and Diet Quality in India: An Analysis
(No. DP2012-30). Research Institute for Economics & Business
Administration, Kobe University
[36] Thorne-Lyman, A. L., Valpiani, N., Sun, K., Semba, R. D., Klotz, C. L., Kraemer, K., & Bloem, M. W. (2010). Household dietary diversity and food expenditures are closely linked in rural Bangladesh, increasing the risk of malnutrition due to the financial crisis. The Journal of Nutrition, 140(1), 182S-188S.