Endothelial Function Assessed by Peripheral
Arterial Tonometry is not related to
Cardiovascular Risk Score in Healthy Subjects
Ylfa Run Sigurdardottir
1, Bylgja Run Stefansdottir
2, Thor Aspelund
1,2, Gudmundur Thorgeirsson
1,2,3,
Linda Bjork Kristinsdottir
1, Vilmundur Gudnason
1,2, Karl Andersen
1,2,31. Department of Health Sciences,University of Iceland, Reykjavík, 101 Iceland. 2. Icelandic Heart Association, Kópavogur, 203 Iceland.
3. Cardiovascular Research Center, Landspitali, the University Hospital of Iceland, Reykjavík, 101 Iceland.
Corresponding author:
Professor Karl Andersen MD PhD,
Department of Medicine, Division of Cardiology, Landspitali the University Hospital of Iceland, Reykjavík, 101 Iceland. Telephone: 354 543 1000,
Fax: 354 543 6467, E-mail: [email protected]
Cardiovascular disease (CVD) remains the leading cause of death and disability worldwide [1]. Although the main risk factors for developing CVD have been known for decades, risk prediction models need to be refined in order to improve their capacity in discriminating true high-risk from low-risk individuals.
This is illustrated by the fact that most cases of first myocardial infarction stem from the large group of the population classified as intermediate- or low risk in any modern risk prediction calculator [2]. This knowledge catalyzes a search for novel risk factors to improve CV risk assessment. Measurement of endothelial
* Corresponding author. E-mail: [email protected]
Highlights
Background
The majority of first cases of myocardial infarction stem from those classified as intermediate- or low-risk in CV risk prediction calculators. Risk prediction models need to be refined in their capacity to discriminate high-risk from low-risk. Peripheral arterial tonometry (PAT) is a non-invasive method to assess peripheral endothelial function that could potentially improve primary prevention of CVD.
Design
We investigated the relation of PAT results to CV risk factors and risk score in a healthy cohort.
Methods
PAT measurements were performed on 102 individuals, with no previous history of CAD, attending a Risk Preventive Clinic. Traditional CV risk factors were evaluated and integrated into a CV risk score calculator. Outcome was expressed as absolute and relative 10-year risk of developing CVD.
Results
PAT results of reactive hyperemia index (RHI) and augmentation index (AI) had no statistically significant relation to risk score while baseline pulse amplitude was positively correlated with both absolute (p = 0.02) and relative (p = 0.02) 10-year risk of developing CVD. Among CV risk factors only heart rate was significantly associated with RHI (r = - 0.24, R2 = 0.06, p = 0.01). AI and baseline pulse amplitude both correlated with several risk factors.
Conclusions
Endothelial dysfunction, measured by PAT, was not associated with an increased 10-year risk of developing CVD. The relation between endothelial dysfunction and established CV risk factors was limited. Further clinical end point studies are needed to fully comprehend the diagnostic and predictive value of PAT measurements in healthy subjects.
Keywords: Primary prevention, Endothelial function, Peripheral arterial tonometry, Reactive hyperemia index, Augmentation index, Baseline pulse amplitude, CV risk factors, CV risk score
Citation: Sigurdardottir Y, Stefansdottir B, Aspelund T et al Endothelial function assessed by peripheral arterial tonometry is not related to cardiovascular risk score in healthy subjects. International Cardiovascular Forum Journal 2016;9:21-26 DOI:10.17987/icfj.v9i0.385
function is not part of routine risk assessment but as loss of endothelial integrity has a role in all stages of atherosclerosis and is commonly seen in connection with several CV risk factors [3], it could be considered one of the first signs of CV disease. Insight into events in this innermost layer of the arterial wall could provide valuable information in primary prevention of CVD.
In recent years peripheral arterial tonometry (PAT) has been gaining reputation as a non-invasive approach to assess peripheral microvascular endothelial function. Earlier studies applying arterial tonometry have revealed a relation between peripheral endothelial dysfunction and coronary endothelial dysfunction as well as severity of CAD [4, 5]. Endothelial dysfunction according to PAT has also been connected to several CV risk factors, however with somewhat conflicting results [6-9]. Limited data is available on the relation between arterial tonometry and global CV risk score.
The aim of this study was twofold. First, to evaluate the relation between results of arterial tonometry and established CV risk factors. Secondly, to investigate whether results of PAT measurements were related to outcome in a global CV risk score calculator among healthy individuals with no previous history of coronary artery disease (CAD).
Material and Methods
Participants
One hundred and two individuals, with no previous history of CAD, attending the Risk Preventive Clinic of the Icelandic Heart Association (IHA) were consecutively studied. All subjects provided written informed consent before any study related procedures were performed. The design and conduct of the study was in accordance with the general principles outlined in the Declaration of Helsinki [10], and adhered to principles of Good Clinical Practice. The study protocol was approved by the Icelandic National Bioethics Committee.
Risk assessment
The Risk Preventive Clinic is a self-referral service, provided by the IHA. Risk assessment is applied based on data from the Reykjavik Study, a longitudinal epidemiologic study of CVD risk factors and CV events in the Icelandic population during the last four decades. The risk prediction calculator is a web based tool (http://risk.hjarta.is/risk_calculator/) taking into consideration the following established CV risk factors: age, gender, BMI, systolic blood pressure, total cholesterol, HDL cholesterol, triglycerides, physical activity, smoking, diabetes and family history of coronary heart disease. It provides the absolute predicted likelihood of developing CV endpoints (myocardial infarction, percutaneous coronary intervention or bypass surgery) within the next ten years as well as the relative risk, a ratio of predicted 10-year CVD risk compared to the mean value of physically active non-smokers of the same age and sex category. An absolute risk score above 10% was considered high-risk. The risk calculator has been calibrated against the SCORE risk chart of the European Society of Cardiology and showed an almost perfect correlation [11].
Peripheral arterial tonometry
Measurements of peripheral endothelial function by arterial tonometry were performed using the EndoPAT 2000 device (Itamar Medical, Caesarea, Israel). All measurements were performed by the same investigator, in a quiet, dimly lit room
with the temperature held at 22-24 °C. Study procedures were performed in the morning after an overnight fast. Individuals having ingested food, caffeinated drinks, medication or used any form of tobacco since the night before were excluded. Further exclusion criteria included Raynaud´s phenomenon or a previous history of radical mastectomy.
Subjects were lying in a supine position during the course of the measurement. After measuring blood pressure, probes were placed on the subject’s index fingers. These probes are lined with rubber chambers inflated through pneumatic tubes connecting them to the EndoPAT device. The probes apply constant pressure on the finger 10 mmHg below diastolic pressure and sense counter pressure from the finger reflecting pulsatile volume changes. The plethysmographic measurements by the probes are processed in computer software and presented on screen as waves of pulsation.
After seven minutes of baseline measurements at steady state, a sphygmomanometer cuff around the upper non-dominant arm was inflated to apply 300 mmHg pressure. High pressure was used to prevent insufficient occlusion of blood flow and leakage. Once this occlusion had been held for five minutes the pressure was released. The NO dependent reactive hyperemia following blood deprivation was reflected by changes in pulse wave amplitude and measured for seven minutes.
The data was analyzed with an automated computer algorithm and the main result expressed as reactive hyperemia index (RHI). RHI is a calculated ratio comparing the pulse wave amplitude during reactive hyperemia to that of the baseline measurement. This ratio for the non-dominant arm measured is divided with the same ratio for the dominant arm giving the final RHI ratio. The dominant arm is thus used in controlling for any systemic effects the PAT measurement might have. RHI values below 1.67 were interpreted as signs of endothelial dysfunction in accordance with the manufacturer [12].
Additional PAT results investigated were baseline pulse amplitude and augmentation index (AI). Baseline pulse amplitude reflects the average amplitude of pulse waves during baseline measurement [12]. The magnitude of baseline pulse amplitude is mainly governed by vascular distensibility and digital blood flow [13]. A value of just below 2000 units corresponds to a 1mmHg pressure change sensed by the probes during a pulsatile wave of blood. Augmentation index is a measure of arterial stiffness and is calculated by waveform analysis of the PAT signal [12, 14-16]. The value of AI is corrected for a heart rate of 75 beats per minute as heart rate can affect the pulse waveform [12, 17]. A lower AI value is preferred indicating better arterial elasticity [12, 14, 16].
Statistical analysis
risk factors were analyzed in relation to PAT results: age, gender, systolic and diastolic blood pressure, heart rate, height, weight, BMI, waist circumference, fat percentage, fasting glucose, total cholesterol, LDL cholesterol, HDL cholesterol, triglycerides, total/HDL cholesterol, smoking and a sedentary lifestyle. Former diagnosis of high blood pressure, diabetes, dyslipidemia and stroke were also investigated in relation to PAT results as well as a 1st degree family history of CAD.
Variables with non-normal distribution were logarithmically transformed before statistical analysis. Linear regression was used to test the relationship of numeric variables to RHI, baseline pulse amplitude and AI. A t-test and analysis of variance (ANOVA) were used to test the relation of PAT results to categorical variables. RHI results were categorized above or below 1.67. A t-test was used to examine whether there was a significant difference in median risk score and risk factors between categories of RHI results. To explore if a relation could be found between the categorical variable of RHI results and other categorical variables a Fisher exact test was applied. Finally a multivariate analysis was performed including all risk factors having a linear relation to RHI, baseline pulse amplitude or AI. Also included in the multivariate analysis was whether participants were taking medication for hypertension or high cholesterol to control for possible confounding effects. In all analysis a two-sided p-value of < 0.05 was considered to indicate statistical significance.
Results
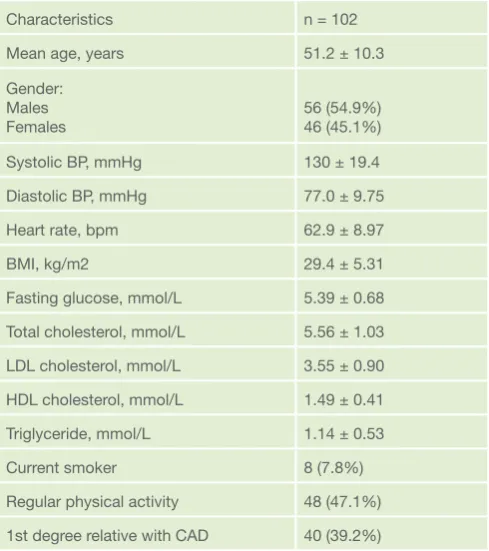
The baseline characteristics of the 102 study participants are shown in Table 1. Mean age was 51.3 years ranging from 23 to 75 years and 45.1% were female. Mean BMI was 29.4
kg/m2, 35.3% were obese (BMI > 30 kg/m2) and 7.8% were current smokers. Furthermore, 21.6% had been diagnosed with hypertension, 2% had previously diagnosed diabetes, 21.6% were diagnosed with dyslipidemia and 39.2% had a first-degree relative with coronary artery disease.
Results of PAT measurements and predicted risk of suffering a CV endpoint are presented in Table 2. The mean and median RHI were 2.4 and values ranged from 1.20 to 4.02. RHI values did not differ significantly between sexes (Table 2). Fifteen percent of the 102 participants had a RHI value below 1.67 and were defined as having peripheral endothelial dysfunction. No difference was found in the proportion of endothelial dysfunction according to traditional risk factors or CV risk score. Subjects with RHI values below 1.67 did however have a significantly higher mean baseline pulse amplitude (p = 0.03). Also, males had significantly larger baseline pulse amplitude while women had a higher AI value (Table 2).
The mean absolute 10-year risk of suffering a CV endpoint was 5.19% (Table 2). The majority of subjects had low risk, the median being 3.06% and the first and third quartiles being 0.97% and 9.67% respectively. The mean predicted 10-year CV risk among females was 1.86%, significantly lower than the mean year risk of 8.08% among males (p = 1.21 x 10⁻¹²) (Table 2). Twenty-five percent of the cohort had CV risk higher than 10% and were defined as high-risk individuals. Of these 23 were male and 1 was female. The mean relative risk was 2.00 (Table 2), i.e. the average participant had twice the risk of experiencing a CV endpoint within the next 10 years compared to age and gender matched individuals with a favorable risk profile.
The correlation between PAT results and CV risk factors is presented in Table 3. Among these, only heart rate had a statistically significant linear relation to the RHI result (r = - 0.24, R2 = 0.06, p = 0.01). A significant positive correlation was found between baseline pulse amplitude and male gender, systolic blood pressure, BMI, body weight, fasting glucose, total/HDL cholesterol and current or previous smoking. Baseline pulse amplitude was negatively correlated with level of regular physical Table 1. Baseline characteristics of study population
Characteristics n = 102
Mean age, years 51.2 ± 10.3
Gender: Males
Females 56 (54.9%)46 (45.1%)
Systolic BP, mmHg 130 ± 19.4
Diastolic BP, mmHg 77.0 ± 9.75
Heart rate, bpm 62.9 ± 8.97
BMI, kg/m2 29.4 ± 5.31
Fasting glucose, mmol/L 5.39 ± 0.68 Total cholesterol, mmol/L 5.56 ± 1.03 LDL cholesterol, mmol/L 3.55 ± 0.90 HDL cholesterol, mmol/L 1.49 ± 0.41 Triglyceride, mmol/L 1.14 ± 0.53
Current smoker 8 (7.8%)
Regular physical activity 48 (47.1%) 1st degree relative with CAD 40 (39.2%)
BP blood pressure, mmHg millimeters of mercury, bpm beats per minute, BMI body mass index, kg kilograms, m2 square meters, mmol millimolar, LDL low-density lipoprotein, HDL high-density lipoprotein, CAD coronary artery disease. Data is presented as mean ± SD or number (%).
Table 2. Results of PAT measurements and risk prediction PAT
results All Male Female P-value
RHI 2.39 ± 0.60 2.39 ± 0.54 2.39 ± 0.66 1.00 AI, % 7.25 ± 17.1 0.91 ± 16.9 15.0 ± 14.0 1.28 x 10⁻⁵ Baseline
pulse
amplitude 704 ± 354 772 ± 356 621 ± 336 0.03 Absolute
10-year
risk, % 5.19 ± 5.42 8.08 ± 5.69 1.86 ± 2.31 1.21 x 10⁻¹² Relative
risk 2.00 ± 1.07 1.90 ± 0.90 2.10 ± 1.24 0.46
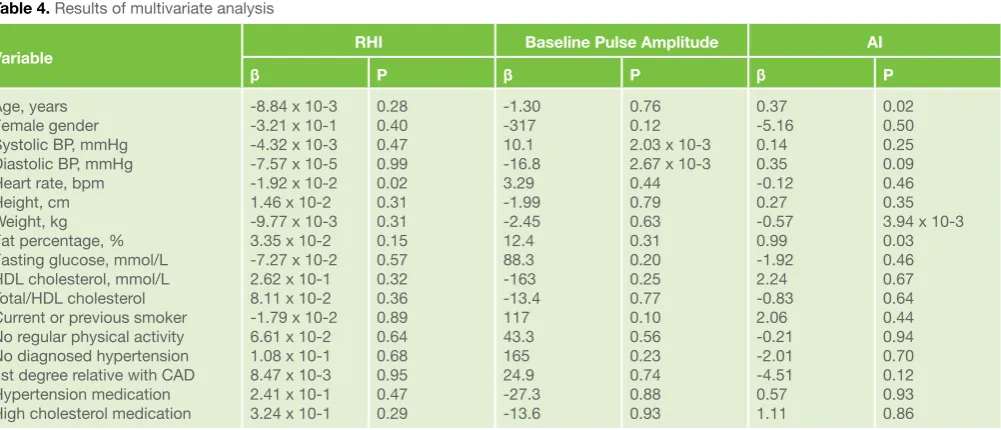
activity and HDL cholesterol. AI was positively correlated with female gender, age, systolic and diastolic blood pressure, body weight, fat percentage, HDL cholesterol, diagnosed hypertension and having a first-degree relative with CAD. A negative correlation was found between AI and height as well as total/HDL cholesterol. In multivariate analysis RHI showed a significant correlation to heart rate, mean baseline pulse amplitude to systolic and diastolic blood pressure and AI to age, body weight and fat percentage (Table 4). Taking medication for hypertension was correlated to a significantly higher AI index (Table 3).
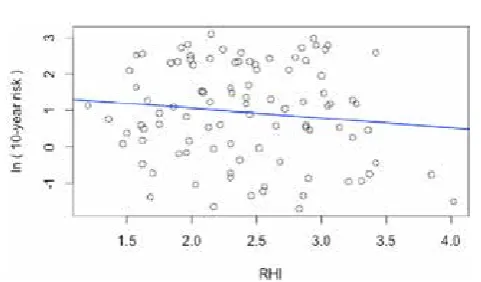
The correlation of RHI to predicted CV risk score is presented in figure 1. No statistically significant linear relation could be found between RHI and predicted 10-year risk of CV disease (p = 0.24) (Figure 1). Individuals with RHI values below 1.67 did not have a higher risk score than those with RHI above 1.67 (p = 0.80). There was no correlation between RHI and relative risk, neither a linear correlation, (p = 0.86), nor were RHI values below 1.67 related to a higher relative risk (p = 0.63). Baseline pulse amplitude was positively related to 10-year predicted CV disease risk (p = 0.02). Furthermore, there was a positive Table 3. Linear relation of PAT results to CV risk factors
Variable RHI Baseline Pulse Amplitude AI
β P β P β P
Age, years Gender
Systolic BP, mmHg Diastolic BP, mmHg Heart rate, bpm Height, cm Weight, kg BMI, kg/m2
Waist circumference, cm Fat percentage, % Fasting glucose, mmol/L Total cholesterol, mmol/L LDL cholesterol, mmol/L HDL cholesterol, mmol/L Triglyceride, mmol/L Total/HDL cholesterol Current or previous smoker Regular physical activity Diagnosed hypertension Diagnosed diabetes Diagnosed hyperlipidemia History of stroke
1st degree relative with CAD Hypertension medication High cholesterol medication
-0.005 0.0005 -0.35 -0.58 -0.02 0.005 -9.27 x 10⁻⁵ -0.005 -0.001 -0.0004 -0.06 -0.004 -0.03 0.06 0.03 -0.002 0.01 0.04 0.09 -0.16 -0.13 0.05 0.03 -0.03 0.14 0.35 1.00 0.42 0.22 0.01 0.48 0.98 0.63 0.86 0.94 0.53 0.94 0.69 0.69 0.84 0.96 0.93 0.75 0.52 0.71 0.38 0.93 0.83 0.87 0.59 2.44 -152 485 -41.2 1.44 5.71 5.18 12.9 5.28 1.31 149 -0.46 35.4 -235 125 63.6 137 157 3.87 -211 -110 -422 -14.9 63.6 144 0.48 0.03 0.05 0.89 0.72 0.13 0.01 0.05 0.07 0.72 3.44 x 10⁻³ 0.99 0.37 6.14 x 10⁻³ 0.13 0.04 0.05 0.02 0.96 0.41 0.20 0.24 0.84 0.52 0.34 0.83 14.1 55.3 43.7 0.02 -0.73 -0.30 -0.30 -0.08 0.54 -1.13 2.68 0.26 15.9 0.59 -3.15 2.84 -1.97 -10.4 3.59 -2.17 -17.0 -10.4 15.1 -0.07
8.51 x 10⁻⁸ 1.78 x 10⁻⁵ 2.03 x 10⁻⁶ 1.17 x 10⁻³ 0.92 3.26 x 10⁻⁵ 1.77 x 10⁻³ 0.35 0.59 1.61 x 10⁻³ 0.65 0.10 0.89 9.22 x 10⁻⁵ 0.88 0.03 0.41 0.56 0.01 0.77 0.60 0.32 2.32 x 10⁻³ 1.32 x 10⁻³ 0.99
RHI reactive hyperemia index, AI augmentation index, BP blood pressure, mmHg millimeters of mercury, bpm beats per minute, cm centimeters, kg kilograms, BMI body mass index, m2 square meters, mmol millimolar, LDL low-density lipoprotein, HDL high-density lipoprotein, CAD coronary artery disease. Calculations with triglycerides, systolic and diastolic blood pressure were performed with the variables on a logarithmic scale.
Table 4. Results of multivariate analysis
Variable RHI Baseline Pulse Amplitude AI
β P β P β P
Age, years Female gender Systolic BP, mmHg Diastolic BP, mmHg Heart rate, bpm Height, cm Weight, kg Fat percentage, % Fasting glucose, mmol/L HDL cholesterol, mmol/L Total/HDL cholesterol Current or previous smoker No regular physical activity No diagnosed hypertension 1st degree relative with CAD Hypertension medication High cholesterol medication
-8.84 x 10⁻³ -3.21 x 10⁻¹ -4.32 x 10⁻³ -7.57 x 10⁻⁵ -1.92 x 10⁻² 1.46 x 10⁻² -9.77 x 10⁻³ 3.35 x 10⁻² -7.27 x 10⁻² 2.62 x 10⁻¹ 8.11 x 10⁻² -1.79 x 10⁻² 6.61 x 10⁻² 1.08 x 10⁻¹ 8.47 x 10⁻³ 2.41 x 10⁻¹ 3.24 x 10⁻¹
0.28 0.40 0.47 0.99 0.02 0.31 0.31 0.15 0.57 0.32 0.36 0.89 0.64 0.68 0.95 0.47 0.29 -1.30 -317 10.1 -16.8 3.29 -1.99 -2.45 12.4 88.3 -163 -13.4 117 43.3 165 24.9 -27.3 -13.6 0.76 0.12 2.03 x 10⁻³ 2.67 x 10⁻³ 0.44 0.79 0.63 0.31 0.20 0.25 0.77 0.10 0.56 0.23 0.74 0.88 0.93 0.37 -5.16 0.14 0.35 -0.12 0.27 -0.57 0.99 -1.92 2.24 -0.83 2.06 -0.21 -2.01 -4.51 0.57 1.11 0.02 0.50 0.25 0.09 0.46 0.35 3.94 x 10⁻³ 0.03 0.46 0.67 0.64 0.44 0.94 0.70 0.12 0.93 0.86
correlation between baseline pulse amplitude and relative risk (p = 0.02). AI was neither correlated with absolute risk score (p = 0.59), nor relative risk (p = 0.14).
Discussion
The main findings of this study were that RHI and AI had no statistically significant linear relation to a comprehensive risk score while baseline pulse amplitude was positively correlated with risk score predicting either absolute or relative 10-year risk of CV endpoints. No relation of statistical significance was found between RHI and CV risk factors apart from heart rate. AI as well as baseline pulse amplitude had a correlation to several CV risk factors (Table 2).
Although several earlier studies have investigated the relation of PAT results to CV risk factors [6-9], they have provided conflicting results and study populations have varied. Data relating PAT results to comprehensive risk profiles is scarce, particularly with respect to baseline pulse amplitude and augmentation index. The present study offers insight into these issues in a healthy primary prevention cohort without known CV disease. To our knowledge it is the first to publish results of AI derived from PAT and it’s relation to a risk score predicting 10-year risk of CV endpoints.
RHI value
In light of earlier studies it was to be expected that around 15% of the cohort would have RHI below 1.67. A study performed by Syvänen et al was conducted on subjects with hypertension, newly diagnosed glucose disorders, metabolic syndrome, obesity, or a 10-year risk of CVD death of 5% or more according to SCORE [18]. In that study cohort 23% had an RHI value below 1.67, a somewhat larger proportion than in the present study. In individuals presenting with chest pain without angiographic coronary lesions and patients with chronic CAD the prevalence of endothelial dysfunction was 33% and 46%, respectively [19], both substantially higher than the 15% in our results of previously healthy individuals.
The mean RHI value of 2.4 compares well with the value of 2.3 found by Lind in a population-based study and with the value of 2.4 among individuals without CAD in a study by Kuvin [5, 20]. Other studies have revealed different results. In a study by Ferré et al on healthy intermediate to high-risk individuals free of CVD the median RHI was 1.7 [21], considerably lower than the value of 2.4 found in the present study.
PAT results and risk factors
The relation between PAT results and CV risk factors has been investigated in many different cohorts with conflicting results. Our results showing a negative correlation between heart rate and RHI values is in accordance with some earlier studies [8, 22]. Others have found this correlation to be reversed [7]. Lack of a reported correlation between these factors has also been seen in earlier studies as well as a correlation between RHI and numerous other CV risk factors not found in the present study [6, 9, 21, 23-25].
Fewer studies have published results on the relation of baseline pulse amplitude and AI to established CV risk factors. A relation between baseline pulse amplitude and male gender, systolic blood pressure, BMI, fasting glucose, total/HDL cholesterol and smoking status has been previously reported [6, 9]. This study is the first to report baseline pulse amplitude correlating with HDL, body weight and lack of regular physical activity. A relation between AI and female gender, age and height has been formerly reported [26-29]. AI correlating to peripheral systolic blood pressure, diastolic blood pressure, body weight, fat percentage, HDL cholesterol, total/ HDL cholesterol, diagnosed hypertension and a 1st degree family history of CAD has not been published prior to this report.
PAT results and risk score
Though data concerning the relation between RHI results and risk score are scarce the subject has been investigated in CAD patients, high-risk individuals and population-based cohorts. In a cohort of high-risk individuals, of whom 83.7% had CAD, Matsuzawa et al found no statistically significant correlation between RHI values and Framingham risk score (FRS) [30]. Lind demonstrated that RHI had no significant relation to the FRS in a population-based cohort of 50-year-old individuals [20]. Schnabel et al presented similar results with no significant relation between RHI and SCORE in a large, unselected, population-based cohort [9]. Truschel et al, studying a cohort where 5% had CHD, found no statistically significant correlation between RHI and FRS [25]. While our results are in concordance with these studies, we included a non-selected cohort of a wide age range and with no previous history of CAD, attending a risk preventive clinic.
Lack of a correlation between RHI values and 10-year risk score clearly shows that a comprehensive risk profiling, although known to predict the risk of cardiovascular events, does not associate with microvascular endothelial function also known to predict future cardiac events [31]. The risk associations seem to be dependent on different pathophysiological mechanisms suggesting a possible role for endothelial dysfunction in further improving CV risk assessment. It could be argued that if a complete linear correlation was found between RHI and risk score the EndoPAT measurements had little to add to the present risk evaluation. Thus, present results in line with earlier studies imply that PAT measures a physiological mechanism distinct from the basis of present risk assessment, perhaps a risk factor previously unknown. A prospective longitudinal study is required to determine whether endothelial function assessed with PAT adds to the risk profiling currently offered by comprehensive measurement of established risk factors.
Less data is available on the relation between risk score and additional results of PAT measurements, baseline pulse amplitude and AI. However, in agreement with the results presented in this paper, Schnabel et al have demonstrated that baseline pulse Figure 1 Relation of RHI to 10-year risk of CV disease. Risk
amplitude had a significant connection to risk score [9]. No previous data exists on the relation of augmentation index to 10-year risk of CVD. Fischer-Rasokat et al did however demonstrate that AI had no statistically significant relation to SMART score [26], a 10-year recurrent vascular event risk score [32]. Contrary to abovementioned studies and present results on 10-year risk of CVD they also encountered a relation between RHI and 10-year recurrent vascular event risk [26].
Limitations
This study had certain limitations. The study sample was rather small but larger than several earlier studies on the relation of PAT and CVD risk factors [4, 5, 15, 16, 33]. Information on the subjects’ previous medical history included CVD risk factors such as hypertension, diabetes and hyperlipidemia but did not include other possible influencing factors on endothelial function, for example peripheral arterial disease, rheumatic diseases and autonomic dysfunction. Participants were Caucasian of European origin and there is no guarantee that these findings apply to other ethnicities. Since the study group consisted of individuals between the age of 23 and 75 years, assertions cannot be made about the relation of PAT results to CV risk among children, adolescents and elderly individuals. The study was cross-sectional, only collecting data from each participant at one specific point in time. It does not offer any ground for assumptions on causation between PAT results and risk factors or risk score.
Conclusions
In conclusion, a low RHI value indicative of peripheral microvascular endothelial dysfunction was not associated with an increased risk of developing CVD within the next ten years. The relation between endothelial dysfunction and established CV risk factors was limited. Further clinical end point studies are needed to fully comprehend the diagnostic and predictive value of PAT measurements in healthy subjects.
Declarations of Interest
The authors declare no conflicts of interest.
Acknowledgements
The authors state that they abide by the requirements for ethical publishing in biomedical journals.
References
1. World Health Organization, World Health Organization. Global Health Estimates 2014 Summary Tables: Death by cause, age and sex, by WHO region, 2000-2012. 2014, Geneva, WHO: Geneva, Switzerland.
2. Rose, G., Sick individuals and sick populations. Int J Epidemiol, 2001. 30(3): p. 427-32; discussion 433-4. doi: 10.1093/ije/14.1.32
3. Behrendt, D. and P. Ganz, Endothelial function: From vascular biology to clinical applications. The American Journal of Cardiology, 2002. 90(10, Supplement 3): p. L40-L48. doi: 10.1016/S0002-9149(02)02963-6 4. Bonetti, P.O., et al., Noninvasive identification of patients with early
coronary atherosclerosis by assessment of digital reactive hyperemia. J Am Coll Cardiol, 2004. 44(11): p. 2137-41. doi: 10.1016/j.jacc.2004.08.062 5. Kuvin, J.T., et al., Assessment of peripheral vascular endothelial
function in the ambulatory setting. Vasc Med, 2007. 12(1): p. 13-6. doi: 10.1177/1358863X06076227
6. Hamburg, N.M., et al., Cross-sectional relations of digital vascular function to cardiovascular risk factors in the Framingham Heart Study. Circulation, 2008. 117(19): p. 2467-74. doi: 10.1161/CIRCULATIONAHA.107.748574 7. Konttinen, J., et al., Association between lowered endothelial function
measured by peripheral arterial tonometry and cardio-metabolic risk factors - a cross-sectional study of Finnish municipal workers at risk of diabetes and cardiovascular disease. BMC Cardiovasc Disord, 2013. 13: p. 83. doi: 10.1186/1471-2261-13-83
8. Okumura, K., et al., Small low-density lipoprotein cholesterol concentration is a determinant of endothelial dysfunction by peripheral artery tonometry in men. J Atheroscler Thromb, 2012. 19(10): p. 897-903. doi: 10.5551/jat.13243 9. Schnabel, R.B., et al., Noninvasive vascular function measurement
in the community: cross-sectional relations and comparison of methods. Circ Cardiovasc Imaging, 2011. 4(4): p. 371-80. doi: 10.1161/ CIRCIMAGING.110.961557
10. World Medical Association Declaration of Helsinki: ethical principles for medical research involving human subjects. JAMA, 2013. 310(20): p. 2191-4. 11. Aspelund, T., et al., Estimation of 10-year risk of fatal cardiovascular
disease and coronary heart disease in Iceland with results comparable with those of the Systematic Coronary Risk Evaluation project. Eur J Cardiovasc Prev Rehabil, 2007. 14(6): p. 761-8. doi: 10.1097/HJR.0b013e32825fea6d 12. Itamar Medical. EndoPAT 2000 Device User Manual. 2014 [cited 2015
10.apríl]; Available from: http://www.itamar-medical.com/images/Endo PAT 2000 Operation Manual - 10.08.14.pdf.
13. Nohria, A., et al., Role of nitric oxide in the regulation of digital pulse volume amplitude in humans. J Appl Physiol (1985), 2006. 101(2): p. 545-8. doi: 10.1152/japplphysiol.01285.2005
14. Hedetoft, M. and N.V. Olsen, Evaluation of endothelial function by peripheral arterial tonometry and relation with the nitric oxide pathway. Nitric Oxide, 2014. 42: p. 1-8. doi: 10.1016/j.niox.2014.07.003
15. Moerland, M., et al., Evaluation of the EndoPAT as a Tool to Assess Endothelial Function. Int J Vasc Med, 2012. 2012: p. 904141. doi: 10.1155/2012/904141
16. Sauder, K.A., et al., Test-retest reliability of peripheral arterial tonometry in the metabolic syndrome. Diab Vasc Dis Res, 2014. 11(3): p. 201-7. doi: 10.1177/1479164114525971
17. Wilkinson, I.B., et al., The influence of heart rate on augmentation index and central arterial pressure in humans. J Physiol, 2000. 525 Pt 1: p. 263-70. doi: 10.1111/j.1469-7793.2000.t01-1-00263.x
18. Syvanen, K., et al., Endothelial function in a cardiovascular risk population with borderline ankle-brachial index. Vasc Health Risk Manag, 2011. 7: p. 97-101. doi: 10.2147/VHRM.S17249
19. Toggweiler, S., et al., The prevalence of endothelial dysfunction in patients with and without coronary artery disease. Clin Cardiol, 2010. 33(12): p. 746-52. doi: 10.1002/clc.20836
20. Lind, L., Relationships between three different tests to evaluate endothelium-dependent vasodilation and cardiovascular risk in a middle-aged sample. J Hypertens, 2013. 31(8): p. 1570-4. doi: 10.1097/HJH.0b013e3283619d50 21. Ferre, R., et al., High-density lipoprotein cholesterol and apolipoprotein
A1 levels strongly influence the reactivity of small peripheral arteries. Atherosclerosis, 2011. 216(1): p. 115-9. doi: 10.1016/j. atherosclerosis.2011.01.039
22. Mulukutla, S.R., et al., Black race is associated with digital artery endothelial dysfunction: results from the Heart SCORE study. Eur Heart J, 2010. 31(22): p. 2808-15. doi: 10.1093/eurheartj/ehq295
23. Fitch, K.V., et al., Associations of cardiovascular risk factors with two surrogate markers of subclinical atherosclerosis: endothelial function and carotid intima media thickness. Atherosclerosis, 2011. 217(2): p. 437-40. doi: 10.1016/j.atherosclerosis.2011.04.009
24. Kuvin, J.T., et al., Assessment of peripheral vascular endothelial function with finger arterial pulse wave amplitude. Am Heart J, 2003. 146(1): p. 168-74. doi: 10.1016/S0002-8703(03)00094-2
25. Truschel, E., et al., High-throughput ambulatory assessment of digital reactive hyperemia: concurrent validity with known cardiovascular risk factors and potential confounding. Prev Med, 2009. 49(6): p. 468-72. doi: 10.1016/j.ypmed.2009.09.019
26. Fischer-Rasokat, U., et al., Microvascular dysfunction and pulse wave reflection characterize different vascular pathologies in patients at cardiovascular risk. Vasa, 2012. 41(3): p. 192-9. doi: 10.1024/0301-1526/a000185
27. Heffernan, K.S., et al., Peripheral augmentation index as a biomarker of vascular aging: an invasive hemodynamics approach. Eur J Appl Physiol, 2012. 112(8): p. 2871-9. doi: 10.1007/s00421-011-2255-y
28. Patvardhan, E., et al., Augmentation index derived from peripheral arterial tonometry correlates with cardiovascular risk factors. Cardiol Res Pract, 2011. 2011: p. 253758. doi: 10.4061/2011/253758
29. Yang, W.I., et al., Augmentation index association with reactive hyperemia as assessed by peripheral arterial tonometry in hypertension. Am J Hypertens, 2011. 24(11): p. 1234-8. doi: 10.1038/ajh.2011.132
30. Matsuzawa, Y., et al., Peripheral endothelial function and cardiovascular events in high-risk patients. J Am Heart Assoc, 2013. 2(6): p. e000426. doi: 10.1161/JAHA.113.000426
31. Rubinshtein, R., et al., Assessment of endothelial function by non-invasive peripheral arterial tonometry predicts late cardiovascular adverse events. Eur Heart J, 2010. 31(9): p. 1142-8. doi: 10.1093/eurheartj/ehq010 32. Dorresteijn, J.A., et al., Development and validation of a prediction rule
for recurrent vascular events based on a cohort study of patients with arterial disease: the SMART risk score. Heart, 2013. 99(12): p. 866-72. doi: 10.1136/heartjnl-2013-303640