Kathuria R et. al.| Sep.-Oct. 2016 | Vol.5| Issue 5|14-22 14
ISSN: 2278-3369 International Journal of Advances in Management and Economics
Available online at www.managementjournal.info
RESEARCH ARTICLE
Strategic Consensus in India vis-a-vis USA: A Comparative Study
Kathuria R*
1, Kohli TK
2, Kathuria NN
3, Porth, SJ
41Argyros School of Business and Economics, Chapman University, Orange, CA, USA.
2, 3 Actuate Business Consulting, India.
4Erivan K. Haub School of Business, Saint Joseph’s University, Philadelphia, PA, USA.
*For correspondence:E-mail:[email protected]
Abstract
Rapid growth in emerging world markets underscores the need to understand and compare manufacturing practices, capabilities, and priorities of such countries with those of the developed nations, such as the United States of America (USA). Studies of manufacturing strategy in emerging economies are relatively scarce, however, despite having a majority of the world’s population and an ever-increasing flow of foreign direct investment. This study first builds and tests hypotheses regarding the comparative competitive priorities of senior executives in India, a rapidly developing economy, vis-à-vis USA, a well-established economy. Next, hypotheses regarding relative strategic consensus due to prevailing culture—power distance and collectivism/individualism—are developed and tested. As expected, there are differences in perceived competitive priorities and strategic consensus due to country specific factors, such as the national culture.
Keywords: Manufacturing strategy, Competitive priorities, Strategic consensus, National Culture, India and USA.
Introduction
Differences in management practices and values around the world have been studied and debated for decades and are reflected in terms such as cross-cultural management and comparative management. Manufacturing strategy has been the focus of both academics and practitioners, but mainly in the developed economies [10]. “Every country and region represents a different context for manufacturing strategy. The local context …also includes(s) the social and cultural aspects of the country and region that impact manufacturing” [2]. There have been some studies of manufacturing strategy done in India [1,3, 4] and in Ghana, but none is a comparative study, that is, relative to a developed economy, such as the U.S.
The obligation to comprehend the manufacturing strategies in developing countries, such as India, and compare them to those of the U.S. is not only due to potential competition from those countries, but also the need to expand markets for American products (patents). Making a product in the U.S. and then exporting it no longer guarantees success or even survival [5]. They cite Boeing who claims that a foreign nation now buys their planes only on the condition that some work will be done in that country. Even medium-sized companies must
extend their operations globally as a result of swift increases in emerging world markets.
Hofstede’s research [6-8] asserts the importance of national culture in the practice of management. Management theories developed in the USA, he argues, do not necessarily translate well in other countries due to differences in culture. Hofstede maintains that “the idea that the validity of a (management) theory is constrained by national borders is more obvious in Europe, with all its borders, than in a huge borderless country like the USA” [9]. Flaherty [10] makes a similar point, emphasizing the impact of culture on the way managers communicate and in turn make operations decisions such as new product introduction, forecasting, scheduling, and quality management. Lindberg et al. also assert that “culture will have a profound impact on the decisions made in organizations, and thereby also on the strategies that evolve over time” [2]. Porter [11] also noted that different nations possess different competitive advantages due to their country-specific factors and external variables.
Kathuria R et. al.| Sep.-Oct. 2016 | Vol.5| Issue 5|14- 15 executives and manufacturing managers from a fast
developing economy-India, and compare them with those of their counterparts in the United States of America (USA). Specifically, we want to investigate if the manufacturing strategies in the two countries are affected by the prevailing cultures-power distance and collectivism/individualism.
Theory and Hypotheses
Manufacturing strategy, a functional level strategy, is informed by corporate and business strategies [12]. It outlines the basis of competition, also known as the competitive priorities, or the dimensions of manufacturing strategy, or the content of manufacturing strategy [13]. The term “competitive priorities” connotes manufacturers’ choice of planned or intended strengths in terms of low cost, flexibility, quality, and delivery [14, 15]. The four basic competitive priorities widely accepted in the manufacturing strategy literature are: cost, flexibility, quality and delivery.
Differences in perceived competitive priorities between countries have been observed in earlier multi-country studies. For example, Ferdows et al. [16], De Meyer et al. [17], Nakane [18], and Kim [19] based on the Manufacturing Futures Survey involving manufacturers in Western Europe, North America and Japan, observed differences in perceived competitive priorities in the three regions. Similarly, Voss and Blackmon [20] observed differences between Japanese and Western manufacturers. Flynn and Flynn [21] observed significant differences in patterns of capabilities (cost, volume/product flexibility, on-time/fast delivery, etc.) among five countries-Japan, Germany, Italy, England and USA. We contend that the emphasis placed on various competitive priorities-cost, flexibility, quality and delivery-varies from country to country depending upon various country-specific factors, including openness of the economy, global competitive pressures, economic development of the country, etc. Hence, we anticipate differences in perceived competitive priorities between India and the USA as explained below.
Indian firms’ exposure to international competitive practices via imports and multinational companies in the domestic market has increase as a result of the economic reforms initiated in India in 1991. Owing to such pressures, they also need to be more proactive and responsive [22]. Nagabhushana and Shah [3] observed the top three competitive priorities of Indian manufacturers to be cost, quality and delivery respectively. The objectives relating to flexibility were at the bottom of the list.
They, however, expected quality and delivery to take priority over cost in the minds of Indian managers with the passage of time, as was observed in the USA by Ferdows et al. [23]. Dangayach and Deshmukh [24] conducted an in-depth study of three Indian manufacturing firms and noted that quality was among the top competitive priorities for all three firms, cost and delivery for two of the three firms, and product flexibility for only one of the three firms. Later, Dangayach and Deshmukh [4], based on a broader sample, were able to generalize their earlier finding that the Indian companies were placing the most importance on quality and the least importance on flexibility.
The Foreign Direct Investment (FDI) in India has increased rapidly over the years. The location of manufacturing facilities is chosen not only to save costs, which is a function of lower wages, access to needed materials, and taxes, but also assuming that the facility can compete in the global economy on the basis of quality. While cost is an important strategic priority in any manufacturing environment, products that fail to meet quality requirements do not sell, regardless of their cost/price. Achieving quality standards is a necessary condition for competing in the global economy, and therefore is the most important competitive priority.
In a recent study involving the USA plants, Flynn and Flynn [21] observed a small number of plants with cumulative capabilities based on quality despite the popularity of many quality management programs in the USA in the last two decades. They remarked that “Plants in the U.S. are often eager to try every new approach…” and noted the trend that the USA plants more often emphasized dependability and flexibility, which they attributed to the increased use of Just-in-Time. Thus, in reference to the USA, we propose the following with respect to the emphasis on cost, flexibility, delivery and quality in India.
H1a. Senior executives in India place higher
emphasis on cost than their counterparts in the USA.
H1b. Senior executives in India place lower
emphasis on flexibility than their counterparts in the USA.
H1c. Senior executives in India place lower
emphasis on delivery than their counterparts in the USA.
H1d. Among senior executives, the emphasis on
Kathuria R et. al.| Sep.-Oct. 2016 | Vol.5| Issue 5|14- 16 Strategic Consensus and National Culture:
India vis-à-vis USA.
Strategic consensus is believed to occur when employees at different hierarchical levels within an organization agree on the relative importance of competitive priorities, such as cost, delivery, quality and flexibility [14,25]. Skinner [26] conceptualized the need for strategic consensus or alignment of priorities across hierarchical levels-corporate, business, and functional. Theoretically, if there is perfect communication among managers at various levels across the organization, there should be no difference in their perception of the importance attached to various competitive priorities in their organization. However, within an organization, differences have been observed between managers at different hierarchical levels in the relative importance attached to a competitive priority. For example, Swamidass [27] found a lack of consensus between CEOs and manufacturing managers in that, while chief executives emphasized quality and technology, manufacturing managers stressed cost and the keeping of delivery promises. Similarly, Boyer and McDermott [25] observed a lack of consensus between managers and operators, whereas Kathuria et al. [13] observed a statistically significant lack of consensus between the two levels of managers. Menda and Dilts [28] observed how managers from various functional areas viewed that company’s strategy differently.
Based on the above literature, we expect lack of strategic consensus in organizations to be a universal phenomenon, but we contend that the magnitude of difference is moderated by the national culture. In general, we expect the lack of consensus between manufacturing managers and senior executives in the USA will be higher than that of Indian managers. Such differences may be attributed to the differences in cultural perspectives [29]. These expectations are based on the research of Hofstede [7, 9] who has completed a series of studies on the impact of national cultural on the practice of management. Hofstede’s model is considered the most comprehensive framework of national cultural values for studying business culture, yet its validity and its limitations have been criticized [30]. Hofstede has identified five dimensions of national culture that help to explain the differences in how management is practiced around the world. Two of his cultural dimensions are of particular relevance in this study-power distance and individualism. Since we are not using Hofstede’s framework to assess cultures of participating organizations from the two countries but rather using his overall findings of cultural differences between the two countries of our interest, we trust the limitations of his framework don’t affect this study in any significant way. Based on Hofstede’s findings, Table 1 provides data on the cultural dimensions for the USA and India.
Table 1: Cultural positioning based on hofstede (1993)
Cultural dimension USA India
Power Distance 40 L 77 H
Individualism 91 H 48 M
H = top third, M = medium third, L = bottom third (ranking among 50 countries)
Individualism is the degree to which people in a country prefer to act as individuals rather than as members of a collective group [7]. A key cultural difference between Indians and Americans according to the work of Hofstede is with respect to individualism versus collectivism. The data suggests that Americans prize individualism while Indians are much more likely to prefer to act as members of a group. In fact, of 50 countries studied by Hofstede, none ranked higher than the USA on the dimension of individualism. This suggests that American managers are more likely to act on their own and more willing to act independently of the group. In contrast, Indians will feel a stronger pull to be loyal to the group, that is, in a business context Indian managers will exhibit more alignment with the corporate structure that their counterparts in the USA.
Kathuria R et. al.| Sep.-Oct. 2016 | Vol.5| Issue 5|14- 15 The people of India are generally more accepting of
authority based on age, experience, qualification, etc. This may be a function of the prevalent value system in India that indirectly promotes respect for rank. The revered scriptures of India, such as the
Bhagavad-Gita, also teach respect for rank and
authority based on the four divisions of the social order-the intelligent class, administrative class, mercantile class, and laborer class [31]. Such values are ingrained in the Indian culture that manifest as high power distance, despite the fact that India is a secular country with representations from all major religions of the world.
Thus, we expect to see lower levels of misalignment (or lack of strategic consensus) in India since research on cultural dimensions suggests that decision-making is more likely to be centralized among more senior managers in India. Competitive priorities in manufacturing will be determined at higher levels of the organization and communicated to manufacturing managers. In the USA, decision-making is not only more likely to be decentralized, contributing to potential lack of strategic consensus between manufacturing managers and senior executives, but American managers are also more likely to act as individuals rather than members of the management group. These cultural differences would suggest that misalignment will be higher among manufacturing managers and senior executives in the USA rather than India.
H2. Lack of strategic consensus between manufacturing managers and senior executives in India is lower than that in the USA.
Research Methodology
Sample and Data Collection
The data for the study were collected from two levels of managers in India as well as in the USA. The Manufacturing Manager’s survey was completed by the individual responsible for managing the manufacturing function of the organization. The Senior Executive Survey was completed by the supervisor of the manufacturing manager who responded to the manufacturing manager’s survey.
Since most manufacturing companies in India conduct business in English, the same questionnaire was used without having to translate in any local language. Letters requesting participation of Indian managers were jointly signed by researchers of the study from both the USA and India. Follow-up letters were also signed by researchers from the two countries, but respondents from India were asked to return the
questionnaires to our associates’ office in India. After two follow-ups, we received a total of 352 usable questionnaires from 176 manufacturing units in the two countries, of which 78 manufacturing companies were from India and 98 from USA.
The two primary ways to achieve sample comparability are to draw nationally representative samples from the populations of interest, in our case India and USA, and to match samples based on some characteristics of interest [32]. The samples from the two countries are nationally representative samples. To assure further comparability across India and USA, the sampling frames in both India and USA comprised of all twenty SIC codes (20-39). We, however, didn’t receive responses from all sectors. A comparison of the participants from India by the Industry SIC codes appears to be similar to that in the USA. The frequency distribution of participating industries in the two samples is presented in Table 2. Both samples appear to be similar by industry representation on 17 of the 20 SIC codes, with three exceptions: 26 (Paper), 30 (Rubber) and 34 (Fabricated metals). The paper and rubber industries have a larger representation in the USA sample, whereas the fabricated metal industry has a wider representation in the India sample.
Scales: Measures, Reliability, and Validity Multiple items were used to capture a manufacturer’s emphasis on each of the four competitive priorities. Since managers at different levels in the hierarchy seem to view manufacturing priorities from different perspectives-senior executives from the “competitiveness” perspective and the manufacturing managers from the “competency” perspective [33].We used different sets of items for the two levels of managers. These measures have been used in prior studies such as Wood et al. [34]; Morrison and Roth [35]; Kathuria et al. [36]; Kathuria [1]; and Joshi et al. [14]. The managers rated all items on a five-point Likert type scale with values ranging from 1 to 5, with 5 being extremely important. Likert scales were used because companies are capable of emphasizing multiple competitive priorities with a varying degree of emphasis. The items were arranged in a random order to elicit accurate information from respondents.
Kathuria R et. al.| Sep.-Oct. 2016 | Vol.5| Issue 5|14- 16 Further, high-ranking respondents are considered
to be more reliable sources of information. Next, the Harman [37] one-factor test was used to test the potential incidence of CMV due to the use of perceptual measures. Since the factor analysis
resulted in several factors for both surveys, with the highest factor loadings spread across the factors, the CMV does not appear to be a problem in this study.
Table 2:Frequency distribution of industries by SIC code for USA and India samples
Industry Two-digit
SIC Code United States Sample Frequency Distribution India
Number of Plants Percentage Number of Plants Percentage Food Tobacco Textile Apparel Lumber Furniture Paper
Printing and publishing Chemicals
Petroleum refining Rubber
Leather
Stone, Clay, Glass Primary metals Fabricated metals
Industrial and computer eqpt. Electronic and electrical eqpt. Transportation eqpt. Instruments Misc. mfg. industries
Total 20 21 22 23 24 25 26 27 28 29 30 31 32 33 34 35 36 37 38 39 5 0 3 0 1 1 13 1 16 0 6 1 3 4 10 13 11 6 4 1 5.1 0.0 3.0 0.0 1.0 1.0 13.1 1.0 16.2 0.0 6.1 1.0 3.0 4.0 10.1 13.1 11.1 6.1 4.0 1.0 100.0 5 0 4 1 0 0 1 1 10 0 1 1 3 2 17 6 13 3 3 4 6.4 0.0 5.1 1.3 0.0 0.0 1.3 1.3 12.8 0.0 1.3 1.3 3.8 2.6 21.8 7.7 16.7 3.8 3.8 5.1 100.0 The content validity of competitive priority
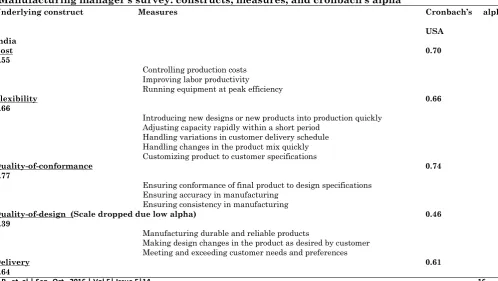
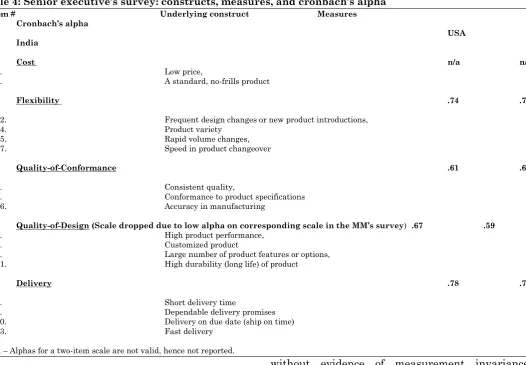
measures used in the study is assured as the measures are grounded in operations strategy literature [38,39,40,41]. The internal reliability coefficients (Cronbach’s alpha) for the delivery, flexibility and quality of conformance scales in both the manufacturing manager’s (Table 3) and senior executive’s surveys (Table 4) were very similar and acceptable for both countries, with the following exceptions. The alpha for the cost scale for manufacturing managers on the Indian survey was
0.55, but on the corresponding USA survey was 0.70 (see Table 3). The quality-of-design scale had a low alpha in both countries. We dropped the quality-of-design scale from further analysis from both the manufacturing manager and senior executive surveys, but retained the cost scale. Since one of the two quality scales were retained, quality-of-conformance will be, hereafter, called quality. This definition of quality is consistent with the one used in the literature [23,42].
Table 3:Manufacturing manager’s survey: constructs, measures, and cronbach’s alpha
Item # Underlying construct Measures Cronbach’s alpha
USA India
Cost 0.70
0.55
M1. Controlling production costs
M3. Improving labor productivity
M9. Running equipment at peak efficiency
Flexibility 0.66
0.66
M4. Introducing new designs or new products into production quickly
M6. Adjusting capacity rapidly within a short period
M7. Handling variations in customer delivery schedule
M2. Handling changes in the product mix quickly
M16. Customizing product to customer specifications
Quality-of-conformance 0.74
0.77
M8. Ensuring conformance of final product to design specifications
M10. Ensuring accuracy in manufacturing
M12. Ensuring consistency in manufacturing
Quality-of-design (Scale dropped due low alpha) 0.46
0.39
M5. Manufacturing durable and reliable products
M13. Making design changes in the product as desired by customer
M15. Meeting and exceeding customer needs and preferences
Delivery 0.61
Kathuria R et. al.| Sep.-Oct. 2016 | Vol.5| Issue 5|14-22 17
M14. Reducing manufacturing lead time
M11. Meeting delivery dates
M17. Making fast deliveries
Table 4: Senior executive’s survey:constructs, measures, and cronbach’s alpha
Item # Underlying construct Measures
Cronbach’s alpha
USA India
Cost n/a n/a
G1. Low price,
G5. A standard, no-frills product
Flexibility .74 .73
G12. Frequent design changes or new product introductions,
G14. Product variety
G15. Rapid volume changes,
G17. Speed in product changeover
Quality-of-Conformance .61 .68
G7. Consistent quality,
G9. Conformance to product specifications
G16. Accuracy in manufacturing
Quality-of-Design (Scale dropped due to low alpha on corresponding scale in the MM’s survey) .67 .59
G2. High product performance,
G3. Customized product
G4. Large number of product features or options,
G11. High durability (long life) of product
Delivery .78 .77
G6. Short delivery time
G8. Dependable delivery promises
G10. Delivery on due date (ship on time)
G13. Fast delivery
n/a – Alphas for a two-item scale are not valid, hence not reported.
Since companies can emphasize multiple competitive priorities, we expected the different competitive priority constructs to be significantly correlated. To assure discriminant validity, however, we also expected the constructs to be sufficiently dissimilar. All significant yet moderate (<0.7) correlations between the constructs attest to the discriminant validity of the constructs.
Measurement Equivalence
A key concern in extending theories and use of related constructs to other countries is whether the related instruments are cross-nationally equivalent. Such cross-national equivalence is called measurement invariance, which refers to “whether or not, under different conditions of observing and studying phenomena, measurement operations yield measures of the same attribute” [43]. If measurement invariance is not supported, conclusions based on those scales may be ambiguous, if not erroneous [44].For example, in our case, differences in competitive priorities between the USA and India might be due to true differences between the two countries or due to systematic biases in the way people from the two countries respond to certain items. Similarly,
without evidence of measurement invariance, findings of no differences between countries could be subject to alternative interpretations. To ensure that the differences (or lack thereof) between the two countries are genuine, we assess three types of measurement equivalence following Rungtusanatham et al. [45].
Translation equivalence: Since the surveys in India and the USA were administered in English, there was no need to translate and back-translate the measurement items. Thus, translation equivalence was not an issue in this study.
Calibration equivalence: The items on both the manufacturing manager and senior executive surveys were measured using five-point Likert type scales in both countries. The numerals “1” to “5” with their respective anchors of “Not at all important” to “Extremely important” were easily understood in India and USA alike, which satisfies the calibration equivalence.
Kathuria R et. al.| Sep.-Oct. 2016 | Vol.5| Issue 5|14-22 18 we relied on a visual comparison as in
Rungtusanatham et al. [45].The maximum difference in Cronbach’s alphas is 0.15 for the cost scale on the manufacturing manager’s survey, followed by 0.07 for the quality-of-conformance scale on the senior executive’s survey. For the remaining five measurement scales on the two surveys, the differences are 0.03 or less, with the minimum difference being 0.00 (i.e., no difference) for the flexibility scale on the senior executive survey. Hence, there appear to be minimal, if any, systematic biases in the way manufacturing managers and senior executives from the two countries responded to various items on the two surveys.
Results
We tested the study hypotheses using Multivariate Analysis of Variance (MANOVA) in order to simultaneously evaluate the mean differences on all four competitive priorities for enhanced interpretation of results. The multivariate approach, as opposed to separate univariate analyses (ANOVA), also helps control for the overall Type I error and provides a more powerful test We tested the key assumptions for the use of MANOVA as follows. The Kolmogorov-Smirnov test was used to test that all four dependent variables meet the assumption of normality at p < 0.0001 for the two levels of managers in both countries, which was also confirmed by the Normal Q-Q plots. The Levene’s test was used to check for homogeneity of error variances. Two variables, quality and delivery, show equality of variances across groups (p = 0.24 and 0.42) whereas the other two, cost and flexibility, do not (p <0.05). Box’s M test did not support the equality of covariance
matrices of the dependent variables, but such violations are not uncommon [46]. Further, MANOVA is considered robust to the violation of equality of variances and covariances when the groups are of equal or near-equal size. In our case, the number of manufacturing managers equals the number of senior executives in both countries. Lastly, the plants in the sample are independent of one another and so are the two countries, which support the last assumption of independence of observations. The use of two executives at different hierarchical levels in each participating unit further assures independence. Both India and USA samples also exceed the thresholds for group sizes (>20), which are large enough for conducting MANOVA [47].
Senior Executives’ Competitive Priorities in India vis-à-vis USA
The overall null hypothesis that senior executives in the two countries place an equal degree of emphasis on all of the four priorities was rejected
(Wilks’ Lambda = 0.849, F = 7.601, p < 0.000).
That is, senior executives’ emphases on competitive priorities vary by country, which explains about 15 percent of the variance (partial Eta squared = 0.151). Subsequent tests of between-countries effects show that the senior executives in the two countries differ significantly in their perceived emphasis on cost and flexibility. The follow-up pairwise comparisons with Bonferroni adjustment were conducted to understand the direction of difference in perceived importance of individual priorities between senior executives in the USA and India, and are shown in Table 5.
Table 5: Senior executives’ perception of competitive priorities in India and USA: MANOVA A. Overall Country Effects
Effect Multivariate Statistic Degrees of Freedom F (Significance) Partial Eta Squared
Observed Power$
Country Wilks’ Lambda = 0.849 4, 171 7.601 (0.000) 0.151 0.997
B. Between-Countries Effects by Competitive Priority
Dependent Variable Type III Sum of Squares Degrees of Freedom F (Significance) Partial Eta
Squared Observed Power$
Cost 8.198 1, 174 11.803 (0.001) 0.064 0.927
Flexibility 9.336 1, 174 13.691 (0.000) 0.073 0.957
Quality of Conformance 0.208 1, 174 0.868 (0.353) 0.005 0.153
Delivery 0.189 1, 174 0.460 (0.498) 0.003 0.104
C. Pairwise Comparisons by competitive priority with bonferroni adjustment for multiple comparisons
Dependent Variable Group Mean Std.
Error Mean Difference: India-USA (Std. Error)
Significance One-tailed
Cost
India 3.162 0.095 0.435 (0.127) 0.000
USA 2.727 0.084
Flexibility
India 3.199 0.094 0.464 (0.125) 0.000
Kathuria R et. al.| Sep.-Oct. 2016 | Vol.5| Issue 5|14-22 19 Quality of Conformance
India 4.584 0.056 0.069 (0.074) 0.176
USA 4.515 0.049
Delivery
India 4.214 0.073 -0.066 (0.097) 0.249
USA 4.280 0.064
$ Computed using alpha = 0.05
Consistent with our expectations, cost is given more importance (p <0.001) by the executives in India than their counterparts in the USA (see Table 2 and Figure 1), thus supporting H1a. Contrary to expectations, Indian executives place higher emphasis on flexibility than their counterparts in the USA. Thus, H1b is not supported. This finding is discussed in the next section. Hypothesis H1c is also not supported because there is no significant difference in the emphasis placed on delivery by senior executives in
the two countries. H1d, though not strictly worded as an alternative hypothesis, predicted no significant difference in the emphasis on quality of conformance among senior executives in the two countries. Even though failure to reject the null should not be used to support the null hypothesis, we could, perhaps, interpret that there is insufficient evidence that senior executives in India and the USA differ significantly on the importance of quality of conformance. Thus, our contention in H1d is supported.
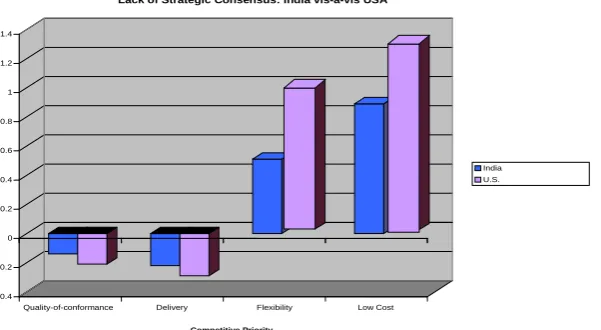
Figure 1: Lack of consensus between manufacturing managers and senior executives by competitive priority: India vis-a-vis USA
National Culture and Strategic Consensus in India and USA
In Hypothesis 2, we predicted a relatively lower degree of disagreement (i.e., higher strategic consensus) on competitive priorities between senior executives and manufacturing managers in India as compared to the USA due to cultural differences. As expected, MANOVA results (Table 6, Panel A) show that the null hypothesis of equal level of disagreement on priorities, between the two levels of executives, in India and the USA is rejected (Wilks’ Lambda = 0.871, F =6.235, p
<0.000). The underlying cultural differences between the two countries explain about 13 percent of the variance in lack of strategic consensus between manufacturing managers and senior executives. Subsequent tests of between-countries
effects in Panel B reveal that the degree of disagreement between Indian pairs of managers is statistically significantly lower than their USA counterparts on two of the four priorities. The follow-up pairwise comparisons using Bonferroni adjustment for Type I error-probability of rejecting a true null-showed lesser degree of disagreement (higher strategic consensus) between manufacturing managers and senior executives in India as compared to that in the USA on all four priorities, but statistically significantly so on the importance of cost and flexibility. There is insufficient evidence of lesser disagreement on quality-of-conformance and delivery between executives in India as compared to those in the USA. Thus, H2 is partially supported.
Table 6: Strategic consensus – differences due to national culture A. Overall Country Effects
Effect Multivariate Statistic Degrees of
Freedom F (Significance) Partial Eta Squared
Observed Power$
Country Wilks’ Lambda = 0.871 4, 168 6.235 (0.000) 0.129 0.987
-0.4 -0.2 0 0.2 0.4 0.6 0.8 1 1.2 1.4
Quality-of-conformance Delivery Flexibility Low Cost Competitive Priority
Lack of Strategic Consensus: India vis-a-vis USA
Kathuria R et. al.| Sep.-Oct. 2016 | Vol.5| Issue 5|14-22 20 B. Between-countries effects by competitive priority
Dependent Variable Type III Sum of Squares
Degrees of
Freedom
F (Significance) Partial Eta Squared
Observed Power$
Cost 7.554 1, 171 7.592 (0.006) 0.043 0.782
Flexibility 12.059 1, 171 11.657 (0.001) 0.064 0.924
Quality of Conformance 0.105 1, 171 0.206 (0.650) 0.001 0.074
Delivery 0.136 1, 171 0.237 (0.627) 0.001 0.077
C. Pairwise comparisons by competitive priority with bonferroni adjustment for multiple comparisons Dependent Variable Group Lack of Consensus# Mean Difference: India-USA
(Std. Error) Significance One-tailed
Mean Standard Error
Cost
India 0.884 0.115 -0.422 (0.153) 0.003
USA 1.306 0.101
Flexibility
India 0.484 0.117 -0.532 (0.156) 0.000
USA 1.016 0.103
Quality of Conformance
India USA -0.158 -0.207 0.082 0.072 0.049 (0.109) 0.325
Delivery
India -0.233 0.088 0.057 (0.116) 0.313
USA -0.290 0.077
$ Computed at alpha = 0.05 # Negative sign (direction of the difference) indicates that Senior Executives, on average, place higher emphasis on that competitive priority than the Manufacturing Managers.
Discussion
Compared to their USA counterparts, senior executives in India place a higher degree of emphasis on flexibility and cost. The greater emphasis on cost by Indian managers is consistent with our expectations. Since the Indian economy, while developing, is not as advanced as the USA, the emphasis on cost may be a vestige of former competitive priorities. The higher emphasis on flexibility by senior executives in India compared to their USA counterparts is a surprising finding, which could be due to their relative experience and position in the organization as explained below. On further investigation, we learned that many senior executives in India were promoted through the ranks of manufacturing managers. It is possible that though promoted, they still have the mentality of manufacturing managers, who seem to place a higher degree of emphasis on the internally-focused competitive priorities of cost and manufacturing flexibility. This finding is consistent with that of Kathuria et al. [13] who observed this phenomenon with the two levels of managers in USA.
Finally, results show that the magnitude of disagreement between manufacturing managers and senior executives is more pronounced in the USA than in India, as expected. The difference is statistically significant on two of the four priorities, namely cost and flexibility. Lack of consensus on the other two priorities, quality and delivery, though marginally higher in the USA than in India, is not statistically significant. This may be a function of the relative importance of quality and delivery in the changing global environment. Quality, as mentioned before, is becoming an order qualifier [48]. The International Standards
Organization and the institution of quality awards in various countries, for example the Malcom Baldridge Award, seemed to have helped raise quality awareness around the globe[1].
Further, given the globalization trend, more and more countries/firms buy materials or components from around the globe. For example, the Juicy Juice company sources its cartons from China, gets juice concentrate from Argentina or Brazil, and mixes and packages its product in the USA [5]. A Wall Street Journal article reported that automobile manufacturers such as Ford, Honda, Suzuki, and Hyundai have all increased manufacturing and investment in India to not only serve growing demand in the Indian market but as an export base to serve markets in Eastern Europe, Latin America and Africa [49]. In addition, auto parts manufacturers in India are now suppliers to almost all the major USA and Japanese auto makers, including Ford, General Motors, and Toyota. And Indian officials predict that exports from India of auto parts will make India one of the world's major suppliers [49]. This globalization trend in India seems to have raised the awareness and need for delivery speed and reliability in India as it has in the USA. It may be for these reasons that we find a lesser degree of disagreement (higher consensus) on these two priorities in both countries.
Conclusions and Implications
Kathuria R et. al.| Sep.-Oct. 2016 | Vol.5| Issue 5|14-22 21 and national culture. Our understanding of the
impact of national culture on managers’ behaviors and decisions has developed and been refined over the past 25 years through advancements in the research.
This study adds to the research by comparing manufacturing practices in the USA and the rapidly emerging economy of India and provides insights into the manufacturing priorities of senior executives and manufacturing managers in these countries.
One implication of this study for global managers is the assurance that Indian managers’ high emphasis on quality-of-conformance and delivery is in line with managers from a developed country that has a long and successful track record of competing in global markets. Further, though Indian managers seem to emphasize flexibility and cost more than their USA counterparts, the emphases on these priorities are not as high as quality and delivery. For Indian managers these results appear to suggest a good start. To compete globally, however, the focus may need to shift to flexibility as they appear to be already pursuing quality and speed/reliability of delivery.
This study was able to compare the lack of strategic consensus between managers due to their differing responsibilities in the organization in two very different countries-a developing nation India and an experienced economy USA. To some extent, senior executives and manufacturing managers tend to disagree on the relative importance of priorities in both countries. The need for senior
executives and manufacturing managers to work together to create alignment of manufacturing priorities is an important implication of this study for managers in both countries. These differences need to be discussed between the levels of management in both countries so that their competitive priorities are aligned.
Another important contribution of the study is the finding that national culture seems to impact the degree of strategic consensus among managers. Cultures, such as India, that promote collectivism and high power distance are more likely to witness a higher degree of consensus between managers at different levels in the organization. This scenario might change as the new generation of managers influenced by American management education at an earlier age in schools and colleges joins the work force. These new managers exhibit more open and non-conservative values at workplace when compared to older employees [50]. Chatterjee and Pearson [51] in their study of Indian managers also demonstrate the emergence of a duality of values among them, and highlight the need for organizations to balance tradition and change during times of rapid economic development. Future research may attempt to incorporate the education levels of managers, especially in India, and the extent of their exposure to western practices to glean the confounding effects, if any, on strategic consensus. Future research should also focus on environmental factors, other than the national culture, that may also affect competitive priorities and the related notion of strategic consensus.
References
1.Kathuria R, Porth S, Kathuria NN, Kohli TK (2010) Competitive
priorities and strategic consensus in emerging economies: evidence from India. International Journal of Operations & Production Management, 30(8):879-896.
2.Lindberg P, Voss, CA, Blackmon (1998) International Manufacturing
Strategies: Context, Content and Change. Norwell, MA: Kluwer Academic Publishers.
3.Nagabhushana TS, Shah J (1999) Manufacturing priorities and
action programmes in the changing environment. International Journal of Operations & Production Management, 19(3/4):389-399.
4.Dangayach GS, Deshmukh SG (2005) Advanced manufacturing
technology implementation: Evidence from Indian small and medium enterprises. Journal of Manufacturing Technology Management, 16(5):483-496.
5.Heizer J, Render B (2004) Operations Management. Prentice Hall.
6.Hofstede G (1980) Culture’s Consequences. Beverly Hills, CA: Sage.
7.Hofstede G (1993) Cultural constraints in management theories.
Academy of ManagementExecutive,7(1):81-94.
8.Hofstede G (2001) Culture’s Consequences: Comparing Values,
Behaviors, Institutions, and Organizations Across Nations (2nd ed.).
Thousand Oaks, CA: Sage.
9.Hofstede G (1983) National cultures in four dimensions: A
research-based theory of cultural differences among nations, International Studies of Management and Organization, 13(1-2):46-75.
10. Flaherty MT (1996) Global Operations Management,
McGraw-Hill, New York, NY.
11. Porter ME (1990) The Competitive Advantage of Nations. New
York: Free Press.
12. Kathuria R, Joshi MP, Porth S (2007) Organizational alignment
and performance: Past, present and future. Management Decision, 45(3): 503-517.
13. Kathuria R, Porth, S, Joshi MP (1999) Manufacturing priorities:
Do general managers and manufacturing managers agree? International Journal of Production Research, 37(9):2077-2092.
14. Joshi MP, Kathuria R, Porth S (2003) Alignment of strategic
priorities and performance: An operations perspective. Journal of Operations Management, 21(3):353-369.
15. Swink M, Narasimhan R, Kim SW (2005) Manufacturing practices
and strategy integration: Effects on cost efficiency, flexibility, and market-based performance. Decision Sciences, 36(3):427-457.
16. Ferdows K, Miller JG, Nakane J, Vollman TE (1986) Evolving
Kathuria R et. al.| Sep.-Oct. 2016 | Vol.5| Issue 5|14-22 22
17. De Meyer A, Nakane J, Miller JG, Ferdows K (1989) Flexibility:
The next competitive battle. Strategic Management Journal, 10:135-144.
18. Nakane J (1986) Manufacturing futures survey in Japan: A
comparative survey 1983-1986. System Science Institute. Waseda University: Tokyo.
19. Kim JS (1996) Search for a new manufacturing paradigm. In
Executive Summary of the 1996 USA Manufacturing Futures Survey, Boston University Manufacturing Roundtable Research Report Series.
20. Voss C, Blackmon K (1998) Differences in manufacturing
strategy decisions between Japanese and Western manufacturing plants: The role of strategic time orientation. Journal of Operations Management, 16(2&3):147-158.
21. Flynn BB, Flynn EJ (2004) An exploratory study of the nature of
cumulative capabilities. Journal of Operations Management, 22(5):439-457.
22. Chandra P, Sastry T (1998) Competitiveness of Indian
Manufacturing. Vikalpa, 23(3):25-36.
23. Ferdows K, De Meyer A (1990) Lasting improvements in
manufacturing performance: In search of a new theory. Journal
of Operations Management, 9(2):168-184.
24. Dangayach GS, Deshmukh SG (2000 )Manufacturing strategy:
Experiences from select Indian organizations. Journal of Manufacturing Systems, 19(2):134-148.
25. Boyer KK, McDermott C (1999) Strategic consensus in operations
straegy, Journal of Operations Management, 17:289-305.
26. Skinner W (1974) The focused factory. Harvard Business Review,
3:113-119.
27. Swamidass PM (1986) Manufacturing strategy: Its assessment
and practice. Journal of Operations Management, 6(4):471-484.
28. Menda R, Dilts D (1997) Manufacturing strategy formulation
process: linking multifunctional viewpoints. Journal of Operations Management, 15(4):223-241.
29. Rosenzweig PM (1994) When can management science research
be generalized internationally? Management Science, 40(1):28-39.
30. Ailon G (2008) Mirror, mirror on the wall: Culture’s
Consequences in a value test of its own Design, Academy of Management Review, 33(4):885-904.
31. Prabhupada ACBS (2008) Bhagavad-Gita As It Is. Los Angeles,
CA: The Bhaktivedanta Book Trust.
32. Sekaran U (1983) Methodological and theoretical issues and
advancements in cross-cultural research. Journal of
International Business Studies, 14 (Fall):61-73.
33. Corbett C, Wassenhove LV (1993) Trade-offs? What trade-offs?
Competence and competitiveness in manufacturing strategy. California Management Review, 107-122.
34. Wood CH, Ritzman LP, Sharma D (1990) Intended and achieved
competitive priorities: measures, frequencies, and financial impact, Manufacturing Strategy, edited by Ettlie, J.E., Burstein, M.C., and Fiegenbaum, A. (Boston, MA: Kluwer Academic Publishers).
35. Morrison A, Roth, K. (1993) Relating Porter’s
configuration/coordination framework to competitive strategy and structural mechanisms: Analysis and implications. Journal of Management, 19(4):797-818.
36. Kathuria R (2000) Competitive priorities and managerial
performance: A taxonomy. Journal of Operations Management, Special Issue on Configurations in Operations Management: Taxonomies and Typologies, 18(6):627-641.
37. Harman HH (1967) Modern factor analysis. University of Chicago
Press, Chicago, IL.
38. Hayes RH, Wheelwright SC (1984) Restoring our competitive edge.
New York: John Wiley and Sons.
39.Miller JG, Roth AV (1994) A taxonomy of manufacturing strategies.
Management Science, 40(3):285-304.
40.Safizadeh MH, Ritzman LP, Mallick D (2000) Revisiting alternative
theoretical paradigms in manufacturing strategy.Production and
Operations Management, 9(2):111-127.
41.Ward PT, McCreery JK, Ritzman LP, Sharma D 1(998) Competitive
priorities in Operations Management. Decision Sciences, 29(4):1035-1047.
42.Boyer KK, Lewis MW (2002) Competitive priorities: Investigating
the need for trade-offs in operations strategy, Production and Operations Management, 11(1):9-20.
43.Horn JL, McArdle J (1992) A practical and theoretical guide to
measurement invariance in aging research. Experimental Aging Research, 18 (Fall-Winter), 117-144.
44.Steenkamp Jan-Benedict EM, Baugartner H (1998) Assessing
measurement invariance in cross-national consumer research. Journal of Consumer Research, 25:78-90.
45.Rungtusanathan M, Forza C, Koka BR, Salvador F, Nie W (2005)
TQM across multiple countries: Convergence Hypothesis versus
National Specificity arguments. Journal of Operations
Management, 23(1):43-63.
46.Liu G, Shah R, Schroeder RG (2006) Linking work design to mass
customization: a sociotechnical systems perspective. Decision Sciences 37(4):519-541.
47.Hair JF, Anderson RE, Tatham RL, Black WC (1998) Multivariate
data analysis (5th ed.). Englewood Cliffs, NJ: Prentice Hall.
48.Hill T (1994) Manufacturing Strategy: Text and Cases. Homewood,
IL: Richard D. Irwin.
49.Solomon J (2003) India: The Export Launching Pad. Wall Street
Journal, October 2.
50.Khilji SE, Wang X (2007) New evidence in an old debate:
Investigating the relationship between HR satisfaction and turnover. International Business Review, 16(3):377-395.
51.Chatterjee, SR, Pearson CA (2006) Changing work goals of Asian