Analysis Of Electromyography Signals Using
Multi-Resolution Wavelet And Fourier Transform Based
Biomedical Signal Processing Techniques
Shammi Farhana Islam
Lecturer,
Department of Material Science and Engineering Rajshahi University, Rajshahi-6205,
Bangladesh
Abstract
In this paper, a comprehensive study has been made on applicability of wavelet transformed aided biological signal processing technique using fifth ordered Daubechies wavelet(db5) on electroencephalography (EEG) signals collected from three different categorized persons( normal person, neuropathic and myopathic patients). These three persons are well discriminated based on the characteristic features of the reconstructed signals at five different levels in discrete wavelet analysis. It is noticeable from the decomposed wavelets and reconstructed signals at five levels that the firing rate linking with the contractile activity of individual or a small group of muscle fibers in case of a myopathic patient is comparatively high due to muscular damage as compared to normal healthy person. In case of a neuropathic patient, the wavelet decomposed and reconstructed signals are characterized by the presence of spikes in irregular fashion with irregular firing pattern due to muscular clustering. In perspective of EMG signal amplitude, it is found that the signal amplitude is the highest for neuropathic patient as compared to others due to significant force produced by the muscle. The EMG signals have also been analyzed with classical Fourier Transform technique.
Keywords
: electromyography, Daubechies wavelet(db5), neuropathic, myopathic , Wavelet and Fourier Transform
1.
INTRODUCTION
(FES) and clinical diagnosis[2,3] . Biosignal processing has been developing rapidly with increased understanding of complex biological processes in a wide variety of areas. Wavelet transform is a powerful time frequency approach which has been applied to multiple domains of biosignal processing, In Wavelet transform, its main base is the mother wavelet function that would permit identification of correlated coefficients across multiple signals. The Daubechies (db) wavelet functions) have been applied in several areas with the lower orders (db1 to db20). The selection of the most appropriate mother wavelet to characterize commonalities amongst signals within a given domain is still lacking in biosignal processing. In this present study, Daubechies 5(db5) has been introduced as the mother wavelet function across a variety of surface electromyography (SEMG) signals[4] .
2.
DATA ACQUISITION
The raw EMG data were collected with a Medelec Synergy N2 EMG Monitoring System (Oxford Instruments Medical, Old Woking, United Kingdom) from three persons: 1) a 44 year old man without history of neuromuscular disease; 2) a 62 year old man with chronic low back pain and neuropathy due to a right L5 radiculopathy; and 3) a 57 year old man with myopathy due to longstanding history of polymyositis, treated effectively with steroids and low-dose methotrexate. A 25mm concentric needle electrode was placed into the tibialis anterior muscle of each persons. The EMG data were recorded primarily with 50 KHz sampling frequency and later on down sampled with sampling frequency of 4 KHz . The raw EMG signals were filtered using two analog filters : a 20 Hz high-pass filter and a 5K Hz low-pass filter to make critical analysis of EMG signal in frequency band: 20Hz-5000Hz. [5]. The number of samples used in this present study is 8000 and the time duration is 2 second.
3.
MULTI-RESOLUTION WAVELET ANALYSIS
A wavelet is a function
L
2(
) which satisfies the condition
dw
w
)
w
(
ˆ
C
2
(1)
where,
ˆ
(
w
)
is the Fourier transform of
(t). The wavelet transform (WT) exhibits properties of signal such as points of abrupt changes, seasonality or periodicity and is a function of scale of frequency(a) and spatial position(translation) or time(b). Taking integral values of scale of frequency and spatial position/time, a discrete function can be written as0
a
where
),
a
b
t
(
a
)
t
(
21
b ,
a
)
t
(
b , a
is called the Wavelet Transform(WT) of a time domain function f(t) andb , a 2
1
,
f
dt
)
a
b
t
(
)
t
(
f
a
)
b
,
a
(
f
T
= inner product or dot product of f and
a,bIf
L
2(
), then
a,b(t) L2( ) for all a,b
2 1 2 2 2
b ,
a ) dt (x) dx
a b t ( a
) t
( (2)
) a ( ˆ e a dt ) a
b t ( e a ) (
ˆ i t
2 1 t
i 2 1 b
,
a
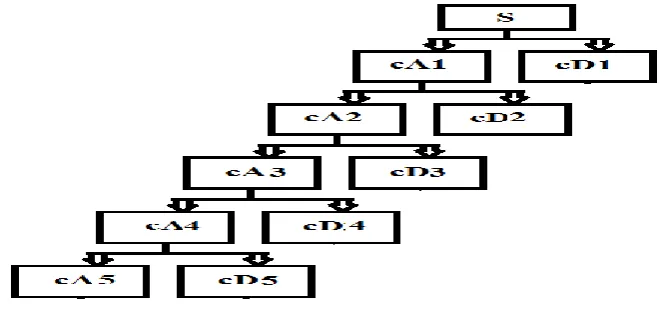
(3)The EMG signal is non- stationary, non-linear, and stochastic process produced as a result of the summation of several motor unit action potential trains (MUAPTs). In frequency domain analysis with processing of such signal, variations in muscle force, length and contraction speed create barriers and pose difficulties in implementation of Fast Fourier Transform (FFT) based mathematical algorithm[2]. In consideration of constraints of FFT implementation in EMG signal decomposition, the wavelet transform (WT), in its discrete or continuous versions (DWT and CWT, respectively), has been suggested as an alternative way of decomposing the EMG signals. In real real-time engineering applications, the discrete Wavelet transform(DWT) transforms iteratively an interested signal into multi-resolution subsets of coefficients. The DWT transforms the EMG signal with a suitable wavelet basis function (WF). In this study , Daubechies 5(db5) has been used as an optimal wavelet basis function to investigate the usefulness of the multi-resolution wavelet analysis through studying of the EMG features with different scales and local variations and also the elimination of the undesired frequency components. The original EMG signal (S) is passed through a low-pass filter and a high-pass filter (coefficients of filters dependant on chosen Daubechies 5 wavelet basis function) to obtain an approximation coefficient subset (cA1) and a detail coefficient subset (cD1) at the first level. In order to obtain the multiple-resolution subsets, repetitious transformation is done. This process is repeated until the desired final level is obtained. In wavelet transformation using Daubechies 5(db5), five approximation coefficient subsets(cA1 through cA5) and five detail coefficient subsets(cD1 through cD5) are produced at five decomposition levels(Fig1). . The reconstructed EMG signals, namely A5, D5, D4, D3, D2, and D1 are reconstructed from inverse transformations of the coefficients ,cA5, cD5, cD4, cD3, cD2, and cD1 respectively[7].
Fig. 1: Discrete wavelet transform decomposition tree from decomposition level 5
4.
RESULTS AND DISCUSSION
an average value of 0.0014 mV. In case of myopathic patient, the maximum and minimum values of EMG signal are 0.7033 mV and -0.5450 mV with an average value of 6.9008 × 10⁻⁴ mV. For the neuropathic patient, the maximum and minimum values of EMG signal are 1.9000 mV and -4.2417 mV with an average value of -4.2445 × 10⁻⁴ mV. The signals obtained from the raw EMG signal for a healthy person and the reconstructed EMG signals at different multi-resolution levels and the signals between the raw EMG signal and the wavelet coefficient subsets at different multi-resolution levels are presented in Figure 4. In Figure 4, the amplitude of A5 varies from 0.2125mV to -0.2688mV for a maximum signal value of 0.5483mV. The low frequency components present in the decomposed wavelet cA5 and reconstructed signal A5 are the identifier of the desired signal for classification. In both signals, the presence of spikes is linked with muscle contraction and a more or less noisy static baseline is indicative of muscle relaxation. In Figure 4, the high frequency components (the cD1-cD5, the D1-D5) can be assumed as noises. In Figure 5, the signals obtained from the raw EMG signal for a myopathic person and the reconstructed EMG signals at different multi-resolution levels and the signals between the raw EMG signal and the wavelet coefficient subsets at different multi-resolution levels are presented. In such figure, the low frequency components of cA5 and A5 signals are representative as identity of the desired signal for classification.
. Such signals are characterized by the presence of several peaks linking with the increased firing rate of motor units. It is observable from such figure that for a maximum signal value of 0.7033 mV, the corresponding maximum and minimum values of A5 are of 0.2074 mV and -0.1120 mV respectively.
In Figure 6, the signals obtained from the raw EMG signal for a neuropathic patient and the reconstructed EMG signals at different multi-resolution levels and the signals between the raw EMG signal and the wavelet coefficient subsets at different multi-resolution levels are presented. It is observable that in such figure that the cA5 and A5 signals contain spikes in irregular fashion with high amplitudes. The maximum and minimum values of A5 are found to have values of 0.3078 mV and -.0.2574 mV for a maximum signal value of 1.9000 mV . In view of classifying three categorized persons, the estimated values of reconstructed signal data(D1) in mill-volt at five different levels for normal, neuropathic and myopathic patients can be considered which varies between 0.2688 to -0.2146, 1.3108 -1.0415 and 0.3399 -0.3985 respectively.
Fig. 2: Spectral analysis of Recorded EMG signals for a Healthy person and two patients(Myopathic and Neoropathic)
0 2000 4000 6000 8000
0 0.005 0.01
Frequency Domain analysis of EMG signal for Healthy old man
Frequency (Cycles/sec)
M
ag
n
it
u
d
e
0 2000 4000 6000 8000
0 0.005
0.01 Frequency Domain analysis of EMG signal for old myopathic patient
Frequency (Cycles/sec)
M
ag
n
it
u
d
e
0 2000 4000 6000 8000
0 0.005 0.01
Frequency Domain analysis of EMG signal for old neoropathic patient
Frequency (Cycles/sec)
M
ag
n
it
u
d
Fig. 3: Recorded EMG signals for a Healthy person and two patients (Myopathic and Neoropathic)
Fig. 4: Raw and reconstructed EMG signals of a Healthy person using Daubechies wavelet (db5) with 5 levels of wavelet decomposition and reconstruction
0 0.2 0.4 0.6 0.8 1 1.2 1.4 1.6 1.8 2
-1 0
1 EMG signal for a 44 year old healthy man
Time(sec) A m p li tu d e( m V )
0 0.2 0.4 0.6 0.8 1 1.2 1.4 1.6 1.8 2
-1 0
1 EMG signal for a 57 year old myopathic patient
Time(sec) A m p li tu d e( m V )
0 0.2 0.4 0.6 0.8 1 1.2 1.4 1.6 1.8 2
-5 0
5 EMG signal for a 62 year old neoropathic patient
Time(sec) A m p li tu d e( m V )
0 1000 2000 3000 4000 5000 6000 7000 8000 -1
0 1
Raw and Reconstructed EMG signals for Healthy person
S
0 1000 2000 3000 4000 5000 6000 7000 8000 -0.5
0 0.5
D
1
0 1000 2000 3000 4000 5000 6000 7000 8000 -0.5
0 0.5
D
2
0 1000 2000 3000 4000 5000 6000 7000 8000 -0.5
0 0.5
D
3
0 1000 2000 3000 4000 5000 6000 7000 8000 -0.5
0 0.5
D
4
0 1000 2000 3000 4000 5000 6000 7000 8000 -0.2
0 0.2
D
5
0 1000 2000 3000 4000 5000 6000 7000 8000 -0.5 0 0.5 Sample A 5
0 1000 2000 3000 4000 5000 6000 7000 8000 -1
0 1
EMG signal and wavelet coefficient subsets for Healthy person
S
0 500 1000 1500 2000 2500 3000 3500 4000 -0.5 0 0.5 c D 1
0 500 1000 1500 2000 -0.5 0 0.5 c D 2
0 100 200 300 400 500 600 700 800 900 1000 -1 0 1 c D 3
0 100 200 300 400 500 -1 0 1 c D 4
0 50 100 150 200 250 -1 0 1 c D 5
Fig. 5: Raw and reconstructed EMG signals of a myopathic patient using Daubechies wavelet (db5) with 5 levels of wavelet decomposition and reconstruction
Fig.6: Raw and reconstructed EMG signals of a neuropathic patient using Daubechies wavelet (db5) with 5 levels of wavelet decomposition and reconstruction
5.
CONCLUSIONS
In this paper, wavelet based comprehensive analysis has been made on electromyography (EMG) signals for clinical neurophysiologic evaluation of patients with neuromuscular disorders. Analysis of EMG signals with conventional DFT technique has also been made. It has been ratified that biomedical signal like EMG containing sharp and asymmetric spikes can be appropriately and efficiently analyzed using Daubechies’ wavelets rather than DFT based signal processing scheme. From multiple-level decompositions of the EMG signals using Daubechies wavelet 5(db5), the EMG features
0 1000 2000 3000 4000 5000 6000 7000 8000 -1
0 1
Raw and Reconstructed EMG signals for myopathic patient
S
0 1000 2000 3000 4000 5000 6000 7000 8000 -0.5
0 0.5
D
1
0 1000 2000 3000 4000 5000 6000 7000 8000 -0.5
0 0.5
D
2
0 1000 2000 3000 4000 5000 6000 7000 8000 -0.5
0 0.5
D
3
0 1000 2000 3000 4000 5000 6000 7000 8000 -0.5
0 0.5
D
4
0 1000 2000 3000 4000 5000 6000 7000 8000 -0.5
0 0.5
D
5
0 1000 2000 3000 4000 5000 6000 7000 8000 -0.2 0 0.2 Sample A 5
0 1000 2000 3000 4000 5000 6000 7000 8000 -1
0 1
EMG signal and wavelet coefficient subsets for myopathic patient
S
0 500 1000 1500 2000 2500 3000 3500 4000 -1 0 1 c D 1
0 500 1000 1500 2000 -0.5 0 0.5 c D 2
0 200 400 600 800 1000 -1 0 1 c D 3
0 100 200 300 400 500 -1 0 1 c D 4
0 50 100 150 200 250 -1 0 1 c D 5
0 50 100 150 200 250 -2 0 2 Sample c A 5
0 1000 2000 3000 4000 5000 6000 7000 8000 -1
0 1
Raw and Reconstructed EMG signals for neoropathic patient
S
0 1000 2000 3000 4000 5000 6000 7000 8000 -2
0 2
D
1
0 1000 2000 3000 4000 5000 6000 7000 8000 -2
0 2
D
2
0 1000 2000 3000 4000 5000 6000 7000 8000 -2
0 2
D
3
0 1000 2000 3000 4000 5000 6000 7000 8000 -2
0 2
D
4
0 1000 2000 3000 4000 5000 6000 7000 8000 -0.5
0 0.5
D
5
0 1000 2000 3000 4000 5000 6000 7000 8000 -0.5 0 0.5 Sample A 5
0 1000 2000 3000 4000 5000 6000 7000 8000 -1
0 1
EMG signal and wavelet coefficient subsets for neoropathic patient
S
0 500 1000 1500 2000 2500 3000 3500 4000 -2 0 2 c D 1
0 500 1000 1500 2000
-5 0 5 c D 2
0 200 400 600 800 1000 -5 0 5 c D 3
0 100 200 300 400 500 -10 0 10 c D 4
0 50 100 150 200 250
-2 0 2 c D 5
0 50 100 150 200 250
have been successfully extracted for three different categorized persons. The investigation results of this paper can be widely used in a wide class of clinical and engineering applications.
6.
REFERENCES
[1] Andrzej CICHOCKI and Shun-ichi AMARI,"Adaptive Blind Signal and Image Processing Learning Algorithms and Applications", John Wiley and Sons Inc., New York, USA, 2002
[2] Marcelo Bigliassi, Paulo Rogério Scalassara, Thiago Ferreira Dias Kanthack,Taufik Abrão, Antonio Carlos de Moraes, Leandro Ricardo Altimari,"Fourier and Wavelet Spectral Analysis of EMG Signals in 1-km Cycling Time-Trial", Applied Mathematics,vol.5,2014,pp.1878-1886, http://www.scirp.org/journal/am, http://dx.doi.org/10.4236/am.
[3] Gang Wang, Yanyan Zhang, and JueWang, "The Analysis of Surface EMG Signals with the Wavelet-Based Correlation Dimension Method", Computational and Mathematical Methods in Medicine, Vol 2014, Hindawi Publishing Corporation,2014
[4] J. Rafiee A, M.A. Rafiee A, N. Prause B, M.P. Schoen, "Wavelet basis functions in biomedical signal processing", Expert Systems with Applications, vol. 38,,2014,pp. 6190–6201 Elsevier publication.
[5] http://physionet.incor.usp.br/physiobank/database/emgdb
[6] Kulwinder Singh Parmar and Rashmi Bhardwaj," Analysis of Water Parameters Using Daubechies Wavelet (Level 5) (Db5)", American Journal of Mathematics and Statistics vol. 2,no3,pp. 57-63, DOI: 10.5923/j.ajms.20120203.08 , 2012