Popularity Analysis on Social Network: A Big Data
Analysis
Sufal Das
Department of Information Technology, North-Eastern Hill University Shillong, Meghalaya,
India
Brandon Victor Syiem
Department of Information Technology, North-Eastern Hill University Shillong, Meghalaya,
India
Hemanta Kumar Kalita
Department of Information Technology, North-Eastern Hill University Shillong, Meghalaya,
India
ABSTRACT
A social network is a social structure made up of a set of social actors. These actors form a network of social interactions and personal relationships. These networks are a valuable source of information about the users. Thus, analyzing these social interactions (particularly from more popular social networks such as Twitter, Facebook, etc.) allow us to predict the interests of users from a common place, group, friend circle, etc. From a business point of view, it helps by analyzing the popularity of products that are so often advertised in social networks, by looking at how many users have visited the product page, or how many people have liked the product. In similar context, the popularity of a group or person can help conclude the result of certain events such as elections. This paper explores the popularity index of different politicians in Twitter using MapReduce. We focused on tracking mainly politicians. For each person, we have tracked a list of associated words and counted the frequencies that these words appear in tweets as well as number of followers.
General Terms
Popularity Analysis, Social Network, MapReduce, Big Data
Keywords
Big Data Analysis, Big Data Techniques, Popularity Analysis and MapReduce.
1.
INTRODUCTION
In recent years, different types of information sharing systems, including the Web have been made possible via the Internet. A large number of social networks have become immensely popular among a considerably large fraction of the population [1]. Online social networks are organized around users unlike the Web, which is largely organized around content. Participating users join a network, publish their profile and any content, and create links to other users with whom they associate. Social networks provide a base for finding users with similar interests, maintaining social relationships and for locating content and information of interests that has been contributed or endorsed by other users [2].
Online social networks have evolved since the time of emails, which were difficult to analyze due to its distributed nature. However, today’s social networking sites such as Facebook, Twitter, Flickr, You-Tube, Orkut, Live-Journal, etc. rely on an explicit user network to organize, locate and share content; many of which are public and can be crawled automatically to capture and study a large fraction of the connected user graph. These sites present an opportunity to measure and study online social networks at a large scale.
Online communications through social networks have clear advantages for social change. Online groups are less expensive for training, recruiting and organizing than traditional methods. People naturally form groups around shared causes or interests which makes finding an audience easy online. In crisis situations, like the Mumbai attacks, there is more broadcast based information sharing activities, where the user is pushing information out to many users and not directing it toward one specific user. Thus, use of social networks in communicating disaster circumstances can provide significant tactical, community building, and emotional functions. Activists who use social media for social change can use them to gain followers, plan in real and virtual life meetings, and keep followers informed about events and news. People from different cultures and countries may use the same social network sites such as Twitter but not necessarily in the same way. Studies have shown that cultural differences profoundly impact the way people use social network [2].
A group in the context of social networks can be a formally organized number of people or merely people who identify with similar cause or who have a common interest or experience. For instance, Flickr users who tag their photos with the same event tag could be considered a group.
Users often can [3]:
• Virtually join a group.
• Get updates and messages about a group. • Read, post, or comment on news and information. • Receive/send private messages with group leaders and members.
• Read and engage in transparent conversations that can be seen by others.
• “Lurk” in a group read information without making oneself known as a follower or member of the group.
• Interact with others despite social or location boundaries.
The main concern while trying to determine the popularity of an entity in a social network is the question of who has access to the Internet [1]. The “digital divide” describes the “potential for a divide between those connected to the Internet and those not connected, sometimes worded as the divide between the information have's and have's not”. Figure below shows Internet users in the world distributed by world regions [2]. We can see that Europe accounts for only 34% of the world’s Internet users and the North America only 28%, the
Asia only 17%, South America 8%, the Oceania only 6%, the Africa only 5% and Middle East only 3% of world’s Internet users.
Fig. 1.1: Geographical distribution of Internet user Popularity analysis can be valuable in many spheres such as in marketing, determining the popularity and finding the public view of a product or a person. For example if a product is getting maximum likes in the social networking sites or in the website or the product is searched many times in the web then it helps the manufacturer understand the increase in demand or reputation of that product. Similarly popularity of a group or person can help determining the result of certain events such as elections [1]. For example as of 2012, social media sites have become flooded with political activism and campaigning, which has deeply impacted the 2012 Presidential Election. Compared to the 2012 election campaign, President Obama’s Facebook page had close to thirty million likes (Barak Obama – Politician Facebook), while his opponent, Governor Mitt Romney had around nine million likes (Mitt Romney, Facebook).
The rest of paper has been arranged as follows, Section II: Background Study: Big Data and Hadoop. Section III: Our Approach. Section IV: Implementation and Result Analysis and Section V: Conclusion.
2.
BACKGROUND STUDY: BIG DATA
AND MAPREDUCE
2.1 Big Data Concept
In order to characterize a great amount of data that traditional data management techniques cannot manage and process due to the size and complexity of this data, Roger Magoulas from O’Reilly media introduced the term “Big Data” for the first time in 2005.
Big Data can be described as an expression that comprises of different data sets of very large, unstructured, highly complex, organized, stored and processed data [3, 4].
2.2 Characteristics of Big Data
Big Data has three main characteristics [4]:
1. High-volume: It refers to the quantity of data gathered by a company that must be processed further to obtain important knowledge.
2. High-velocity: It refers to the time in which Big Data can be processed. Some activities are very important and need immediate responses that are why fast processing maximizes efficiency.
3. High-variety: It refers to the type of data that Big Data can comprise. This data can be structured as well as
unstructured. Different data type such as audio, video, image data (mostly unstructured data).
Fig. 2.1.: Three V’s of Big Data [4]
2.3 Importance of Big Data
Big Data can be used effectively in some of the following [10]:
1. Enhance customer satisfaction by customizing services.
2. Improving services and products through the use of social media content.
3. Improve security and troubleshooting in Information technology.
4. Detection of fraud.
5. Analyzing information from the transactions on the financial market in risk assessment.
2.4 Big Data Challenges
In order to determine the best strategy for a company it is essential that the data that are being counted on must be properly analyzed [12].
1. New Technology: It is necessary for these organizations to learn how to use the newly developed technologies as soon as they are on the market. This is an important aspect that is going to bring competitive advantage to a business.
2. Need of IT specialists: It is also a challenge for Big Data. The next frontier for innovation, there is a need for more workers with analytical expertise and more data-literate managers. This statistics are a proof that in order for a company to take the Big Data initiative has to either hire experts or train existing employees on the new field.
3. Privacy and Security: It is an important challenge for Big Data because Big Data consists of a large amount of complex data. It is problematic for a company to sort this data on privacy levels and apply the according security.
2.5 Hadoop MapReduce
Big data analytics and the Apache Hadoop open source project are rapidly emerging as the preferred solution to business and technology trends that are disrupting the traditional data management and processing landscape [7, 12]. Apache Hadoop is a fast-growing big-data processing platform defined as “an open source software project that enables the distributed processing of large data sets across clusters of commodity servers”. It is designed to scale up from a single server to thousands of machines, with a very high
degree of fault tolerance. Rather than relying on high-end hardware, the resiliency of these clusters comes from the software’s ability to detect and handle failures at the application layer. It uses distributed file system to store data. It brings processing to the data, not data to processing unit. Processing of data in the Hadoop framework is done using a MapReduce program. MapReduce framework is the powerhouse behind most of today’s big data processing. The key innovation of MapReduce is the ability to take a query over a data set, divide it, and run it in parallel over many nodes. This distribution solves the issue of data too large to fit onto a single machine. A MapReduce program consists of three main parts: a Mapper, Reducer and a Driver.
2.5.1 Mapper
The first phase of a MapReduce program is called mapping. A list of data elements are provided, one at a time, to a function called the mapper, which transform each element individually to an output data element.
Fig. 2.2.: Mapping of input to output
2.5.2 Reducer
Reducing lets you aggregate values together. A reducer function receives an integrator of input values from an input list. It then combines these values together, returning a single output value.
Fig. 2.3.: Reducing the input values to a single output value
2.5.3 Driver
The driver initializes the job and instructs the Hadoop platform to execute your code on a set of input files, and controls where the output files are placed. It is the calling function for the mapper and reducer. It allows us to set different configuration for the task such as the type of the <key, value> pair.
Hadoop enables a computing solution that is: 1. Scalable.
2. Cost effective. 3. Flexible. 4. Fault tolerant.
3.
OUR APPROACH
The Internet has spawned different types of information sharing systems, including the Web. Recently, online social networks have gained significant popularity and are now
among the most popular sites on the Web. For example, Twitter, Facebook are popular sites built on social networks [2].
Measuring the current public interest is a challenging task. The traditional approach would require questioning a large number of people about their feelings. Social media, such as Twitter or Facebook, can easily become a valuable source of information about the public due to the fact that people use them to express their feelings in public.
We have gathered information from the social network site regarding the person or group. For example from twitter, number of followers of the person or group and gathering tweets from social media outlets. We have used the Perl to design a Scrapper to collect the above mentioned information. The dataset of 49.2 millions tweets that were generated between January 2014 and June 2014 was analyzed. The data were collected from the 12 largest cities in India.
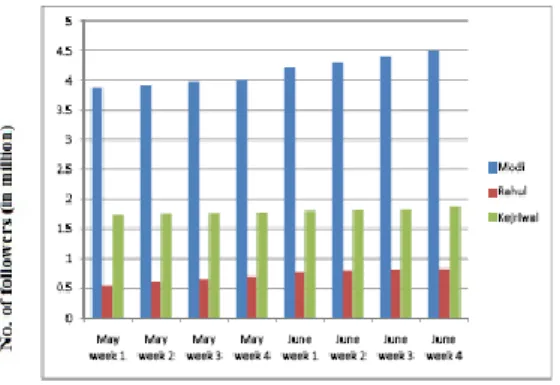
We focused on tracking mainly three politicians who are Narendra Modi, Rahul Gandhi and Arbind Kejriwal. For each person, we track a list of associated words and we count the frequencies that these words appear in tweets. For example, For Noredra Modi, associated words like Chief Minister of Gujrat, BJP prime ministerial candidate etc.
Then we have used MapReduce framework, a distributed file system (DFS) initially partitions data in multiple nodes and data is represented as (key, value) pairs. The computation is carried out using two user defined functions: map and reduce. Both map and reduce functions take a key-value pair as input and may output key-value pairs.
3.1 Mapper
1. Read the file in the particular Data node line by line. 2. Use of a reference file containing different aliases of a person of interest to check the number of times he/she is being mentioned in the above line. 3. Map the name of the person to the number being
mentioned.
4. The output of the Mapper is a <key, value> pair, the name of the person being the key and the number being the value.
3.2 Reducer
1. Takes the output of all mappers from different data nodes.
2. For each unique key, it combines all the values. 3. The output of the reducer is then written into a file
in the Hadoop distributed file system.
4.
IMPLEMENTATION AND RESULT
ANALYSIS
We have used Perl to create a scraper. This scraper has entered a specific twitter account and collects the number of followers of a group of people of interest. Another scraper created using Perl collects the tweets from the twitter pages from the different news media. Then the collected data are stored in different files. These files are then stored in the Hadoop distributed file system.
Using Perl we have designed a scraper which collects information from a predefined account in twitter and different news outlets from twitter like Indiatoday, Electronicexpress, Ibnlive, Telegraph, Ndtv, Timesnow, Indiatvnews, Zeenews, Times of India, Telegraph, Airnews etc. This information is stored in text file.
Then we have used Apache Hadoop to analyze the above mentioned files. This is done by using a MapReduce program written in Java. After running the MapReduce program, we get an output file showing the people of interest and the number of times they were mentioned.
Analyzing the popularity of Narendra Modi, Rahul Gandhi and Arbind Kejriwal during the general election of 2014 in India and their popularity figures are reflected in following graphs.
Fig. 4.1: Graph: No. of Followers Vs Duration
Fig. 4.1: Graph: No. of Comments Vs Duration
5.
CONCLUSION
Today, social networks, mobile phones, sensors and science contribute to terabytes or even petabytes of data created daily. Thus, analysis of such a large amount of data demands for a proper tool and Apache Hadoop which is a framework for distributed processing of data was the solution that we needed. We have described in this paper the method that can detect persons, events and topics applied on large set of documents.
Computational methods are far more efficient in retrieving, translating and coding these data that eliminates possible errors by human analysts. We used common practices in text analysis. Using MapReduce, we designed the process to know the popularity of different persons. Popularity analysis can be useful in many spheres such as in marketing, determining the popularity and finding the public view of a product.
While our focus was on the textual analysis of news content, other researchers may focus on different types of data: for example search engine queries. Further, the exploitation of unstructured data is becoming a major area of concern in computer science and we can expect fast progress in the next few years. In addition, Big Data is going to continue growing in the near future, and each data scientist will have to manage much more amount of data every year.
6.
ACKNOWLEDGMENT
Our thanks to all staffs of Information Technology, North-Eastern Hill University who have supported towards development of work.
7.
REFERENCES
[1] Brooker, R. G. 2003. Methods of Measuring Public Opinion. Central Washington University USA.
[2] Flaounas, I., Sudhahar, S, Lansdall Welfare, T., Hensiger, E., Cristianini, N. 2002. Big Data Analysis of News and Social Media Content. Intelligent Systems Laboratory, University of Bristol.
[3] Flaounas, I, Ali, O, Turchi, M, Snowsill, T, Nicart, F, De Bie, T, Cristianini, N. 2011. NOAM: news outlets analysis and monitoring system, SIGMOD Conference, ACM, pp. 1275-1278.
[4] Big Data for Development: Challenges and Opportunities. Global Pulse, 2012.
[5] Letouze, E. 2011. Big Data for Development: Opportunities & Challenges.
[6] Boyd, D. and Crawford, K. “Critical Questions for Big Data”. Information, Communication and Society, 2012 15(5):662-679.
[7] Valova, I. and Noirhomme, M. 2008. Processing Of Large Data Sets: Evolution, Opportunities and Challenges. Proceedings of PCaPAC08.
[8] Bakshi, K. 2012. Considerations for Big Data: Architecture and Approach. IEEE.
[9] Zikopoulos, P., Eaton, C., DeRoos, D., Deutsch, T. and Lapis, G. 2011. Understanding Big Data: Analytics for Enterprise Class Hadoop and Streaming Data. McGraw-Hill Companies, Incorporated.
[10] Big Data: The next frontier for innovation, competition, and productivity. 2011. McKinsey & Company.
[11] Advanced ‘Big Data’ Analytics with R and Hadoop. 2011. Revolution Analytics White Paper.
[12] McKendrick. J. 2012. Big Data, Big Challenges, Big Opportunities. 2012 IOUG Big Data Strategies Survey. [13] Nandimath, J., Patil, A., Banerjee, E., Kakade, P. 2013.
Big Data Analysis Using Apache Hadoop. IEEE IRI, pp-700-703 USA.
[14] Lewis, D., Yang, Y., Rose, T. G. and Li F. “RCV1: A New Benchmark Collection for Text Categorization Research”, Journal of Machine Learning Research 5, 2004. pp. 361–397.
[15] Lee, K.H., Lee, Y.J., Choi, H., Chung, Y. D. and Moon, B. 2012. Parallel data processing with MapReduce: a survey. ACM SIGMOD Record. Vol. 40, no. 4, pp. 11-20.
[16] Parker, C. 2012. Unexpected challenges in large scale machine learning. In Proceedings of the 1st International
Workshop on Big Data, Streams and Heterogeneous Source Mining: Algorithms, Systems, Programming Models and Applications, BigMine '12, pages 1-6, New York, USA 2012 ACM.
[17] Gopalkrishnan, V., Steier, D., Lewis, H. and Guszcza, J. 2012. Big data, big business: bridging the gap. In Proceedings of the 1st International Workshop on Big Data, Streams and Heterogeneous Source Mining: Algorithms, Systems, programming Models and Applications, Big-Mine '12, pages 7-11, USA.
![Fig. 2.1.: Three V’s of Big Data [4]](https://thumb-us.123doks.com/thumbv2/123dok_us/8993984.2384226/2.892.97.404.164.357/fig-v-s-big-data.webp)