The health and safety
of Australia’s farming community
A report of the National Farm Injury Data Centre for the Farm Safety
Joint Research Venture
Lyn Fragar
Richard Franklin
May 2000
Funded by the Farm Health and Safety Joint Research Venture
and New South Wales Health
© Rural Industries Research and Development Corporation and 2 Agricultural Health and Safety
All rights reserved ISBN 0 642 58141 X
Publication No: 00/111 Project Number AHU-3A
The views expressed and the conclusions reached in this publication are those of the authors and not necessarily those of persons consulted. RIRDC and the ACAHS shall not be responsible in any way whatsoever to any person who relies in whole or in part on the contents of this report.
The report is copyright. However, RIRDC and the ACAHS encourage wide dissemination of their research, providing that these organisations are clearly acknowledged. For any other enquiries concerning reproduction, contact the RIRDC Publications Manager on phone 02 6272 3186, or the Manager, NFIDC on 02 6752 8215.
Researcher contact details: L Fragar
Australian Centre for Agricultural Health and Safety Department of Public Health and Community Medicine University of Sydney PO Box 256 Moree NSW 2400 Phone: 02 6752 8210 Fax: 02 6752 6639 Email: lfragar@doh.health.nsw.gov.au
RIRDC contact details:
Rural Industries Research and Development Corporation Level 1, AMA House
42 Macquaries Street Barton ACT 2600 PO Box 4776 Kingston ACT 2604 Phone: 02 6272 4539 Fax: 02 6272 5877 Email: rirdc@rirdc.gov.au Website: Http:www.rirdc.gov.au Published in May 2000
The suggested citation is:
Fragar LJ, Franklin RC (2000). The health and safety of Australia’s farming community. ACAHS & RIRDC: Moree
Foreword
The health and safety status of the people engaged in production agriculture is of critical importance to the general well-being and productivity of the industry itself and of the rural communities supporting and supported by the industry.
The Rural Industries Research and Development Corporation has taken the lead in assembling the Farm Health and Safety Joint Research Venture to address the problem. The Joint Venture includes the Rural Industries Research and Development Corporation, the Woolmark Company, the Grains Research and Development Corporation, the Cotton Research and Development Corporation and the Sugar Research and Development Corporation .
The Joint Venture is investing in a program of research in farm occupational health and safety, including funding of the National Farm Injury Data Collection, that is maintained by the National Farm Injury Data Centre at the Australian Centre for Agricultural Health and Safety.
This document, as a summary report, provides a useful overview that complements the growing number of more detailed reports on specific problems, for specific industries and for specific regions. These are serving to inform health improvement and injury prevention programs of the Farmsafe Australia network and industry.
The ongoing funding assistance of NSW Health to the Australian Centre for Agricultural Health and Safety is gratefully acknowledged.
Peter Core Managing Director
© Rural Industries Research and Development Corporation and 4 This report is a summary of data that has been collected by a number of other researchers and agencies around Australia. Source data has included government agencies – workers compensation and hospital data collections, the National Occupational Health and Safety Commission and state work health authorities; Divisions of General Practice; research centres and individual researchers.
A number of individual people have made particular contributions to the gathering of information about the health and safety of the population of people engaged in agricultural production in Australia, and should be recognised for that contribution. They include: Kathy Challinor, Keith Ferguson, James Harrison, Tim Driscoll, Lesley Day, Rebecca Mitchell, Andrew Page and Rosie Hewitt. We gratefully acknowledge their contribution.
Abbreviations
ABS Australian Bureau of Statistics
ACAHS Australian Centre for Agricultural Health and Safety EVAO Estimated value of agricultural outputs
ILO International Labour Organisation OHS Occupational Health and Safety
RIRDC Rural Industries Research and Development Corporation ROPS Roll Over Protective Structure
NIHL Noise induced hearing loss
NOHSC National Occupational Health and Safety Commission OHS Occupational Health and Safety
© Rural Industries Research and Development Corporation and 6 Page Foreword iii Acknowledgments iv Abbreviations v Contents vi
Executive summary viii
1. Background 1
2. Australian agriculture and factors of importance to health 3
3. The health hazards in agriculture 9
4. The health and safety of Australian farming populations 12
4.1 Deaths on Australian farms 13
4.1.1 Injury deaths on Australian farms 13
4.1.2 Road traffic deaths of farmers and farm workers 17
4.1.3 Cardiovascular disease deaths of farmers 20
4.1.4 Cancer deaths of farmers 22
4.1.5 Suicide deaths of farmers 23
4.2 Workers compensation and farm injury 26
4.3 Injuries on farms resulting in hospital admission 32
4.4 Farm injury reported by other sources 36
4.4.1 Emergency Department based information 36
4.4.2 Rural doctor surgery based information 37
5. Child injury on farms 42
6. Tractor and farm machinery injury 48
6.1. Tractor related deaths in Australia 49
6.2. Tractor rollover deaths 51
6.3. Tractor run-over and safe tractor access 52
6.4. Farm machinery injury 54
7. Farm Motorcycle injury 56
8. Pesticides and human health 61
8.1 Pesticide use in agriculture in Australia 61
8.2 Pesticide toxicity 62
8.3 Long term effects of pesticides 67
8.4 Deaths associated with agricultural chemicals in Australia 68 8.5 Workers compensation claims relating to agricultural
pesticides
68
8.6 Hospital admissions 70
8.7 Worker exposure studies 71
8.8 Other studies 71
8.9 Community exposure to pesticides 72
9. Noise damage 75 10. Zoonoses 82 10.1 Leptospirosis 82 10.2 Q fever 84 10.3 Hydatid disease 87 11. Respiratory disease 91
© Rural Industries Research and Development Corporation and 8
Title: The health and safety of Australia’s farming community
Authors: Fragar LJ and Franklin RC
ISBN: 0 642 58141 X
This is an overview report of the health and safety of the population engaged in agricultural production in Australia.
There is no single database that holds all the information necessary to define the nature and scale of the health and safety problems of the framing population. It has thus been necessary to collate the available data into a ‘mosaic’, and to pursue the use of the Farm Injury Optimal Dataset to ensure commonality in definitions and information collected by various agencies and researchers.
The continuing re-structuring of agriculture, in the face of cost-price pressure adds complexity to the maintenance of effective occupational health and safety programs on farms.
1. There is evidence of poor health status of male farmers in Australia. Male farmers face about a 40 percent increase in age standardised death rates compared to the male population of Australia, with increased death rates from farm injury, road traffic injury, cardiovascular disease, some cancers and suicide.
2. On farm non-intentional injury results in around 150 deaths, around 6,500 admissions to hospital and close to 6,000 workers compensation claims each year.
There are between 20 and 70 presentations to hospital Emergency Departments for farm injury per 100 farms, depending on the nature of the agricultural enterprises.
3. It should be noted that the agricultural industry or enterprise type tends to be the greater predictor of injury risk in relation to rate of injury, nature of injury and agents of injury, rather than geographic location per se.
4. Child deaths and injury is an important health and safety problem to be addressed on Australian farms. Drowning in farm dams and bodies of water is the most common cause of death of toddlers on farms, and farm vehicles, motorcycles, horses and other animals are important agents of injury for older children.
While the issue of at what age children are safe to undertake farm tasks is receiving significant attention in North America, only eight percent of children who died on Australian farms in 1989-1992 were engaged in farm work activity, and for ED presentations for child injury on farms in two zones in NSW, 21 percent were related to farm work.
5. Tractor deaths due to rollover and run-over remain major causes of on-farm death in Australia. This is despite the early moves being made to define preventable factors and to move for the retro-fitment of ROPS on older tractors.
Data being collated by the National Farm Injury Data Centre, and by the newly instituted National Tractor Deaths Register will continue to provide important information to reduce risk.
6. Motorcycle injury on farms is an emerging OHS problem for the agricultural industries. Deaths on farms are associated with both 2- and 4- wheeled motorcycles, and it is estimated that around 400 – 500 admissions to hospitals occur each year due to injury associated with motorcycles on farms.
7. While pesticides would not rank highly as a priority for farm injury prevention on the basis of the number of deaths or actual poisoning events, there is a widespread concern by the industry and by the wider community over safety issues surrounding pesticide usage. Furthermore, individual cases of exposure can result in high cost.
8. The only data that describes the nature and extent of noise damage in agriculture in Australia is New South Wales. South Australian health workers are providing hearing screening services to farmers, however reports are not available to assist in defining the problem for the industry.
The information that is available indicates a major, disabling problem for farmers and farm workers. The problem is commencing at a young age, and is progressive and permanent.
9. Leptospirosis notifications are increasing in Queensland and New South Wales, and have declined in Victoria. Workers in the dairy, banana, cane and meat works industries are at risk of contracting the disease through contact with infected urine of carrier animals. Q fever is a well established hazard for abattoir workers in Australia, and in dairy and beef cattle farmer and farm workers at least in the coastal and tablelands of eastern Australia. It would appear that the disease is prevalent in Australian sheep, and in kangaroos.
10.Hydatid disease is a significant disease in Australia, which is under-reported. It is a hazard to rural workers and others who handle dogs in rural areas.
11.More work is required for a full analysis of available information regarding respiratory disease in the piggeries industry and in the grain and cotton industries in Australia.
12.The true estimates of current cost of farm injury are not immediately available, but could be between $0.5 and $1.29 billion per annum. What information is available indicates: • In addition to medical costs, farm injury results in significant direct farm costs such as
damage to plant and equipment and labour costs.
• Costs appear to vary depending on the industry in which injured persons are working at the time of injury
• The full costs of farm injury are probably not being borne by the industry.
• Further work to define the costs of farm injury, and the benefits of farm safety programs is required.
© Rural Industries Research and Development Corporation and 10 There has been an increasing interest in the health and safety of the farming population in Australia over the past 5-10 years, as information has emerged that details the nature, scale and costs of work related injury and illness for this sector. In NSW, for example, the workers compensation premiums for agriculture are currently more than ten percent of wages.
For the period 1989 – 1992, there were 20 deaths per 100,000 workers in agriculture, compared to the ‘all industries’ average of 5.5 deaths per 100,000 workers 1.
Australia is not alone in highlighting this problem, and there has been a concomitant increase in attention to the problem internationally. The United States, Canada, the Scandinavian countries, Germany and New Zealand are among the countries that have invested in farm injury research and prevention.
Agricultural industry, government and other stakeholder organisations that are member agencies of Farmsafe Australia are committed to addressing this problem2. Farmsafe Australia has set its goals and targets for farm injury prevention, and is working within a defined strategic approach to achieve these targets.
The collection and analysis of farm related injury for the purposes of injury prevention poses a number of methodological problems. These relate to:
− Small numbers – there are only around 140 000 agricultural enterprises across Australia.
− The geographic spread of agricultural enterprises
− The variety of agricultural enterprise types – (commodities produced)
− The lack of reliable denominator data to define the agricultural workforce – particularly farm family members exposed to injury risk
− The changes and restructuring of agricultural industry occurring in response to input costs and commodity prices, and technology changes.
− No single database is adequate to define and describe the injury/illness problem for agriculture. The Workers Compensation database contains only around 15% of farm injuries that present to hospital Emergency Departments. Emergency Departments do not treat a range of injuries that are treated by doctors in their rooms3.
− Differing definitions used by different agencies collecting injury relating to agriculture. The National Farm Injury Data Centre has collated available data to prepare this and other reports of farm injury, and works with industry based Reference Groups to ensure that reports are suitable for use by key stakeholders.
This report provides a broad description of the nature and scale of the farm injury problem in Australia, and is complemented by other more detailed reports for specific agricultural industries.
2. Australian agriculture and factors of importance to health
Number of farm holdings
The 1995/96 agricultural census conducted by the Australian Bureau of Statistics was completed by 143,211 producers, each reporting an estimated value of agricultural output greater than $5,000 (EVAO). This data is broken down by state in Table 2.1.
The scale of Australian agriculture in terms of area, is large with some 469,053,831 hectares being devoted to agricultural production (ABS, Agstats, 19944).
Table 2.1: Numbers of Australian farming (agricultural establishments) units with an EVAO of $5,000
Year Qld NSW Vic Tas SA WA NT ACT Total
1986 No.farms 33,745 51,728 43,931 5,199 18,739 16,004 267 103 169,716 1996 No.farms 31,371 41,578 36,146 4,464 15,562 13,640 221 95 143,211 Number Decrease 2374 10150 7785 735 3177 2364 46 8 26505 Percent reduction 7.0 19.6 17.7 14.1 17.0 14.8 17.2 7.8 15.6
Agricultural establishments range in size from a few hectares to millions of hectares. The number of farms in Australia has steadily declined in the post war period. The number of farms in the early 1950’s was estimated at more than 205,0005.
Commodities produced
Agriculture in Australia produces a wide variety of products that can be categorised by industry. Table 2.2 demonstrates the proportion of farm establishments by major industry group in Australia in March 1993.
The Australian Centre for Agricultural Health and Safety has mapped agricultural zones of importance to health6.
© Rural Industries Research and Development Corporation and 12
Statistics
ANZIC Code Qld NSW Vic Tas SA WA NT Total Percent
Plant nurseries 696 679 287 38 125 156 0 1981 1.4
Cut flowers and flower seed 189 215 209 46 125 130 0 914 0.6
Vegetable growing 1376 701 1005 615 561 567 0 4825 3.4
Grape growing 88 788 1733 68 1769 268 0 4714 3.3
Apple and pear growing 109 205 431 167 130 224 0 1266 0.9
Stone fruit growing 89 471 256 23 330 164 0 1333 0.9
Kiwi fruit growing 5 30 9 0 0 9 0 53 0.04
Fruit growing nec 2127 1651 375 35 666 299 134 5287 3.7
Grain growing 1764 3346 3054 22 3732 2729 0 14647 10.2
Grain-sheep/beef cattle farming 1900 7254 2860 102 2753 3688 0 18557 13.0
Sheep-beef cattle farming 1022 4779 3084 443 1084 628 0 11040 7.7
Sheep farming 771 5171 4691 635 1468 1759 0 14495 10.1
Beef cattle farming 11751 10574 8155 1169 1203 1898 221 34971 24.4
Dairy cattle farming 1912 2047 7933 791 825 463 0 13971 9.8
Poultry farming meat 98 331 161 15 71 57 0 733 0.5
Poultry farming eggs 103 145 110 14 43 85 0 500 0.4
Pig farming 428 369 196 35 169 127 0 1324 0.9
Horse farming 524 558 333 44 106 110 0 1675 1.2
Deer farming 55 99 106 38 50 40 0 388 0.3
Livestock farming nec 668 973 805 87 216 162 0 2911 2.0
Sugar cane growing 4603 462 0 0 0 0 0 5065 3.5
Cotton growing 508 465 0 0 0 0 0 973 0.7
Crop and plant growing nec 585 265 353 77 136 77 0 1493 1.0
Total 31371 41578 36146 4464 15562 13640 221 143116 100.0
Farm household residents
The Annual Farm Survey conducted by the Australian Bureau of Agricultural and Resource Economics (ABARE) has included information relating to farm households. For the year 1994/95, ABARE reported the following derived from survey of commercial farms in the broadacre and dairy industries7:
Table 2.3: Farming households 1994/95
Households People per
household Broadacre farms
People per household Dairy farms Owner manager households
On-farm 75869 3.08 3.20 Off-farm 8379 2.77 1.35 Total 84248 3.05 3.10 Other households On-farm 30800 2.20 2.57 Off-farm 28652 Na na Total 59452 Na na Total households On-farm 106670 2.92 3.12 Off-farm 37031 Na na Total 143701 Na na
Table 2.4: The composition of owner manager households 1994/95
Percent of households
Owner manager only 9
Owner manager and spouse 34
Owner manager, spouse and householder/s under 20 years 33
Owner manager, spouse and other adult/s 13
Other 11
Source: Garnaut J et al. 1998 People in farming. ABARE
The age/gender distribution of households – Owner-manager and other on-farm households is displayed in Figure 2.1.
Figure 2.1: The age and gender distribution of people in owner manager households (both on-farm and off-farm) and other on-farm households. 1994/95
Source: Garnaut J et al. 1998 People in farming. ABARE
a. Owner manager households
4 10 6 8 6 12 28 16 8 3 4 11 7 9 4 13 30 13 7 1 0 5 10 15 20 25 30 35 0-4yr 5-11yr 12-14yr 15-19yr 20-24yr 25-39yr 40-54yr 55-64yr 65-74yr 75+yr Male Female
b. Other on-farm households
12 12 5 3 6 36 12 4 5 4 9 13 3 2 4 35 11 8 7 6 0 5 10 15 20 25 30 35 40
© Rural Industries Research and Development Corporation and 14 1994/95 using this survey data is shown in Table 2.5.
Table 2.5: Estimated on-farm resident population of children and adolescents 1990/91, 1994/95
1990/91 1994/95
Age group
Male Female Male Female
0-4 12107 11076 10247 7500
5-14 17038 18569 18543 17046
15-19 8302 8562 10260 9241
Source: Garnaut J et al. 1998, People in farming. ABARE
The farm workforce
A survey conducted by ABARE of farm managers/owner operators of broadacre and dairy farms in Australia in 1993/1994 found that the average of broadacre and dairy farmer is increasing, and was 52 years.
Figure 2.2 demonstrates the age structure of male farmers/farm managers by state in 1991. Data is inadequate to display information about the age structure of female farmers/farm managers.
The proportion of farmer/farm managers over the age of 65 is of significance to health. The increasing age of farmers sees them continuing their agricultural activities, with a concomitant increasing prevalence of chronic degenerative medical conditions. These result in further stress as physical activity is more limited, and risk of injury is increased. It is to be expected that the prevalence of organic brain disorders among farming people will increase.
Figure 2.2: Age distribution of Farm Owners/ Managers 1991
Figure 2.3 demonstrates the age structure of male agricultural labourers in 1991 by state as reported in the Population Census.
Age distribution males farmers/farm managers 1991
Australia 65+ 60-64 55-59 50-54 45-49 40-44 35-39 30-34 25-29 20-24 15-19 0 2 4 6 8 10 12 14
Figure 2.3: Age distribution of agricultural workers 1991
Economic realities of Australian agriculture
Australian agriculture has experienced continuing declining terms of trade - the index of farm prices paid continues to outstrip the index of prices received. Economic conditions within the international and domestic spheres plus the technological revolution and ‘economies of scale' have brought about the steady decline in the number of farms (Pestana, 1994) – See Table 2.1. The size of farming operations has seen a corresponding doubling of size in the average individual agricultural enterprise.
The majority of farms in Australia are still family owned and operated. Only five percent of farms are categorised as corporate farms and run as public or private companies. This does not include family farms which operate under a company structure for tax and other business reasons (Pestana, 1994). Sixty percent (60%) of farms are operated under a family partnership arrangement, with 29% of farms having sole operators.
In summary:
Australian agriculture is not homogeneous in terms of:
− Commodities produced, and therefore production systems posing OHS risk
− Changes occurring over time, restructuring of farm systems over time
− Workforce characteristics – with varying age characteristics according to production system needs.
The persons at risk of injury and work-related disease include farm family members, and members of all households physically located on farms. In addition, visitors to farms are at risk, and will include family visitors.
Data presented in this report regarding deaths, injury and illness reflect these characteristics.
Age distribution male agricultural labourers 1991
Australia 65+ 60-64 55-59 50-54 45-49 40-44 35-39 30-34 25-29 20-24 15-19 0 5 10 15 20 25
© Rural Industries Research and Development Corporation and 16 There has long been recognition that agricultural production is associated with significant risk to safety and health. In 1980 the World Health Organisation issued a report of a workshop held in Geneva in November 1979, titled Workshop on occupational health care in agriculture.8
The hazards to health in that publication were defined in relation to the characteristics of agricultural production processes. This model has been used as the basis for Figure 3.1. While there are more advanced systems of classifications of occupational injury and disease, this early description provides a perspective that takes into account some of the more unique hazards to the industry.
In 1988, Worksafe Australia, the Department of Primary Industry and Energy and the University of New England, convened the first national conference on farm health and safety in Australia – Farmsafe ’88. The conference identified a wide range of health and safety issues of importance in Australian agriculture, and served as a springboard from which a more directed program of research and prevention activity has been implemented9.
A similar major national conference in the United states was convened by the Surgeon General to consider agricultural safety and health, and the report of the proceedings outlined eleven leading work-related diseases and injuries for that country.
More recently, a Working Paper has been prepared by the International Labour Organisation (ILO) to prompt discussion on occupational health and safety for workers in agriculture10. This was prepared with a view to determining the interest of member countries in adopting an instrument or instruments concerning safety and health in agriculture, and will be considered at the 88th Session in 2000. The Working Paper draws attention to the following concerns: 1. Overlapping categories of workers - lack of clear-cut distinctions between different
categories of workers and size and types of landholdings.
2. Technical development and agriculture – heterogeneous and multifaceted sector, variable working conditions from industry to industry and country to country.
3. Occupational accidents and injury – machinery, animals. 4. Agrochemical exposure
5. Occupational and work related diseases - Zoonoses
- Skin disorders
- Respiratory disorders - Occupational cancer
- Impairment due to noise and vibration
- Relation between general disease and work related disease 6. Under-reporting
7. Access to health services
8. Coverage under national legislation 9. Relevant International Standards
- pesticide poisoning - resistant strains organisms
- diseases due to noise/ vibration - ergonomic problems - psychosocial problems - injury - psychoneurotic/ psychosomatic diseases - diseases due to physical weakness/ injury strain
- heat prostration - frost bite - bush fires
- dust - borne diseases - zoonotic diseases - snake bite - animal handling injury
- pesticides - other chemicals - antibiotics
- mechanisation 1. Technology to increase production
- stress - fatigue
2. Prolonged working hours, overexertion - sun/ heat - cold - rain - dusts 3. Exposure to ambient environment - diseased animals - harmful animals - vectors
- bacteria, fungi, parasites 4. Work and life close
to animals
© Rural Industries Research and Development Corporation and 18 What is significant is the wide variety of hazards to health and safety faced by most people in the farm workplace. It could be agued that this is the most significant aspect of OHS on farms that impedes ready adoption of OHS principles and practice in the industry.
There is a growing international literature reporting research findings in a number of areas. These include:
1. Farm injury, particularly work related injury – this literature has focussed on risk factors for tractor and machinery injury, and animal handling injury.
2. Pesticides exposure and health effects
3. Respiratory disease – particularly in the animal confinement industries of the northern hemisphere - ie pig and dairy production
4. Health status and risks of immigrant seasonal workforce in the United States
In Australia, the first record of concern about safety on farms is a paper in the Agricultural Gazette in February 1958 by Nancy Foskett, a Senior Extension Officer (Women’s Service) in the NSW Department of Agriculture 11. This paper focussed on safety in the farm family setting. There has been little attention to reporting the overall health status of the population of people engaged in agricultural production. A preliminary paper was presented at the First Rural Public Health Conference in 199712.
This paper describes a number of the key problems described in the WHO workshop report. Not all hazards that exist on farms will be addressed. Rather the major risks, in terms of death, injury, cost and/or prosecution/ litigation, have been identified and will be described as far as is possible with existing data. Other publications of the National Farm Injury Data Centre will address state and industry specific occupational health and safety issues in agriculture.
4. The health and safety of Australian farming populations
There is early evidence from deaths data that Australian male farmers experience higher death rates than the Australian male population. A paper presented at the National Rural Public Health Conference in 1997 reported that the age standardised death rate for male farmers aged 15-65 years in the period 1990-1993 was 39% greater than the age standardised death rate for the working male population13.
Excessive higher rates of deaths of male farmers are associated with circulatory disease, neoplasms (cancer) and injury (Table 4.1).
Table 4.1 Standardised mortality ratios male farmers/ farm managers by 5 broad disease groups 1990-1993 (Indirect method)
Cause of death Standardised
mortality ratio 95% CI L 95% CI U
Circulatory disease 162 151 173
Neoplasms (Cancer) 120 112 128
Respiratory disease 84 65 103
Injuries and poisonings 224 205 243
Other causes 86 74 98
All causes 139 134 144
Source: HealthWIZ National Social Health Database, reported in Fragar et al, 1997
Death rates were highest in the Northern Territory, New South Wales, Victoria and South Australia for male farmers / farm managers for all causes (Table 4.2).
Table 4.2 Standardised mortality ratios male farmers / farm managers - all causes by state 1990-1993 (Indirect method)
State
Standardised
mortality ratio 95% CI L 95% CI U
New South Wales 149 139 159
Victoria 149 138 160 Queensland 118 107 129 South Australia 149 132 166 Western Australia 121 105 137 Tasmania 131 100 162 Northern Territory 158 40 276 Australia 139 134 144
Source: HealthWIZ National Social Health Database, reported in Fragar et al, 1997
Unfortunately, similar data is not immediately available for females or for agricultural workers, and should be the subject of further investigation.
© Rural Industries Research and Development Corporation and 20 4.1 Deaths on Australian farms
Deaths information is very valuable in describing the nature and scale of injury and illness associated with agricultural production. Deaths and major permanently disabling injury represent the most severe and worrying outcome from injury/illness resulting from exposure to risk on farms and result in major family and community pain, grief, loss, adjustment and cost.
Deaths data that is readily available (eg through the Australian Bureau of Statistics deaths data) is usually only able to provide very general information – age, gender, cause of death and address information. Special studies accessing other databases (eg coroners’ records and road fatalities crash records) have been required to obtain more useful information about the circumstances and mechanisms of injury deaths. Current plans to computerise coronial records will provide more information about injury deaths than is currently accessible.
4.1.1 Injury deaths on Australian farms
• In the period 1982-1984 there were 19 deaths per 100 000 workers in agriculture14. • In the period 1989-1992 there were 20 deaths per 100 000 workers in agriculture15.
The National Occupational Health and Safety Commission undertook a study of work related deaths for the period 1989 to 1992, and has made a preliminary report of deaths in the agriculture industry16. The study was based on coronial records in all states and territories. The report identified, that in 1989-1992 there were 373 people employed in the agriculture industry who died in farm-related unintentional work related incidents. A further 72 working persons were killed who were not employed in agriculture and another 142 non-working persons – ie bystanders were killed as a result of farming activities.
A full and detailed report of agricultural industry deaths was published in June 200017. Some of the general findings are presented here.
Table 4.3 indicates the age group of those fatally injured in farm-related activities during the period 1989-1992, according to working status at the time of injury. The detailed report provides further analyses of age and gender factors associated with commodity groups, states, specific agents and specific mechanisms. There is also a section in the report that examines children (0-14 years), young adults (15-29 years) and older adults (55+ years) in detail.
Table 4.4 indicates the industry in which working persons who died in farm-related work activities were employed at the time of the injury. The detailed report provides a full breakdown for key industries of the farm-related fatalities for 1989-1992 (Section 2).
Table 4.3: Age group by work status, farm-related fatalities, Australia, 1989-1992
Age Group Working Bystander Other Farm Total %
<5 - 65 7 72 12.3 5 - 9 3 15 7 25 4.3 10 - 14 6 9 3 18 3.1 15 - 19 17 8 6 31 5.3 20 - 24 39 7 7 53 9.0 25 - 29 26 7 5 38 6.5 30 - 34 36 8 6 50 8.5 35 - 39 23 - 2 25 4.3 40 - 44 33 2 2 37 6.3 45 - 49 44 2 3 49 8.3 50 - 54 34 2 4 40 6.8 55 - 59 28 4 7 39 6.6 60 - 64 27 3 4 34 5.8 65 - 69 17 5 3 25 4.3 70 - 74 19 3 1 23 3.9 75+ 21 2 5 28 4.8 Total 373 142 72 587 100.0
Source: Franklin et al, 2000
Table 4.4: Farm enterprise by work status, farm-related fatalities, Australia, 1989-1992
Farm Enterprise Working Bystander Other Farm Total %
Agriculture 358 133 72 563 95.9
Poultry 1 2 - 3 0.5
Poultry for Meat 2 - - 2 0.3
Fruit 2 - - 2 0.3
Grapes 3 2 1 6 1.0
Plantation Fruit 3 2 1 6 1.0
Orchard and Other Fruit 10 10 1 21 3.6
Vegetables Including Potatoes 18 4 - 22 3.7
Cereal Grains, Sheep, Cattle, Pigs
53 18 7 78 13.3
Cereal Grains 21 1 1 23 3.9
Sheep, Cereal Grains 10 1 - 11 1.9
Meat Cattle, Cereal Grains 12 - 1 13 2.2
Sheep, Meat Cattle 19 3 5 27 4.6
Sheep 29 12 7 48 8.2 Meat Cattle 77 13 8 98 16.7 Dairy 10 9 4 23 3.9 Pigs 4 2 - 6 1.0 Other Agriculture 1 - - 1 0.2 Sugar Cane 11 1 2 14 2.4 Cotton 6 1 1 8 1.4 Nurseries 3 - - 3 0.5 Agriculture NEC 16 2 5 23 3.9
Aerial Agriculture Services 3 - - 3 0.5
Services to Agriculture 4 - - 4 0.7
Agriculture Not Known 40 50 28 118 20.1
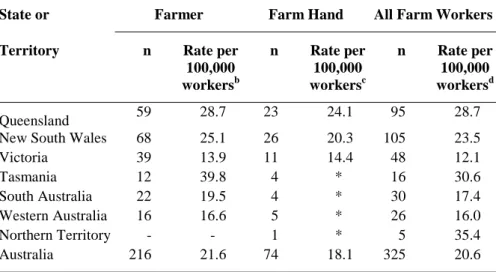
© Rural Industries Research and Development Corporation and 22 Tables 4.5 and 4.6 indicate the number and rates of fatalities that were farm related during 1989-1992 by state and territory. The detailed report provides a full breakdown of farm-related fatalities for each state and the Northern Territory (Section 3).
Table 4.5: Rate of fatalities a by state or territory by establishments, farm-related fatalities, Australia, 1991-1992
State or Territory n Number of
Establishments b
Rate per 10,000 Establishments
Queensland 151 33,181 11.4
New South Wales 193 44,443 10.9
Victoria 125 39,170 8.0 Tasmania 30 4,884 15.4 South Australia 41 17,511 5.9 Western Australia 57 14,790 9.6 Northern Territory 10 302 82.8 Australia 607 154,380 9.8
a Due to the low number of fatalities in some of the states there may be some problems with the stability of this rate.
Includes agricultural workers who were intentionally fatally injured.
b
Rates based on the 1991 agricultural census. Source: Franklin et al, 2000
Table 4.6: Rate of fatalitiesa by state or territory for farmers, farm hands and all farm workers, farm-related fatalities, Australia, 1989-1992
State or Farmer Farm Hand All Farm Workers
Territory n Rate per
100,000 workersb n Rate per 100,000 workersc n Rate per 100,000 workersd Queensland 59 28.7 23 24.1 95 28.7
New South Wales 68 25.1 26 20.3 105 23.5
Victoria 39 13.9 11 14.4 48 12.1 Tasmania 12 39.8 4 * 16 30.6 South Australia 22 19.5 4 * 30 17.4 Western Australia 16 16.6 5 * 26 16.0 Northern Territory - - 1 * 5 35.4 Australia 216 21.6 74 18.1 325 20.6
a Due to the low number of fatalities in some of the states there may be some problems with the stability of this rate. Includes
agricultural workers who were intentionally fatally injured.
b Incidence rates - deaths per 100,000 farmers per year in agriculture industry c Incidence rates - deaths per 100,000 farm hands per year in agriculture industry d Incidence rates - deaths per 100,000 farm workers per year in agriculture industry
* No rate calculated due to the low number of deaths Source: Franklin et al, 2000
Table 4.7 indicates the activity being undertaken at the time of the fatal incident by work status during 1989-1992.
Around 30 percent of all persons fatally injured on Australian farms between 1989 and 1992 were visitors to the farm.
Table 4.7: Activity at time of fatal incident by work status, farm-related fatalities, Australia, 1989-1992
Activity Working Bystander Other Farm Total %
Transport for Work Purposes 98 - - 98 16.7
Transport for Recreation - 27 11 38 6.5
Transport NEC - 11 2 13 2.2
Constructing or Installing 11 - 2 13 2.2
Maintenance 45 - 7 52 8.9
Earthmoving or Digging 11 - - 11 1.9
Slaughtering, Gutting or Shelling 3 - 1 4 0.7
Milling 1 - - 1 0.2
Felling Trees or Clearing Land 31 - 2 33 5.6
Firefighting 2 - - 2 0.3
Hunting 12 - 5 17 2.9
Working with Animals 51 - 3* 54 9.2
Working with Crops 49 - - 49 8.3
Mining Activities 1 - - 1 0.3
Monitoring, Observing, Inspecting 16 3 1 20 3.4
Moving Goods 29 - - 29 4.9
Rescuing 2 - 1 3 0.5
Work Break 2 - - 2 0.3
Recreation or Playing - 85 21 106 18.1
Household Domestic Work or Gardening
2 - 5 7 1.2
Assault - 1 - 1 0.2
Working – Context Unclear 1 - - 1 0.2
Other 3 12 8 23 3.9
Not Known / Not Stated 3 3 3 9 1.5
Total 373 142 72 587 100.0
* The three "other farm" fatalities were working with horses at the time of the fatality, but were clearly identified as recreational activities. Source: Franklin et al, 2000
Table 4.8 indicates the broad agent of injury causing unintentional death on farms during the period 1989-1992. The detailed report provides a breakdown of factors associated with key agents of injury deaths on farms.
© Rural Industries Research and Development Corporation and 24
Table 4.8: Agent of non-intentional injury death on farms 1989-1992 Agent of injury death Work
related deaths Bystander deaths Other on-farm deaths Total Farm utility 6 11 3 20 2 wheeled motorcycle 14 9 1 24 Aircraft 46 0 0 46 Other vehicle 50 23 9 82 Tractor 68 19 0 87 Grain auger 6 0 0 6
Other mobile machinery 24 5 0 29
Fixed plant/equipment 9 0 0 9 Workshop equipment 6 0 2 8 Materials 12 0 1 13 Dam 7 44 0 51 River/creek 8 2 9 19 Power lines 11 0 1 12
Other farm structure 20 14 5 39
Horse 21 3 0 24
Other animal 5 1 10 16
Hazardous substances 3 1 2 6
Trees being felled 17 3 2 22
Fire/smoke 4 0 13 17 Other working environment 10 1 4 15 Firearms 18 5 4 27 Other 8 1 6 15 Total 373 142 72 587
Source: Franklin et al, 2000
In summary:
Around 150 persons die from non-intentional injury on Australian farms each year. These deaths are of workers, bystanders to work and others and occur in a range of circumstances on farms of different agricultural enterprise types.
Further information regarding farm fatalities is to be found in the major analysis of farm injury deaths in Australia by Franklin et al, 20005.
4.1.2 Road traffic deaths of farmers and farm workers.
Rates of death of male farmers by road traffic accident were reported to be higher than that of the male population (age standardised) at the National Rural Public Health Conference in 1997 (Fragar et al, op cit).
Table 4.9 indicates the relative age standardised rates of death by road traffic accident for farmers and farm managers aged 15-64 for 3 periods using the HealthWiz databases for those periods. While the rate for the working aged population has declined over the time periods 1985 to 1995, the rate of decline appears to be much less for male farmers and farm managers in this age group.
Table 4.9: Road traffic deaths male farmers/ farm managers aged 15-64 in 3 time periods 1985-1989, 1990-1993, 1992-1995 Number, age standardised rates per 100000 population.
Time period Number deaths male
farmers
Direct age-standardised death rate male
farmers
95% Confidence
Interval
Death rate male working age population 95% Confidence Interval 1985-1989 263 42.1 36.6 - 47.5 32.7 32 – 33.4 1990-1993 132 37.7 46.3 - 29.1 22 21.3 - 22.6 1992-1995 127 38 29.1 - 46.9 20 19.4 - 20.6
Source: HealthWIZ National Social Health Database
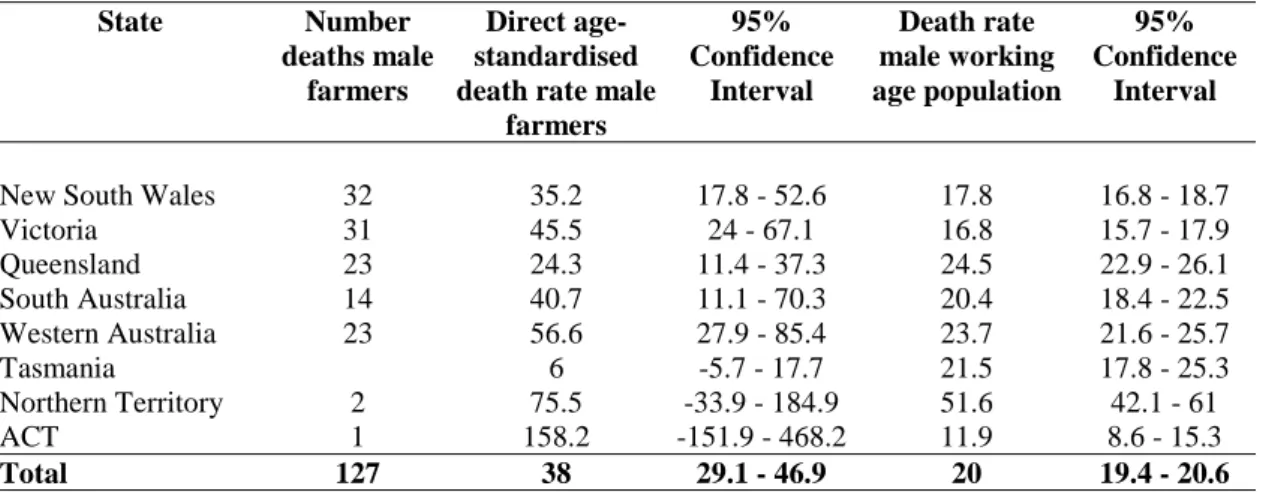
Rates of death of farm managers due to road traffic accident for the period 1992-1995 by state are indicated in Table 4.10
Table 4.10: Road traffic deaths male farmers/ farm managers aged 15-64 1992-1995 by state. Number, age standardised rates per 100,000 population.
State Number
deaths male farmers
Direct age-standardised death rate male
farmers 95% Confidence Interval Death rate male working age population 95% Confidence Interval
New South Wales 32 35.2 17.8 - 52.6 17.8 16.8 - 18.7
Victoria 31 45.5 24 - 67.1 16.8 15.7 - 17.9 Queensland 23 24.3 11.4 - 37.3 24.5 22.9 - 26.1 South Australia 14 40.7 11.1 - 70.3 20.4 18.4 - 22.5 Western Australia 23 56.6 27.9 - 85.4 23.7 21.6 - 25.7 Tasmania 6 -5.7 - 17.7 21.5 17.8 - 25.3 Northern Territory 2 75.5 -33.9 - 184.9 51.6 42.1 - 61 ACT 1 158.2 -151.9 - 468.2 11.9 8.6 - 15.3 Total 127 38 29.1 - 46.9 20 19.4 - 20.6
Rates for Western Australia and Victoria have significantly higher rates than the national age standardised rate of death for road traffic deaths.
A study undertaken by the Australian Centre for Agricultural Health and Safety in association with the Australian Transport Safety Bureau (ATSB) has reported key factors associated with road fatalities in the farming community18. That study will be reported in full, later in 2000. The study examined road traffic deaths of male farm managers and agricultural workers for the years 1988, 1990, 1992, 1994 and 1996. The data source was established by matching ATSB and Australian Bureau of Statistics files. Female deaths records inadequately defined female farm managers and farm workers and were excluded from the analysis. The following information was derived from the study.
Figure 4.1 displays the age distribution of farmers and farm workers who died on roads for the study period.
© Rural Industries Research and Development Corporation and 26
Figure 4.1: Age of farmer and farm worker road deaths. 1888, 1990,1992,1994 1996.
0 10 20 30 40 50 15-20 21-30 31-40 41-50 51-60 61-70 71+
Farm managers Farm workers
Source: Australian Centre for Agricultural Health and Safety.1999.
Crash circumstances
Crash circumstances were reported in relation to the number of vehicles involved in the crash and the distance from home to the site of the road accident resulting in death. Table 4.11 indicates that more than 80 percent of accidents involved single vehicles.
Table 4.11: Number of vehicles involved in road deaths of farmers and farm workers. 1988, 1990, 1992, 1994, 1996.
Number vehicles involved
Farm manager Farm worker Total Percent
1 155 98 253 82
2 32 21 53 17
3 2 0 2 1
Total 189 119 308 100
Source: Australian Centre for Agricultural Health and Safety.1999.
Figure 4.2 indicates that around 60% of road deaths of farmers and farm workers occurred within 50 kilometres from home.
Figure 4.2: Distance from home to site of road death of farmers and farm workers 1988, 1990, 1992, 1994, 1996. 0 10 20 30 40 50 60 70 80 90 100 <1 km 1-5 km 6-10km 11-50 km 51-100 km 101-500 km 501+ km Unknown Cumulative percent
Source: Australian Centre for Agricultural Health and Safety.1999.
Personal factors
Use of seat belts was reported in the study.
For both groups, managers and farm workers, 64.6% of vehicles had seat belts fitted to the vehicles. However, 34.3% of farm managers who had a seat belt fitted were not wearing it at the time of accident. For farm workers, 44.8% of those who had a seat belt fitted were not wearing them.
Of the 142 farm managers who died and who had blood alcohol tests, 33.8% had a blood alcohol reading greater than 0.05 g/100ml. For farm workers, 49.6% of the 59 who had a blood alcohol test had a level greater than 0.05 g/100ml.
Other factors will be reported in the full report, and will be the subject of consideration by farmers’ and farm workers associations within the Farmsafe Australia framework.
In summary:
Deaths of farmers and farm workers on roads appear to be an important cause of premature loss of life for this population. The search for preventable factors has begun with reporting of behavioural factors such as seat belt wearing and alcohol use being identified as significant contributors to road traffic deaths.
4.1.3 Cardiovascular disease deaths of farmers
Death rates (age standardised) of male farmers/farm managers due to cardiovascular disease were noted to be 62% higher than for the Australian male population for the period 1990-1993
© Rural Industries Research and Development Corporation and 28 Table 4.12 indicates the relative age standardised rates of death due to cardiovascular disease for farmers and farm managers in the age group 15-64 for 3 periods using the HealthWiz databases for those periods. Deaths from cardiovascular disease in this working age group appear to be declining in line with the national trend.
Table 4.12: Deaths due to cardiovascular disease of male farmers/ farm managers aged 15-64 in 3 time periods 1985-1989, 1990-1993, 1992-1995 Number, age
standardised rates per 100000 population. Time period Number
deaths male farmers
Direct age-standardised death rate male
farmers
95% Confidence
Interval
Death rate male working age population 95% Confidence Interval 1985-1989 1361 117 110.7 - 123.3 127.3 125.9 - 128.7 1990-1993 700 84 77.7 - 90.3 79.1 77.9 - 80.3 1992-1995 598 71.8 65.9 - 77.6 71.1 70 - 72.2
Source: HealthWIZ National Social Health Database
Rates of death of farm managers in the age group 15-64 due to specific cardiovascular diseases for the period 1992-1995 by state are indicated in Table 4.13.
Table 4.13: Age standardised death rates of farmers/farm managers aged 15-64 due to specific cardiovascular diseases 1992-1995
Number deaths farmers/farm managers Death rate farmers/farm managers per 100,000 direct age standardised 95% Confidence Interval Death rate male working population AGED 15-64 direct age standardised 95% Confidence Interval Heart disease -acute myocardial infarction 337 40.5 36.1 – 44.9 36.4 35.6 - 37.2 Heart disease -other ischaemic heart disease 168 19.7 16.7 – 22.7 23 22.4 - 23.6 Cerebrovascular disease – stroke 85 10.4 8.2 - 12.7 10.4 10 - 10.9 Cardiovascular disease 598 71.8 65.9 – 77.6 71.1 70 - 72.2
Source: HealthWIZ National Social Health Database
In summary
Further investigation of the previously reported increased rate of death from cardiovascular disease in the male farmer/farm manager population needs to be undertaken.
4.1.4 Cancer deaths of farmers
Farmers are reported in the international literature as having higher risk of certain cancers. These are often reported in the context of attempts to demonstrate association with chemical or other environmental exposures (see Chapter 8).
Age standardised death rates for certain cancers were noted to be higher for male farmers/ farm managers than for the male population of Australia, in the paper presented to the First National Rural Public Health Conference in 1997. Those cancers noted to be associated with higher death rates were:
! Cancer of the colon ! Cancer of the rectum
! Cancer of the skin – melanoma ! Other skin cancer
! Cancer of the prostate ! Cancer of the brain
Death rates for cancer of the lymphatic and haemopoietic tissues, while higher, were not statistically significantly different.
Table 4.14 indicates death rates for male farmers/farm managers' aged 15-64 for the period 1992-1995 in relation to rates for the working age population.
Table 4.14: Direct age standardised death rates for specified cancer, male farmers/farm managers aged 15-64. 1992-1995 Death rate farmers/ farm managers, direct age standardised 95% Confidence Interval Death rate working age population, direct age standardised 95% Confidence Interval
Cancer of the trachea,
bronchus & lung 18.4 15.5 - 21.3 24.1 23.4 - 24.7 Cancer of the colon 12 9.7 - 14.3 9.4 9 - 9.8 Cancer of the rectum 5.5 3.9 - 7.1 4 3.7 - 4.2 Cancer of the skin
-melanoma 7.2 5.1 - 9.2 4.8 4.5 - 5
Other cancer of the skin 1.5 0.7 – 2.4 1.4 1.3 - 1.6 Cancer of the prostate 7.9 5.9 - 10 3.8 3.5 - 4 Cancer of the brain 8.2 6.1 - 10.4 5.2 4.9 - 5.5
Leukaemia 5.8 3.8 - 7.8 3.9 3.6 - 4.2
Cancer of lymphatic &
haemopoietic tissue 8.1 6 - 10.2 6.9 6.5 - 7.2
All cancers 105.0 97.6-112.4 98.3 97.0 – 99.6
Source: HealthWIZ National Social Health Database
In summary:
Cancer incidence and death rates for the farming population of Australia needs further investigation and research to determine relative risk and causal factors.
© Rural Industries Research and Development Corporation and 30 A major prospective study of the health of farmers in two states in the United States that aims to recruit 75,000 participants will be an important study as it attempts to relate environmental and occupational exposures to health status20.
4.1.5 Suicide deaths of farmers
Rates of suicide deaths of male farmers were reported to be around double that of the male population (age standardised) at the National Rural Public Health Conference in 1997 (Fragar et al21).
For the period 1992-1995 there were 253 suicide deaths of male farmer/farm managers. Figure 4.3 indicates the age distribution of these suicide deaths.
Figure 4.3: Number of suicide deaths of farmers/farm managers by age 1992-1995.
0 5 10 15 20 25 30
15-19 years20-24 years25-29 years30-34 years35-39 years40-44 years45-49 years50-54 years55-59 years60-64 years65-69 years70-74 years75-79 years80-84 years85+ years
Number
Source: HealthWIZ National Social Health Database
Table 4.15 indicates the relative age standardised rates of suicide deaths for farmers and farm managers aged 15-64 year for three periods using the HealthWiz databases. While the rate for the working aged population has remained fairly steady, over the time periods 1985 to 1995, the rate of suicide death appears to have increased for male farmers and farm managers, although not at a statistically significant degree.
Table 4.15: Suicide deaths male farmers/ farm managers aged 15-64 in 3 time periods 1985-1989, 1990-1993, 1992-1995 Number, age standardised rates per 100000 population. Time period Number deaths male farmers Direct age-standardised death rate male
farmers
95% Confidence
Interval
Death rate male working age population 95% Confidence Interval 1985-1989 212 27.6 23.5 - 31.7 26.8 26.1 - 27.4 1990-1993 185 34.5 28.6 - 40.5 27.3 26.6 - 28 1992-1995 178 33.2 27.5 - 38.9 27.9 27.2 - 28.6
Source: HealthWIZ National Social Health Database
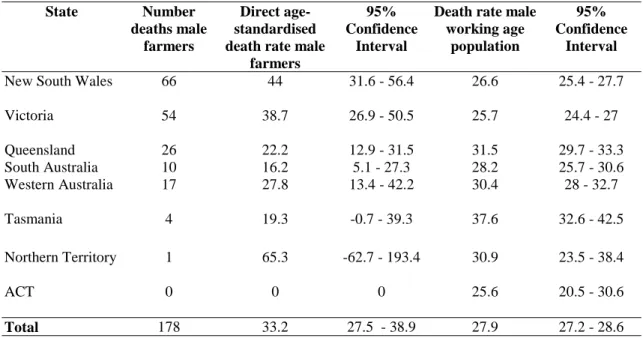
Rates of suicide death of farm managers for the period 1992-1995 by state are indicated in Table 4.16.
Table 4.16: Suicide deaths male farmers/ farm managers aged 15-64 1992-1995 by state. Number, age standardised rates per 100000 population.
State Number
deaths male farmers
Direct age-standardised death rate male
farmers
95% Confidence
Interval
Death rate male working age
population
95% Confidence
Interval
New South Wales 66 44 31.6 - 56.4 26.6 25.4 - 27.7
Victoria 54 38.7 26.9 - 50.5 25.7 24.4 - 27 Queensland 26 22.2 12.9 - 31.5 31.5 29.7 - 33.3 South Australia 10 16.2 5.1 - 27.3 28.2 25.7 - 30.6 Western Australia 17 27.8 13.4 - 42.2 30.4 28 - 32.7 Tasmania 4 19.3 -0.7 - 39.3 37.6 32.6 - 42.5 Northern Territory 1 65.3 -62.7 - 193.4 30.9 23.5 - 38.4 ACT 0 0 0 25.6 20.5 - 30.6 Total 178 33.2 27.5 - 38.9 27.9 27.2 - 28.6
Source: HealthWIZ National Social Health Database
Suicide rates for New South Wales male farmers/managers in the age group 15-64 were significantly higher than the national male population of working age.
The Health Reference group of Farmsafe Australia has been examining the issue of Mental Health and Suicide in the farming population. An issues paper prepared for the Reference Group has examined mental health and suicide in the social and economic contexts within which agricultural production and farm life occurs22.
That paper has reported preliminary data relating to occupation and method specific to the farming population. obtained from the Victorian State Coroner for the period January 1994 – July 1997. Table 4.17 indicates the occupation of the person who died of suicide, and the
© Rural Industries Research and Development Corporation and 32
Table 4.17: Suicides on Victorian farms by occupation and method, Jan 1994-Jul 1997
Occupation Method 1994 1995 1996 1997 Farmer Gunshot 2 5 6 2 Hanging 1 1 1 CO poisoning 1 Asphyxiation 1 1 Unknown 1 1
Farm hand/labourer Gunshot 1 1
Hanging 1
Farm resident* Gunshot 1 1
Hanging 1 1
Fire 1
Total 7 10 10 4
(Source: Victorian State Coroner)
*Those who temporally reside or live on a farm, but do not work as a farmer or farm hand. Some case have been excluded, due to insufficient information on the cause of death.
Further research into the major problem of farm suicide is being undertaken in association with the Health Reference Group and a Working Group of specialists in the field.
In summary:
Suicide deaths are a major problem for the farming population of Australia. Further examination of the available information about the circumstances of suicide death and the identification of preventable factors is a priority activity.
4.2 Workers compensation and farm injury
Workers compensation information is valuable in describing outcomes in terms of work days lost and compensation costs associated with work-related injury and illness occurring in specified industries. In addition to demographic information about the injured person, some information is also reported relating to the agent of injury.
However, for agricultural industries in Australia, where most farms are family enterprises and farmers are not within the state workers’ compensation schemes. Between 15 and 19 percent of farm injuries that require medical attention or result in at least one working day lost are the subject of a workers compensation claim23,24. Extrapolation of such data to estimate risk and cost for the whole agricultural workforce should take into account the inherent biases in the source of agricultural industries workers compensation data.
The National Occupational Health and Safety Commission has published workers compensation statistics for all industries for the year 1996-9725.
In the year 1996-97, fatalities in Agriculture, Forestry and Fishing made up 9.7 percent of all compensated fatalities in the workers’ compensation system.
For the same year there were 4,977 new workers’ compensation cases for Agriculture, Forestry and Fishing for Australia, excluding Victoria and the Australian Capital Territory. Workers’ compensation claims cover period of working days lost of more than five days, except in Victoria, where claims are made for more than ten working days lost.
Table 4.18 indicates the incidence rate of new cases in Agriculture, Forestry and Fishing compared to other industries.
Table 4.19 indicates the incidence of new injury/poisoning cases reported of eleven or more days duration of work days lost for Agriculture, Forestry and Fishing by state.
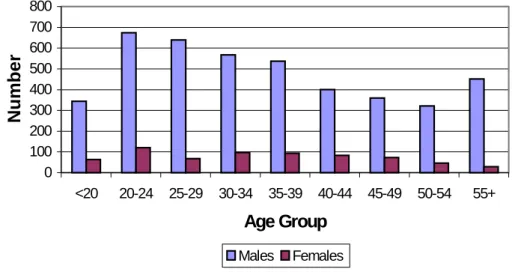
The age/sex profile of reported new workers compensation cases in Agriculture, Forestry and Fishing is indicated in Figure 4.4.
© Rural Industries Research and Development Corporation and 34
Table 4.18: Incidence rates of new cases per 1,000 wage and salary earners by industry 1996-97 (Excluding Victoria and the ACT)
Industry Incidence rate per 1,000 wage
and salary earners
Agriculture, Forestry and Fishing 37.25
Mining 42.66
Manufacturing 39.81
Electricity, gas and water supply 25.92
Construction 37.42
Wholesale trade 18.40
Retail trade 14.18
Accommodation, cafes and restaurants 20.48
Transport and storage 37.58
Communication services 22.45
Finance and insurance 4.38
Property and business services 12.86 Government administration and Defence 23.18
Education 8.69
Health and community services 22.09 Cultural and recreational services 18.75 Personal and other services 23.61
Total 22.86
Source: National Occupational Health and Safety Commission 1998. Compendium of workers’ compensation statistics, Australia 1996-97
Table 4.19: Incidence of new injury/poisoning cases reported of 11 or more days duration of work days lost for Agriculture, Forestry and Fishing by state (per 1,000 salary and wage earners)
State Incidence rate per 1,000 salary and wage earners
Queensland 14.86
New South Wales 35.16
Victoria 14.41
Tasmania 17.39
South Australia 18.51
Western Australia 20.59
Northern Territory 45.24
Figure 4.4: Age/sex profile of reported new workers compensation cases in Agriculture, Forestry and Fishing 1996-97 (Excluding Vic and ACT)
0 100 200 300 400 500 600 700 800 <20 20-24 25-29 30-34 35-39 40-44 45-49 50-54 55+ Age Group Number Males Females
Source: National Occupational Health and Safety Commission 1998. Compendium of workers’ compensation statistics, Australia 1996-97
In 1995 the National Occupational Health and Safety Commission published Australia-wide workers compensation data specifically relating to Agriculture and Services to Agriculture industries for the year 1992-9326. There were 5,885 compensated injury/disease occurrences reported for 1992-1993. This represented 1 in every 20 salary and wage earners in the industry for that year.
Figure 4.5 indicates the proportion of injury/disease occurrences by broad industry group.
Other agriculture includes sugar cane, cotton, and nurseries.
Figure 4.5: Proportion of injury/disease occurrences by industry group 1992-1993
Poultry 4% Fruit 13% Vegetables 4% Cereal, grains,sheep,cattl e,pigs 46% Other agriculture 22% Services to agriculture 11%
© Rural Industries Research and Development Corporation and 36 Figure 4.6 shows the incidence rates for selected occupations for Agriculture and Services to Agriculture. Sheep shearing had a very high rate of workers compensation claims.
Figure 4.6: Injury/disease incidence rates for selected occupations per 1,000 wage and salary earners 1992-1993
Figure 4.7 shows the agency of injury resulting in workers’ compensation claims in Agriculture and Services to Agriculture for 1992-93.
Figure 4.7: Agency of injury, Agriculture and Services to Agriculture: 1992-1993
Back injuries made up 17.8 percent of Agriculture and Services to Agriculture injuries, hand and fingers 17.5 percent and lower limb 17.1 percent.
The average duration of absence from work for Agriculture and Services to Agriculture for 1992-93 is displayed in Figure 4.8 and the average cost per occurrence in Figure 4.9. In total approximately 308,000 working days were lost in the agriculture sector during that year as recorded in the workers’ compensation claims.
Figure 4.8: Average working days lost per occurrence, Agriculture and Services to Agriculture, 1992-93 50.5 44.6 79.2 59 45.9 54.3 45.6 51.8 48.5 0 20 40 60 80 100 Poultry Fruit Vegetables cereals,Sheep,Cattle,Pigs culture Agriculture Services to agriculture All agriculture All Australian industries
Working days lost per occurrence
Source: Cole and Foley, 1995
Figure 4.9: Average cost per occurrence, Agriculture and services to Agriculture 1992-93. 6.074 4.972 10.501 7.226 6.04 6.705 9.625 6.92 5.635 0 2 4 6 8 10 12 Poultry Fruit Vegetables Cereals,Sheep,Cattle,Pigs Other Agriculture Agriculture Services to agriculture All agriculture All Australian industries
$'000 per claim lodged
Source: Cole and Foley, 1995
The average cost per claim for the Agriculture sector ($6,920) was 23 percent higher than the All Industries average cost per claim ($5,635).
© Rural Industries Research and Development Corporation and 38
In summary:
There are close to 6,000 workers compensation claims each year for on-farm injury/illness. Claims rates for Agriculture and Services to Agriculture are amongst the highest of any industry. The sheep shearing industries are associated with very high rates of claims and costs.
4.3 Injuries on farms resulting in hospital admission
Serious acute injury generally results in admission to hospital, and thus hospital statistics are a potentially important source of information to define the nature and scale of the injury problem for Australian agriculture.
However, there are major limitations in the use of hospital admissions and separations data that relate to:
1. The purpose for generating data about persons admitted to hospital has primarily been for the purposes of recording details of care provided outcome of treatments and the cost of that care.
2. While there is a separate coding framework established for describing injury - called the E-Code, the coding framework is limited in its capacity to identify and describe injury occurring on farms, from a prevention perspective. eg the coding system does not discriminate between animal injury causes by sheep and cattle.
3. There have been identified significant coding irregularities relating to interpretation by coding staff of the E-Code eg road traffic injury has been frequently incorrectly coded as vehicle injury occurring on farms.
These issues are subjects of a current study27.
Hospital data describing on-farm injury admissions and separations has been examined in three states. Tables 4.20 to 4.22 display the number of people leaving (‘separating’ from) hospitals with a diagnosis of injury sustained on farms in New South Wales, Victoria and South Australia.
It should be noted that the tables display a selection of on-farm injury. A number of other injuries, including falls, are not included in light of identified coding irregularities.
Table 4.20: New South Wales Hospitals – hospital separations, selected on-farm injury – all ages
NSW Separations all ages E-Code Description
89/90 90/91 91/92 92/93 93/94 94/95 95/96
E820-E829 Motor vehicle non traffic accidents & Other road vehicle accidents
Motor cycle Other vehicle Animal ridden 205 100 224 206 115 249 236 122 277 266 116 269 236 94 240 254 144 231 270 111 196
E862 Poisoning by petroleum products * * 5 * * *
E863 Poisoning by agricultural chemicals 13 10 17 18 22 20 11
E864 Poisoning by corrosives & caustics * * * *
E866 Poisoning by gases and vapours * * * * 5 *
E890-899 Fire and flames 19 26 29 22 18 21 15
E905 Venomous animals and plants 17 32 75 43 41 46 50
E906.0 Dog bite * 5 10 7 6 * *
E906.8 Injury by other animal 147 130 150 140 137 133 122
E919.0 Agricultural machinery 123 120 121 114 129 96 134
E919.1-9 Other machinery 58 27 43 48 25 43 32
E920 Cutting and piercing 104 96 144 119 102 88 106
E922 Firearms 10 13 18 18 15 11 10
TOTAL SUBSET 1025 1030 1251 1186 1069 1096 1062
© Rural Industries Research and Development Corporation and 40
Figure 4.10: NSW hospital separations, selected on-farm injury – all ages
0 200 400 600 800 1000 1200 1400 89/90 90/91 91/92 92/93 93/94 94/95 95/96
Table 4.21: Victoria hospital separations, selected on-farm injury – all ages Separations – all ages
E-code Description
93/94 94/95 95/96 96/97 97/98
E820-E829 Motor vehicle non traffic accidents & Other road vehicle accidents
Motor cycle Other vehicle Animal ridden 84 79 47 79 64 40 76 59 20 65 62 18 81 59 14
E862 Poisoning by petroleum products 0 0 0 0 0
E863 Poisoning by agricultural chemicals 5 2 5 5 3
E864 Poisoning by corrosives & caustics * * * 0 0
E866 Poisoning by gases and vapours 0 0 0 0 *
E890-899 Fire and flames 12 3 3 3 9
E905 Venomous animals and plants 14 10 16 9 16
E906.0 Dog bite 3 * * * 3
E906.8 Injury by other animal 73 48 39 53 51
E919.0 Agricultural machinery 62 60 50 47 53
E919.1-9 Other machinery 10 6 12 7 11
E920 Cutting and piercing 45 32 44 28 29
E922 Firearms 5 3 * * *
TOTAL SUBSET 440 351 328 301 332
Source: VIMD – Victorian Injury Surveillance System
Figure 4.11: Annual separations Victoria hospitals, selected on-farm injury
0 100 200 300 400 500 93/94 94/95 95/96 96/97 97/97
Table 4.22: South Australia hospital on-farm injury separations 1996 – all ages Separations – all ages
E-code Description
Male Female Total
E820-E829
Motor vehicle non traffic accidents & Other road vehicle accidents
Motor cycle Other vehicle Animal ridden 53 45 16 3 8 15 56 53 31
E862 Poisoning by petroleum products 4 2 6
E863 Poisoning by agricultural chemicals 7 2 9
E864 Poisoning by corrosives & caustics 3 * 4
E866 Poisoning by gases and vapours * * 4
E890-899 Fire and flames * * 3
E905 Venomous animals and plants 31 10 41
E906.0 Dog bite 9 4 13
E906.8 Injury by other animal 28 17 45
E919.0 Agricultural machinery 45 * 46
E919.1-9 Other machinery 15 4 19
E920 Cutting and piercing 90 25 115
E922 Firearms * 0 *
TOTAL SUBSET 352 95 447
Source: SA Health Commission
Similar hospitals-based data is being collated for Queensland and Western Australia.
Hospital admissions/separations due to falls injury on farms
Irregularities with coding on-farm injuries by health services has led the National Farm Injury Data Centre to use the above selection of injuries for monitoring on-farm injury admissions to hospitals. The one other large number of injury separations reported as occurring on farms is
falls. In 1991/92 there were 448 on-farm falls separations reported in NSW. In 1996/97 there were 77 falls admissions reported for people aged less than 80 years.
Further examination of falls admissions is required.
General
One early study has reported more detail derived from retrospective analysis of information held within hospital records of on-farm injury, and a summary of results are displayed in Figure 4.1228.
This information is presented to display the further detail that is included within medical records of farm injury, that could be available for future study.