RESEARCH ARTICLE
Computational methods using
weighed-extreme learning machine to predict
protein self-interactions with protein
evolutionary information
Ji‑Yong An, Lei Zhang
*, Yong Zhou, Yu‑Jun Zhao and Da‑Fu Wang
Abstract
Self‑interactions Proteins (SIPs) is important for their biological activity owing to the inherent interaction amongst their secondary structures or domains. However, due to the limitations of experimental Self‑interactions detection, one major challenge in the study of prediction SIPs is how to exploit computational approaches for SIPs detection based on evolutionary information contained protein sequence. In the work, we presented a novel computational approach named WELM–LAG, which combined the Weighed‑Extreme Learning Machine (WELM) classifier with Local Average Group (LAG) to predict SIPs based on protein sequence. The major improvement of our method lies in presenting an effective feature extraction method used to represent candidate Self‑interactions proteins by exploring the evolutionary information embedded in PSI‑BLAST‑constructed position specific scoring matrix (PSSM); and then employing a reliable and robust WELM classifier to carry out classification. In addition, the Principal Component Analy‑ sis (PCA) approach is used to reduce the impact of noise. The WELM–LAG method gave very high average accuracies of 92.94 and 96.74% on yeast and human datasets, respectively. Meanwhile, we compared it with the state‑of‑the‑art support vector machine (SVM) classifier and other existing methods on human and yeast datasets, respectively. Com‑ parative results indicated that our approach is very promising and may provide a cost‑effective alternative for predict‑ ing SIPs. In addition, we developed a freely available web server called WELM‑LAG‑SIPs to predict SIPs. The web server is available at http://219.219.62.123:8888/WELMLAG/.
Keywords: SIPs, Weighed‑extreme learning machine, Local average group, PCA
© The Author(s) 2017. This article is distributed under the terms of the Creative Commons Attribution 4.0 International License (http://creativecommons.org/licenses/by/4.0/), which permits unrestricted use, distribution, and reproduction in any medium, provided you give appropriate credit to the original author(s) and the source, provide a link to the Creative Commons license, and indicate if changes were made. The Creative Commons Public Domain Dedication waiver (http://creativecommons.org/ publicdomain/zero/1.0/) applies to the data made available in this article, unless otherwise stated.
Background
All the time, protein–protein interactions (PPIs) play an important role in biological activity. However, a crucial problem regarding Self-interactions Proteins (SIPs) is whether proteins can interact with their partners. SIPs is a special type of PPIs and are those in which more than two copies of the protein can mutual effect. Two SIP partners are the same copies of the protein and can be represented by the same gene. This can lead to the for-mation of homo-oligomer. In recent years, many studies have found that SIPs play a key role in the evolution of
protein interaction networks (PINs) and cellular func-tions [1]. Therefore, it is much crucial that whether a protein can self-interact for the elucidation of its func-tions. Knowledge of SIPs can also provide a better under-standing of the regulation of protein function and disease mechanisms. Many researches have demonstrated that homo-oligomerization is an essential function for bio-logical activity and play an important role in a wide range of biological processes, for example, signal trans-duction, gene expression regulation, enzyme activation and immune response [2–6]. However, owing to SIPs is a special type of protein–protein interactions, PPIs is still much important in a wide range of biological pro-cesses. Previous researchers have discovered that SIPs can variously extend the function diversity of proteins
Open Access
*Correspondence: [email protected]
without increasing the size of genome. In addition, it is much useful for SIPs that can also strengthen the stability and prevent the denaturation of a given protein through decreasing its surface area [7]. As a result, developing a robust and effective computational approach based on protein sequence to detect SIPs has become more and more important.
Many previous studies have focused on predicting PPIs by developing computational methods. For example, Li et al. [8] proposed a novel computational approach for detecting PPIs, which uses discriminative vector machine (DVM) classifier to combine with physicochemical and evolutionary-based feature extraction methods. Jia et al. [9] developed an feature extraction method based on the physicochemical descriptors and employed the Ran-dom Forests classifier to carry out classification, which yielded good experimental results. Yang et al. [10] pre-sented a new method based on protein sequence, which used local protein sequence descriptors as a novel rep-resentation and employed the k-nearest neighbors clas-sifier to execute classification. Guo et al. [11] employed the SVM classifier to combine with autocorrelation fea-ture extraction approach to identify PPIs. Ming et al. [12] used a sequence-based correlation coefficient (CC) transformation and also adopted the SVM classifier to predict PPIs. These methods usually focused on explor-ing the correlational information contained protein pairs, such as, coevolution, co-localization and co-expression. Nevertheless, this information is not enough for predict-ing SIPs. Furthermore, the datasets of prediction PPIs do not contain the PPIs between the same partners. For these reasons, these computational methods are not used to identify SIPs. In the previous study, Liu et al. [1] proposed a method for constructing a prediction model known as SLIPPER to predict SIPs, which can integrate multiple representative known properties. To the best of our knowledge, some studies about PPI have been reported very recently that may be also relevant to SIPs [13–15]. However the method has an obviously drawback since it cannot deal with the proteins not covering the current human interatomic. Because of the limitations of the aforementioned approaches, one major challenge in the study of prediction SIPs is how to exploit automated methods for SIPs detection.
In the work, we developed a novel computational approach termed WELM–LAG to predict SIPs by only using protein sequence information. The WELM–LAG method used a newly feature extraction method called Local Average Group that can capture evolutionary infor-mation from PSSM and employed an effective and robust classifier called the Weighed-Extreme Learning Machine to execute classification. The major improvement of our
approach lies in adopting an effective feature extraction approach to represent candidate self-interacting proteins by exploring the evolutionary information embedded in PSI-BLAST-constructed position specific scoring matrix (PSSM); and then it also employs a reliable and robust WELM classifier to carry out classification. The proposed method was carried out on human and yeast datasets, respectively, which achieved very excellent prediction accuracies of 96.74 and 92.94%. At the same time, we also compared our method with the SVM classifier and other existing approaches on human and yeast datasets. The experimental results proved that our WELM–LAG model can extract the hidden key information beyond the sequence itself and obtain much better prediction results than previous method. It is proved that the WELM–LAG method is fit for SIPs detection and can execute incred-ibly well for identifying SIPs.
Methods Dataset
Feature extraction method
In the work, we used Position Specific Scoring Matrix (PSSM) to predict SIPs. In the experiment, each pro-tein sequence was converted into a PSSM through employing Position Specific Iterated BLAST (PSI-BLAST) [23]. Each PSSM can be defined a L×20 matrix
P=
Piji:1=1. . .L, j=1. . .20
, where P represents the length of a given sequence, 20 are the number of 20 amino acids, and Pij represents the score of the jth amino acid in the ith position for a given protein sequence, where Pij can be expressed as Pij=20k=1m(i,k)×n
j,k , where m(i,k) represents the appearing frequency of the kth amino acid at position i of the probe, and n
j,k
is the score of Dayhoff’s mutation matrix between jth and kth amino acids. Thus, a high score cab be obtained for a
good conserved position, while a weakly conserved posi-tion only gets a low score.
In the study, in order to obtain highly and widely homologous protein sequences, PSI_BLAST’s e-value parameter was set to 0.001. Meanwhile, three iterations were selected. However, one major challenge in the machine learning-based methods is how to extract useful informative features. In the work, since each PSSM has different length of amino acids. As a result, each PSSM cannot be directly converted into a feature vector, which will result in different length of feature vectors. For solv-ing this question, Local Average Group (LAG) approach is employed to create feature vectors. The Local Average Group is described as follows: a Group consists of 5% of the length of a given sequence. As a result, regardless of protein sequence’s length, we divided each PSSM of a given sequence into 20 Groups. Thus, each Group con-tains 20 features derived from the 20 columns of PSSMs. Related mathematical formula represented as follows:
where P represents the length of a given protein sequence, P/20 is 5% of the length of a given sequence, which represents the length of the jth group. The Mat
k+(i−1)×20P,j
represents a 1 × 20 vector captured from PSSM matrix at the ith position in the jth group. Thus, each PSSM was divided into 20 groups and expressed as a 400-dimensional feature vector. The theoretical basis of LAG is that the residue conserva-tion tendencies are similar and the locaconserva-tions of domains are closely related to the length of protein sequence in the same family [24]. In our application, each protein sequence was transformed into a 400 dimensional feature vector through employing LAG method.
(1) LAG(F)= 20
P P 20
k=1 Mat
k+(i−1)× P 20,j
i=1,. . ., 20; j=1,. . ., 20; P=j+20×(i−1),
In the study, in order to improve prediction accuracy, the dimensionality of feature vectors was reduced from 400 to 300 through employing the PCA method. This can reduce the influence of noise. In addition, for assessing the efficient of the proposed feature extraction method, we compared it with other four methods by using the SVM classifier on yeast datasets of PPIs (the yeast data-set contains 11,188 protein pairs): Global encoding (GE) [25], auto covariance (AC) [26], auto cross covariance (ACC) [26] and local protein sequence descriptors (LD) [27]. It can be seen from Table 1, the proposed feature extraction method yielded obviously better prediction accuracy compared to other existing methods by using the same classifier.
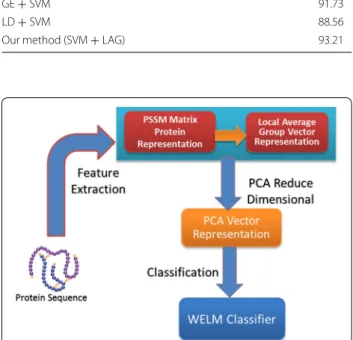
In the paper, the feature extraction method based on Local Average Group combining with PCA employed to capture key feature information and the robust WELM classifier is used to execute classification. The flow of the proposed WELM–LAG method for predicting SIPs is displayed in Fig. 1.
Weighed‑extreme learning machine
The unweight Extreme learning machine can randomly generate the hidden node, which is a main characteristic
Table 1 Comparison of predicting accuracy between our feature extraction method and other methods on yeast dataset
Prediction model Ac (%)
AC + SVM 87.36
ACC + SVM 89.33
GE + SVM 91.73
LD + SVM 88.56
Our method (SVM + LAG) 93.21
that distinguishes from tradition neural network learning algorithms [28]. That is to say, it can randomly assign the parameters contained the hidden nodes for independent of the training samples. We expressed the hidden layer output as a row vector F(X)=[f1(m) . . .fL(m)], where m is the input sample, L represents the number of hidden nodes [28]. Assume that there are training sample sets {mi,pi}, the model of single-hidden layer feed forward networks (SLFN) [29] can be defined as follow:
where F represents the hidden layer output matrix, β is the output weight and P represents the target vector.
The minimal norm along with the least square solution can be analytically determined by employing Moore– Penrose ‘‘generalized’’ inverse Fˆ
As is displayed in two formulas above that a positive value I
C is added to the diagonal of FFP or FPF in order for better generalization performance. Users can select one of the two formulas above according to the number of training sets.
For the Weighted Extreme learning machine, for maximizing the marginal distance and minimizing the weighted cumulative error with regards to each sample, the optimization problem can be defined as follows [28]:
where
where f(mi) represents the feature mapping vector con-tained hidden layer with respect to mi, and β is the output weight vector connecting the hidden layer and the output layer. For a binary classifier, there is only one node in the (2)
Fβ=P
(3) F =
f1(m1)
. . .
fL(mn) (4) whenn<L:β= ˆF÷P =FT
I C +FF
T −1
P
(5) whenL<n:β = ˆF÷P=
I C +F
PF
−1
FPP
(6)
Minimizing:||Fβ−P||2||β||, whereP=[p1,. . .pn]
LPELM =
1 2||β||
2+CW1 2
n
i=1
||∂i||2,
subject to:f(mi) β=ppi −∂ p
i, i=1. . .n
output layer. Here ∂i represents the training error of
sam-ple mi. It is caused by the difference of the desired output
Pi and the actual output f(mi)β [28].
According to KKT theorem, the equivalent dual opti-mization problem with respect to (9) is
where ai is the constant factor of sample mi in the
lin-ear combination to form the final decision function, In addition, by making the partial derivatives, the Karush– Kuhn–Tucker (KKT) [30] optimality conditions are obtained [28]
Two versions of solutions of β can be derived from (10) regarding left pseudo-inverse or right pseudo-inverse. When the presented data has a small size, right pseudo-inverse is recommended because it involves the pseudo-inverse of an N × N matrix. Otherwise, left pseudo-inverse is more suitable since it is much easier to compute the matrix inversion of size L × L when L is much smaller than N:
Inspired from work of [31] and the definition of a ker-nel [31], the output function in terms of kernel is natu-rally derived from the N × N version:
(7)
LDELM =1
2||β|| 2
+CW1
2
n
i=1
∂i2− n
i=1
ai(f(mi)β−pi+∂i)
(8) ∅LDELM
∅β =0→β=
n
i=1
aif(xi)P=FPε
(9)
∅LDELM
∅∂i =0→ai =CW∂i, i=1. . .n
(10)
∅LDELM
∅ai =0→f(mi)β−pi+∂i=CW∂i=0, i=1. . .n
(11)
Whennis small:C=FP
I
C +WFF P
−1
WP
(12)
WhenN is large:β=
I
C +F
PWF
−1
FPWP
(13) k(x)kernel=f(x)FP
�
I
C +WFF
P
�−1
FPWP
= sign
K(m,m1) . . . K(m,mn)
P � I
C +WωELM
�−1
Performance evaluation
In the study, we employed the following measures to evaluate the prediction performance of the Weighed-Extreme Learning Machine. The definition is shown as follows:
Ac, Sn, Sp, Pe and MCC represent Accuracy, Sensi-tivity, specificity, Precision and Matthews’s Correlation Coefficient, respectively. In the above formula, TP repre-sents the number of true positives, FP is the count of false positives, TN represents the number of true negatives and FN represents the count of false negatives. In addi-tion, for assessing the performance of the proposed clas-sifier, we also constructed the Receiver Operating Curve (ROC) in the experiment.
Results and discussion
Performance of the proposed method
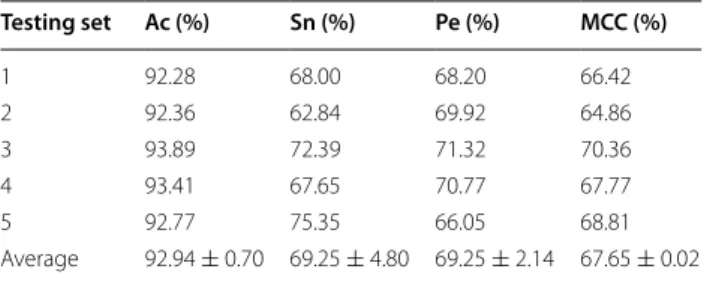
Using the proposed approach we performed the experi-ment yeast and human dataset, respectively. In order to prevent the over-fitting to affect the experimental results of the proposed approach, the experimental datasets were divided into the training datasets and independent test datasets, respectively. More specifically, 1/6 of the human datasets was selected as independent test datasets and the remaining human datasets selected as training datasets. The same strategy was also applied for the yeast dataset. In addition, for a fair comparison, we used five-fold cross-validation tests to assess the prediction per-formance of the proposed method in the experiment. At the same time, for ensuring fairness, several parameters of the WELM classifier were optimized in the experiment by using the grid search method. Here, we selected the ‘tribas’ function as the kernel function and set up Num-ber of Hidden Neurons = 5000 and C = 100. The pre-diction results of the proposed approach on yeast and human dataset are displayed in Tables 2 and 3.
As observed from Table 2 that the proposed approach achieved good prediction results on yeast dataset, whose
Ac= TP+TN
TP+FP+TN+FN
Sn= TP
TP+TN
Sp= TN
FP+TN
Pe= TP
FP+TP
MCC=√ (TP×TN)−(FP×FN)
(TP+FN)×(TN+FP)×(TP+FP)×(TN+FN)
average accuracies of five experiments are above 92% and average Sensitivity, Precision, and MCC of 69.25, 69.25, and 67.65% respectively. Similarly, an interesting phenomenon from Table 3 is that the average Accuracy obtained is above of 96% on human dataset and aver-age Sensitivity, Precision, and MCC of 83.70, 83.00, and 80.74% were also obtained respectively.
As displayed from Tables 2 and 3 that the proposed approach produced very good experimental results for predicting SIPs, owing to the correct choice of classifi-ers and feature extraction methods. A major advantage of using PSSM is to combine LAG and PCA as feature extraction methods and to employ the robust WELM classifier. This may be attributed to the following three reasons: (1) it is an obvious advantage that PSSM not only expresses the order information but also retains enough prior information. This make PSSM play a key role for improving the predicting accuracy. (2) For the sake of Local Average Group (LAG) can extract the local texture feature, the candidate self-interacting proteins can be represented by exploring the evolutionary infor-mation embedded in PSI-BLAST-constructed PSSM. This makes it possible to discover patterns of the entire sequences. In addition, for reducing the influence of noise and guaranteeing the integrity of feature vector information, the dimension of each LAG feature vec-tor was reduced from 400 to 300 through employing PCA method. (3) The robust WELM classifier is used Table 2 Five-fold cross-validation results shown using our proposed method on yeast
Testing set Ac (%) Sn (%) Pe (%) MCC (%)
1 92.28 68.00 68.20 66.42
2 92.36 62.84 69.92 64.86
3 93.89 72.39 71.32 70.36
4 93.41 67.65 70.77 67.77
5 92.77 75.35 66.05 68.81
Average 92.94 ± 0.70 69.25 ± 4.80 69.25 ± 2.14 67.65 ± 0.02
Table 3 Five-fold cross-validation results shown using our proposed method on human
Testing set Ac (%) Sn (%) Pe (%) MCC (%)
1 96.83 84.03 79.08 80.42
2 96.91 81.94 81.13 80.43
3 96.72 84.95 78.64 80.58
4 96.75 84.28 79.25 80.68
5 96.58 83.28 81.91 81.60
to calculate the classification rates. As a result, the sam-ple information extracted by using the proposed feature extraction method is very suitable for identifying SIPs and the WELM classifier plays an important role for improving prediction accuracy.
Comparison with the SVM‑based method
It is noted that good experimental results have been obtained through using the proposed approach. How-ever, to better assess the prediction performance of the WELM classifier, we compared the prediction perfor-mance of the WELM classifier with the SVM classifier by using the LAG feature extraction approach on yeast and human datasets. In the experiment, the LIBSVM tool [32] was employed to carry out classification. The RBF kernel parameters of the SVM were optimized by using the grid search method, where c is 0.001 and g is 0.3 and other parameters takes the default value.
The prediction results for WELM and SVM classifiers were presented in Tables 4 and 5 on yeast and human datasets, respectively. Meanwhile, the comparison of ROC Curves between WELM and SVM were shown in Figs. 2 and 3 on yeast and human datasets, respectively. It can be seen from Table 4 that the SVM classifier gave 89.73% average Accuracy on yeast datasets. However, the WELM classifier achieved 92.94% average Accuracy.
Similarly, as displayed in Table 5, 96.74% average Accu-racy is obtained by the proposed WELM classifier and 93.36% average Accuracy is achieved by the SVM classi-fier on human dataset. These prediction results further demonstrated that the prediction performance of WELM classifier is significantly better than the SVM classifier. At the same time, it can be found from Figs. 2 and 3, the ROC curves of WELM classifier are also significantly bet-ter than the SVM classifier. This may be attributed to the reason: The WELM classifier pays attention to the sam-ples which imply the imbalanced class distribution rela-tive to unweight ELM. In the process of WELM classifier classification, the minority class samples are assigned with larger weight, which make the information of imbal-anced class distribution is well perceived [28]. After weighting scheme is applied, WELM classifier can push the separating boundary from the minority class towards the majority class [28] As a result, the WELM classifier can be generalized to cost sensitive learning by assigning different weight [28]. In the study, the proposed predic-tion model obtained good predicpredic-tion results. This further demonstrated that the WELM classifier is robust and Table 4 Five-fold cross-validation results shown by using
our proposed method on yeast
Testing set Ac (%) Sn (%) Pe (%) MCC (%)
SVM + PSSM + LAG
1 89.15 21.33 65.31 37.20
2 89.63 20.27 73.17 37.84
3 90.51 13.43 81.10 33.44
4 90.11 15.44 72.41 32.96
5 89.28 28.87 64.06 42.83
Average 89.73 ± 0.57 19.87 ± 6.01 71.19 ± 6.85 36.85 ± 0.04
Table 5 Five-fold cross-validation results shown by using our proposed method on human
Testing set Ac (%) Sn (%) Pe (%) MCC (%)
SVM + PSSM + LAG
1 93.32 23.26 85.90 43.64
2 93.06 22.07 89.19 43.15
3 93.47 24.57 88.75 45.50
4 93.70 26.14 74.19 43.49
5 93.25 23.59 93.42 45.52
Average 93.36 ± 0.24 23.92 ± 1.53 93.54 ± 4.25 44.26 ± 0.012
Fig. 2 Comparison of ROC curves performed between WELM and SVM on yeast dataset
effective in imbalanced data environment. Thus, all of these proved that the proposed prediction method might become useful tools for predicting SIPs, as well as other bioinformatics tasks.
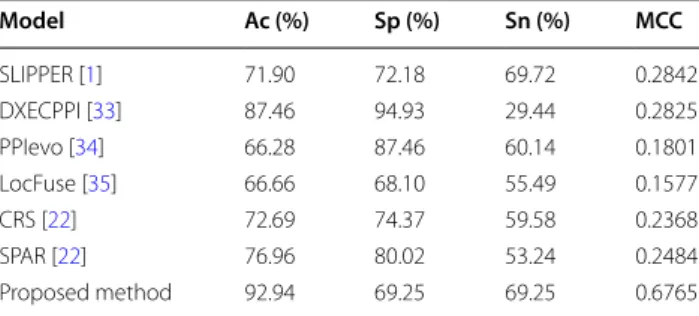
Comparison with other methods
In the study, in order to further verify the prediction per-formance of the proposed approach, the comparison of prediction performance between the proposed predic-tion method called WELM–LAG and three existing SIP predictor SLIPPER [1], CRS [22], SPAR [22] and three PPI predictors DXECPPI [33], PPIevo [34] and LocFuse [35] based on the human and yeast datasets are given. These comparison results were shown in Tables 6 and 7
on yeast and human datasets. It can be observed from Table 6 that the average prediction accuracy obtained by the proposed approach is obviously better than other six methods on yeast dataset. Similarity, we can find from Table 7 that the prediction accuracy of our approach is also significantly higher than six different methods on human dataset. These comparison results further proved that the proposed prediction method called as WELM– LAG is robust and efficient relative to current existing approaches. Owing to the use of a robust classifier and an effectively feature extraction method, our prediction approach obtained good prediction results. This makes
the proposed method become a useful tool for predicting SIPs.
Conclusion
In the work, we developed a novel computational approach termed WELM–LAG to predict SIPs by only using protein sequence information. The WELM–LAG method used a newly feature extraction method called Local Average Group (LAG) that can capture evolution-ary information from PSSM and employed an effec-tive and robust classifier called the Weighed-Extreme Learning Machine (WELM) to execute classification. The major improvement of our approach lies in adopt-ing an effective feature extraction approach to repre-sent candidate self-interactions proteins by exploring the evolutionary information embedded in PSI-BLAST-constructed position specific scoring matrix (PSSM); and then it also employs a reliable and robust WELM classi-fier to carry out classification. The proposed method was carried out on human and yeast datasets, respectively, which achieved very excellent prediction accuracies of 96.74 and 92.94%. At the same time, we also compared our method with the SVM classifier and other existing approaches on human and yeast datasets. The experi-mental results proved that our WELM–LAG model can extract the hidden key information beyond the sequence itself and obtain much better prediction results than pre-vious method. It is proved that the WELM–LAG method is fit for SIPs detection and can execute incredibly well for identifying Sips. In addition, the link address (https:// github.com/ajysjm/WELM_SIP_Prediction) provided the datasets and source code that can be downloaded by users. We also developed a freely available web server called WELM-LAG-SIPs to predict SIPs. The web server is available at http://219.219.62.123:8888/WELMLAG/. Authors’ contributions
JYA and LZ conceived the algorithm, carried out analyses, prepared the data sets, carried out experiments, and wrote the manuscript; YZ, YJZ and DFW designed, performed and analyzed experiments and wrote the manuscript; All authors read and approved the final manuscript.
Acknowledgements
This work is supported by ‘the Fundamental Research Funds for the Central Universities (2017XKQY078)’. The authors would like to thank all the guest edi‑ tors and anonymous reviewers for their constructive advices.
Competing interests
The authors declare that they have no competing interests.
Publisher’s Note
Springer Nature remains neutral with regard to jurisdictional claims in pub‑ lished maps and institutional affiliations.
Received: 1 June 2017 Accepted: 5 August 2017 Table 6 Comparison of predicting performance
between our method and other methods on yeast dataset Model Ac (%) Sp (%) Sn (%) MCC
SLIPPER [1] 71.90 72.18 69.72 0.2842
DXECPPI [33] 87.46 94.93 29.44 0.2825
PPIevo [34] 66.28 87.46 60.14 0.1801
LocFuse [35] 66.66 68.10 55.49 0.1577
CRS [22] 72.69 74.37 59.58 0.2368
SPAR [22] 76.96 80.02 53.24 0.2484
Proposed method 92.94 69.25 69.25 0.6765
Table 7 Comparison of predicting performance between our method and other methods on human data-set
Model Ac (%) Sp (%) Sn (%) MCC
SLIPPER [1] 91.10 95.06 47.26 0.4197
DXECPPI [33] 30.90 25.83 87.08 0.0825
PPIevo [34] 78.04 25.82 87.83 0.2082
LocFuse [35] 80.66 80.50 50.83 0.2026
CRS [22] 91.54 96.72 34.17 0.3633
SPAR [22] 92.09 97.40 33.33 0.3836
References
1. Liu Z et al (2013) Proteome‑wide prediction of self‑interacting proteins based on multiple properties. Mol Cell Proteom Mcp 12(6):1689 2. Baisamy L, Jurisch N, Diviani D (2005) Leucine zipper‑mediated homo‑
oligomerization regulates the Rho‑GEF activity of AKAP‑Lbc. J Biol Chem 280(15):15405–15412
3. Hattori T et al (2003) C/EBP family transcription factors are degraded by the proteasome but stabilized by forming dimer. Oncogene 22(9):1273–1280
4. Katsamba P et al (2009) Linking molecular affinity and cellular specificity in cadherin‑mediated adhesion. Proc Natl Acad Sci USA 106(28):11594–11599
5. Koike R, Kidera A, Ota M (2009) Alteration of oligomeric state and domain architecture is essential for functional transformation between transferase and hydrolase with the same scaffold. Prot Sci Publ Prot Soc 18(10):2060
6. Woodcock JM et al (2003) The dimeric versus monomeric status of 14‑3‑ 3zeta is controlled by phosphorylation of Ser58 at the dimer interface. J Biol Chem 278(38):36323
7. Marianayagam NJ, Sunde M, Matthews JM (2004) The power of two: protein dimerization in biology. Trends Biochem Sci 29(11):618–625 8. Li et al (2016) Highly accurate prediction of protein–protein interactions
via incorporating evolutionary information and physicochemical charac‑ teristics. IJMS 17(9):1396
9. Jia J, Xiao X, Liu B (2015) Prediction of protein–protein interactions with physicochemical descriptors and wavelet transform via random forests. J Lab Autom 21(3):368
10. Yang L, Xia JF, Gui J (2010) Prediction of protein–protein interactions from protein sequence using local descriptors. Prot Pept Lett 17(9):1085 11. Guo Y et al (2008) Using support vector machine combined with
auto covariance to predict protein–protein interactions from protein sequences. Nucleic Acids Res 36(9):3025
12. Shi MG et al (2010) Predicting protein–protein interactions from sequence using correlation coefficient and high‑quality interaction dataset. Amino Acids 38(3):891
13. Jia J et al (2015) iPPI‑Esml: an ensemble classifier for identifying the inter‑ actions of proteins by incorporating their physicochemical properties and wavelet transforms into PseAAC. J Theor Biol 377:47–56 14. Jia J, Liu Z, Xiao X et al (2016) Identification of protein‑protein binding
sites by incorporating the physicochemical properties and stationary wavelet transforms into pseudo amino acid composition. J Biomol Struct Dyn 34(9):1946
15. Jia J et al (2015) iPPBS‑Opt: a sequence‑based ensemble classifier for identifying protein‑protein binding sites by optimizing imbalanced train‑ ing datasets. Molecules 21(1):E95
16. Consortium, U.P. (2014) UniProt: a hub for protein information. Nucleic Acids Res 43(D1):D204–D212
17. Xenarios I et al (2004) DIP: the database of interacting proteins. Nucleic Acids Res 32(1):D449
18. Livstone MS, Breitkreutz BJ, Stark C et al (2011) The BioGRID interaction database. 41(Database issue):D637–D640
19. Orchard S et al (2014) The MIntAct project—IntAct as a common cura‑ tion platform for 11 molecular interaction databases. Nucleic Acids Res 42:358–363
20. Breuer K et al (2013) InnateDB: systems biology of innate immunity and beyond—recent updates and continuing curation. Nucleic Acids Res 41(Database issue):D1228
21. Launay G et al (2014) MatrixDB, the extracellular matrix interaction data‑ base: updated content, a new navigator and expanded functionalities. Nucleic Acids Res 43(Database issue):321–327
22. Liu X et al (2016) SPAR: a random forest‑based predictor for self‑inter‑ acting proteins with fine‑grained domain information. Amino Acids 48(7):1655
23. Gribskov M, Mclachlan AD, Eisenberg D (1987) Profile analysis: detection of distantly related proteins. Proc Natl Acad Sci USA 84(13):4355 24. Jeong JC, Lin X, Chen XW (2011) On position‑specific scoring matrix
for protein function prediction. IEEE/ACM Trans Comput Biol Bioinf 8(2):308–315
25. Huang YA et al (2016) Sequence‑based prediction of protein–protein interactions using weighted sparse representation model combined with global encoding. BMC Bioinform 17(1):1–11
26. Guo Y et al (2008) Using support vector machine combined with auto covariance to predict protein–protein interactions from protein sequences. Nucleic Acids Res 36(9):3025
27. Zhou YZ, Gao Y, Zheng YY (2011) Prediction of protein–protein interac‑ tions using local description of amino acid sequence. Springer, Berlin 28. Zong W, Huang GB, Chen Y (2013) Weighted extreme learning machine
for imbalance learning. Neurocomputing 101(3):229–242
29. Huang GB, Zhu QY, Siew CK (2004) Extreme learning machine: a new learning scheme of feedforward neural networks. In: IEEE international joint conference on neural networks. Proceedings. 2005
30. Fletcher R (1980) Practical methods of optimization. Wiley, New York, pp 71–94
31. Huang GB et al (2012) Extreme learning machine for regression and multiclass classification. IEEE Trans Syst Man Cybern Part B Cybern Publ IEEE Syst Man Cybern Soc 42(2):513
32. Chang CC, Lin CJ (2011) LIBSVM: a library for support vector machines. Acm Trans Intell Syst Technol 2(3):389–396
33. Du X, Cheng J, Zheng T, Duan Z, Qian F (2014) A novel feature extraction scheme with ensemble coding for protein–protein interaction prediction. Int J Mol Sci 15(7):12731–12749
34. Zahiri J et al (2013) PPIevo: protein–protein Interaction Prediction from PSSM based evolutionary information. Genomics 102(4):237–242 35. Zahiri J et al (2014) LocFuse: human protein–protein interaction predic‑