Eco 1001- Introduction
Eco 1001- Introduction
to Microeconomics
to Microeconomics
PART I INTRODUCTION TO ECONOMICS
3
Introduction to the Market Process :
3 of
Firms and Households: The Basic Decision-Making Units
firm An organization that transforms resources (inputs) into products (outputs). Firms are the primary producing units in a market economy.
entrepreneur A person who organizes, manages, and assumes the risks of a firm, taking a new idea or a new product and turning it into a successful business.
Input Markets and Output Markets: The Circular Flow
product or output markets The markets in which goods and services are exchanged.
input or factor markets The markets in which the resources used to produce products are
Barter vs. Markets
Barter vs. Markets
Barter system:
goods or services are
exchanged for other goods or services.
◦
Repair your neighbour's car in return for his or
her assistance in your garden. Problem – such
trade requires a
double coincidence of
wants,
so barter system has high
transactions costs
.
Money is therefore used to conduct trade
– it is easier.
Input Markets and Output Markets: The Circular Flow
FIGURE 3.1 The Circular Flow of Economic Activity
Diagrams like this one show the circular flow of economic activity, hence the name circular flow diagram. Here goods and services flow clockwise: Labor services supplied by households flow to firms, and goods and services produced by firms flow to households.
Payment (usually money) flows in the opposite
7 of
Input Markets and Output Markets: The Circular Flow
labor market The input/factor market in which households supply work for wages to firms that demand labor.
Input Markets and Output Markets: The Circular Flow
land market The input/factor market in which households supply land or other real property in exchange for rent.
Input and output markets are connected through the behaviour of both firms and households.
9 of
Demand in Product/Output Markets
A household’s decision about what quantity of a particular output, or product, to demand depends on a number of factors, including:
The price of the product in question.
The income available to the household.
The household’s amount of accumulated wealth.
The prices of other products available to the household.
The household’s tastes and preferences.
Demand in Product/Output Markets
quantity demanded The amount (number of
units) of a product that a household would buy in a given period if it could buy all it wanted at the
11 of
Demand in Product/Output Markets
The most important relationship in individual
markets is that between market price and quantity demanded.
Changes in Quantity Demanded versus Changes in Demand
Changes in the price of a product affect the quantity demanded
per period. Changes in any other factor, such as income or preferences, affect demand.
•Thus, we say that an increase in the price of Beef patty is likely to cause a decrease in the quantity of Beef patty demanded.
Demand in Product/Output Markets
demand schedule A table showing how much of a given product a household would be willing to buy at different prices.
Price and Quantity Demanded: The Law of Demand
TABLE 3.1 Anna’s Demand Schedule for Telephone Calls
Price (Per Call)
Quantity Demanded (Calls Per Month)
$ 0 30 .50 25 3.50 7 7.00 3 10.00 1 15.00 0 13 of
Demand in Product/Output Markets
Price and Quantity Demanded: The Law of Demand
FIGURE 3.2 Anna’s Demand Curve
Demand in Product/Output Markets
law of demand The negative relationship
between price and quantity demanded: As price rises, quantity demanded decreases; as price falls, quantity demanded increases.
Demand Curves Slope Downward
15 of
Demand in Product/Output Markets
Other Properties of Demand Curves
Two additional things are notable about Anna’s demand curve.
As long as households have limited incomes and
wealth, all demand curves will intersect the price axis. •For any commodity, there is always a price above which a household will not or cannot pay. Even if the good or service is very important, all households are ultimately constrained, or limited, by income and wealth.
That demand curves intersect the quantity axis is a matter of common sense. Demand in a given period of time is limited, by time and declining additional
satisfaction, even at a zero price.
Demand in Product/Output Markets
Other Properties of Demand Curves
Price and Quantity Demanded: The Law of Demand
To summarize what we know about the shape of demand curves:
1. They have a negative slope. An increase in
price is likely to lead to a decrease in quantity demanded, and a decrease in price is likely to lead to an increase in quantity demanded.
2. They intersect the quantity (X-) axis, a result of time limitations and diminishing marginal utility. 3. They intersect the price (Y-) axis, a result of
17 of
Demand in Product/Output Markets
income The sum of all a household’s wages, salaries, profits, interest payments, rents, and
other forms of earnings in a given period of time. It is a flow measure.
Income And Wealth
wealth or net worth The total value of what a household owns minus what it owes. It is a stock measure.
normal goods Goods for which demand goes up when income is higher and for which demand goes down when income is lower.
inferior goods Goods for which demand tends to fall when income rises.
Demand in Product/Output Markets
Income And Wealth
19 of substitutes Goods that can serve as
replacements for one another; when the price of one increases, demand for the other increases.
perfect substitutes Identical products.
complements, complementary goods Goods that “go together”; a decrease in the price of one results in an increase in demand for the other and vice versa.
Demand in Product/Output Markets
Prices of Other Goods and Services
Demand in Product/Output Markets
Tastes and Preferences
Other Determinants of Household Demand
Within the constraints of prices and incomes, preference shapes the demand curve (in other words tastes and preferences helps consumers to make the final decision) , but it is difficult to
generalize about tastes and preferences. •First, they are volatile.
21 of
Demand in Product/Output Markets
Other Determinants of Household Demand
Expectations
What you decide to buy today certainly depends on today’s prices and your current income and wealth.
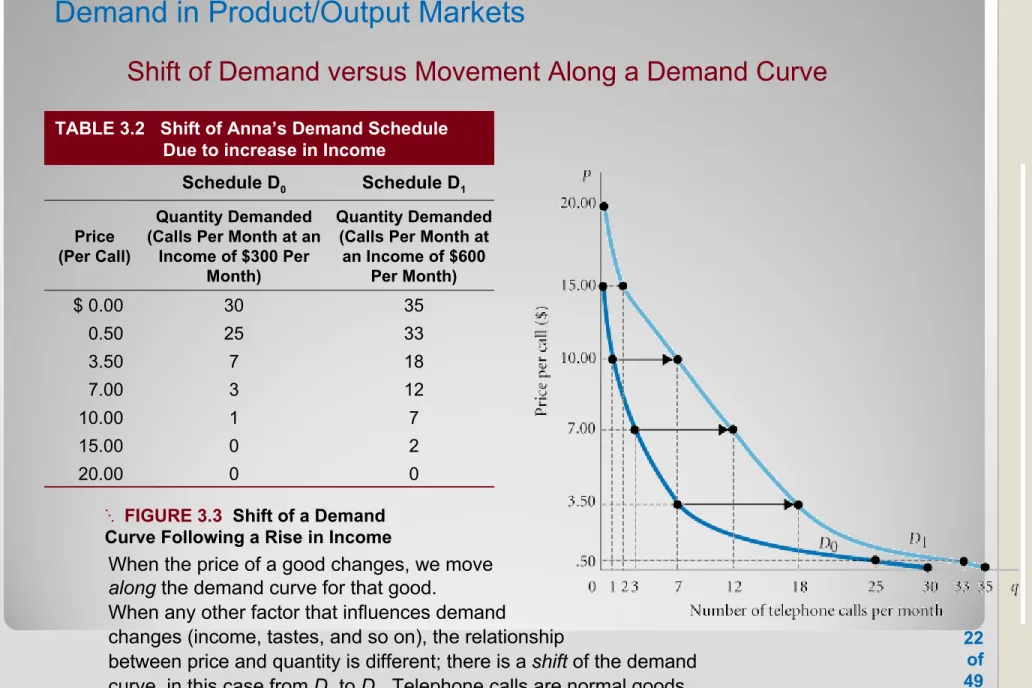
TABLE 3.2 Shift of Anna’s Demand Schedule Due to increase in Income
Schedule D0 Schedule D1
Price (Per Call)
Quantity Demanded (Calls Per Month at an
Income of $300 Per Month)
Quantity Demanded (Calls Per Month at an Income of $600
Per Month)
$ 0.00 30 35
0.50 25 33
3.50 7 18
7.00 3 12
10.00 1 7
15.00 0 2
20.00 0 0
Demand in Product/Output Markets
Shift of Demand versus Movement Along a Demand Curve
FIGURE 3.3 Shift of a Demand Curve Following a Rise in Income
23 of
Demand in Product/Output Markets
shift of a demand curve The change that takes place in a demand curve corresponding to a new relationship between quantity demanded of a good and price of that good. The shift is brought about by a change in the original conditions.
movement along a demand curve The change in quantity demanded brought about by a change in price.
Shift of Demand versus Movement Along a Demand Curve
Change in price of a good or service leads to
Change in quantity demanded (movement along the demand curve).
Change in income, preferences, or prices of other goods or services leads to
Demand in Product/Output Markets
FIGURE 3.4 Shifts versus Movement Along a Demand Curve
25 of
Demand in Product/Output Markets
FIGURE 3.4 Shifts versus Movement Along a Demand Curve (continued)
b. If the price of hamburger rises, the quantity of hamburger demanded declines— his is a movement along the demand curve.
The same price rise for hamburger would shift the demand for chicken (a substitute for hamburger) to the right and the demand for ketchup (a complement to hamburger) to
market demand The sum of all the quantities of a good or service demanded per period by all the households buying in the market for that good or service.
Demand in Product/Output Markets
27 of
Demand in Product/Output Markets
From Household Demand To Market Demand
Supply in Product/Output Markets
profit The difference between revenues and costs.
29 of
Supply in Product/Output Markets
Price and Quantity Supplied: The Law of Supply
quantity supplied The amount of a particular product that a firm would be willing and able to offer for sale at a particular price during a given time period.
Supply in Product/Output Markets
Price and Quantity Supplied: The Law of Supply
law of supply The positive relationship between price and quantity of a good supplied: An increase in market price will lead to an increase in quantity supplied, and a decrease in market price will lead to a decrease in quantity supplied.
TABLE 3.3 Clarence Brown’s Supply Schedule for Soybeans
Price (Per Bushel)
Quantity Supplied (Bushels Per Year)
$1.50 0 1.75 10,000 2.25 20,000 3.00 30,000 4.00 45,000 5.00 45,000 31 of Price and Quantity Supplied: The Law of Supply
FIGURE 3.6 Clarence Brown’s Individual Supply Curve
A producer will supply more when the price of output is higher. The slope of a supply curve is positive.
Supply in Product/Output Markets
Other Determinants Of Supply
The Cost Of Production
In order for a firm to make a profit, its revenue must exceed its costs.
Cost of production depends on a number of
33 of
To summarize:
Assuming that its objective is to maximize profits, a firm’s decision about what quantity of output, or product, to supply depends on:
1. The price of the good or service.
2. The cost of producing the product, which in turn depends on: ■ The price of required inputs (labor, capital, and land).
■ The technologies that can be used to produce the product.
3. The prices of related products.
Supply in Product/Output Markets
Other Determinants Of Supply
movement along a supply curve The change in quantity supplied brought about by a change in price.
shift of a supply curve The change that takes place in a supply curve corresponding to a new relationship between quantity supplied of a good and the price of that good. The shift is brought about by a change in the original conditions.
Supply in Product/Output Markets
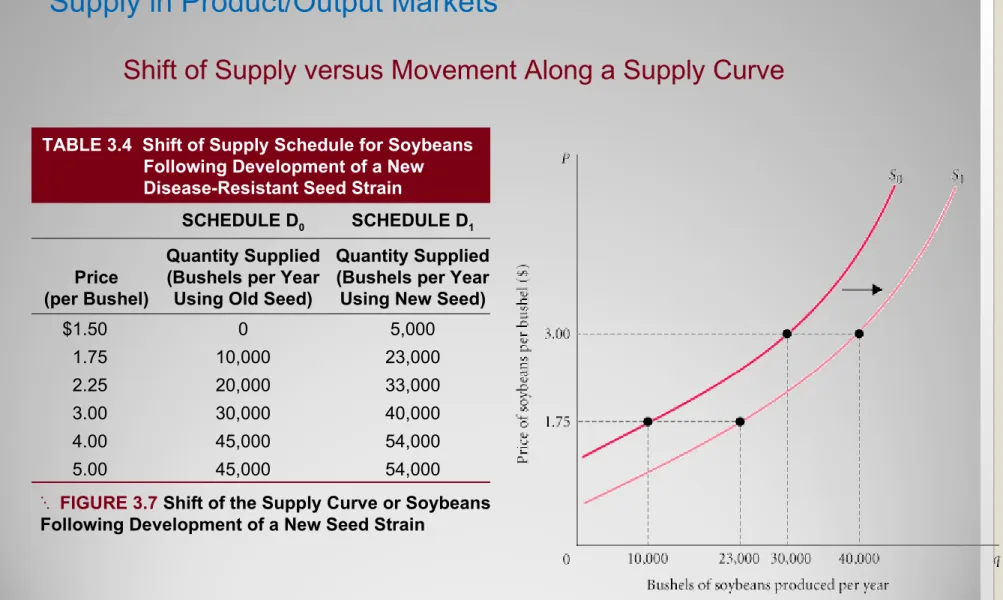
TABLE 3.4 Shift of Supply Schedule for Soybeans Following Development of a New Disease-Resistant Seed Strain
SCHEDULE D0 SCHEDULE D1 Price
(per Bushel)
Quantity Supplied (Bushels per Year
Using Old Seed)
Quantity Supplied (Bushels per Year
Using New Seed)
$1.50 0 5,000
1.75 10,000 23,000
2.25 20,000 33,000
3.00 30,000 40,000
4.00 45,000 54,000
5.00 45,000 54,000
35 of
Supply in Product/Output Markets
Shift of Supply versus Movement Along a Supply Curve
As with demand, it is very important to distinguish between movements along supply curves
(changes in quantity supplied) and shifts in supply curves (changes in supply):
Supply in Product/Output Markets
Shift of Supply versus Movement Along a Supply Curve
Change in price of a good or service leads to Change in quantity supplied (movement along a supply curve).
37 of market supply The sum of all that is supplied
each period by all producers of a single product.
Supply in Product/Output Markets
Supply in Product/Output Markets
From Individual Supply to Market Supply
39 of
Market Equilibrium
equilibrium The condition that exists when quantity supplied and quantity demanded are
equal. At equilibrium, there is no tendency for price to change.
Excess Demand
Market Equilibrium
Excess Demand
FIGURE 3.9 Excess Demand, or Shortage
At a price of $1.75 per bushel, quantity demanded exceeds quantity supplied. When excess demand exists, there is a tendency for price to rise.
When quantity demanded equals quantity supplied, excess demand is
41 of
Market Equilibrium
excess supply or surplus The condition that exists when quantity supplied exceeds quantity demanded at the current price.
Market Equilibrium
Excess Supply
FIGURE 3.10 Excess Supply, or Surplus
At a price of $3.00, quantity supplied exceeds quantity demanded by 20,000 bushels.
43 of
Market Equilibrium
Changes In Equilibrium
When supply and demand curves shift, the equilibrium price and quantity change.
FIGURE 3.11 The Coffee Market: A Shift of Supply and Subsequent Price Adjustment
Before the freeze (drop in temperature), the coffee market was in equilibrium at a price of $1.20 per pound. At that price, quantity
demanded equaled quantity supplied.
The freeze shifted the
supply curve to the left (from
Demand and Supply in Product Markets: A Review
1. A demand curve shows how much of a product a household would buy if it could buy all it
wanted at the given price. A supply curve shows how much of a product a firm would supply if it could sell all it wanted at the given price.
2. Quantity demanded and quantity supplied are always per time period—that is, per day, per month, or per year.
45 of
Demand and Supply in Product Markets: A Review
4. The supply of a good is determined by price, costs of production, and prices of related products. Costs of production are determined by available
technologies of production and input prices.
5. Be careful to distinguish between movements along supply and demand curves and shifts of these
curves. When the price of a good changes, the quantity of that good demanded or supplied
changes—that is, a movement occurs along the curve. When any other factor changes, the curve shifts, or changes position.
6. Market equilibrium exists only when quantity
supplied equals quantity demanded at the current price.
Looking Ahead: Markets and the Allocation of Resources
You can already begin to see how markets answer the basic economic questions of what is produced, how it is produced, and who gets what is
produced.
Demand curves reflect what people are willing and able to pay for products; demand curves are influenced by incomes, wealth,
preferences, prices of other goods, and expectations (What is produced).
Firms in business to make a profit have a good
47 of
REVIEW TERMS AND CONCEPTS
capital market complements, complementary goods demand curve demand schedule entrepreneur equilibrium
excess demand or shortage excess supply or surplus factors of production firm
households income
inferior goods
input or factor markets labor market
land market
law of demand law of supply market demand market supply
movement along a demand curve movement along a supply curve normal goods
perfect substitutes
product or output markets profit
quantity demanded quantity supplied
shift of a demand curve shift of a supply curve substitutes