AUSTRALIAN JOURNAL OF BASIC AND
APPLIED SCIENCES
ISSN:1991-8178 EISSN: 2309-8414 Journal home page: www.ajbasweb.com
Open Access Journal
Published BY AENSI Publication
© 2017 AENSI Publisher All rights reserved
This work is licensed under the Creative Commons Attribution International License (CC BY).
http://creativecommons.org/licenses/by/4.0/
To Cite This Article: Aws Al Doori., Waiting Time Factor In Public Transport By Binary Logistic Regression. Aust. J. Basic & Appl. Sci.,
11(4): 72-76, 2017
Waiting Time Factor In Public Transport By Binary Logistic Regression
Aws Al Doori
PhD Civil& Structural Engineering, Civil Engineering Dep., Engineering Faculty, Dar Al Salaam University, Sana’a, Yemen
Address For Correspondence:
Aws Al Doori, PhD Civil& Structural Engineering, Civil Engineering Dep., Engineering Faculty, Dar Al Salaam University, Sana’a, Yemen,
E-mail: [email protected]
A R T I C L E I N F O A B S T R A C T Article history:
Received 18 December 2016 Accepted 16 March 2017
Available online 25 March 2017
Keywords:
Binary Logit Model, Waiting Time, SPSS, Private Car and Public Transportation
The Binary Logit Model (BLM) is useful for situations in which it is desired to be able to forecast the presence or absence of a characteristic or result based on the values of a set of forecaster variables. It is similar to a linear regression model but is suited to models where the dependent variable is dichotomous. The aim of this study could be achieved by to outline a suitable policy which is likely to change private transportation to public transportation use, and predict the impact of the policy on the private transportation users by using the technique of shifting from private vehicles to public transportation. Binary Logistic Regration (P) is most widely used in practical applications because of its ease in the estimation and property of having a closed-form solution for the probability function. The P value was derived from Equation below which involve constant (D) and alpha (α) values to verify the logistic prediction model: P = 1/ 1+Deα (x). Analysis by SPSS approximately 60.3% answer of sample by questionnaire which distributed in Sana’a capital city of Yemen will most likely shift to public transport when the waiting time of public transport reduced from 15 minutes to less than 10 minutes.
INTRODUCTION
The increasing metropolitan population is the essential reason for the growth of transportation, and the growth of urban population around the world would also indicate the rapid growth of transportation globally (Transport Sector Unit 2006). By this, it is inevitable that road congestions require special attention and solution especially for urban areas (Dissanayake & Morikawa 2002). Due to this scenario, the authorities of many countries have attempted to restrict the use of private cars and encourage the use of public transport, where by such policies can be found in Libya Elmloshi (2014) China(Wang et al. 2013), Malaysia(Abuhamoud et al. 2011) (Nurdden et al. 2007) France (Harrison et al. 1998), Germany (Fitzroy & Smith 1998), Britain (Harrison et al. 1998), Netherland(Cheung & Hoen 1996) , Romania (Cheung & Hoen 1996) and Asian countries (Cheung & Hoen 1996).
Research Method:
(Elmloshi 2014) explained in his study the logistic regression estimates the probability of certain events occurring based on the independent variables. The Binary logit models, where there are only two alternatives are written as shown in Equation 1 and Equation 2;
𝑃
1= exp(U1)+exp(U2) exp(U1) (1)
P is the probability of shift U1 is the utility of mode 1
U2 is the utility of mode 2
P=1/ (1+eu) (2)
Where
P is the probability shift of alternative mode
The utility function expression is a represented by Equation 3 below.
Un = β0 + β1 XTT + β2 XTC + β3 Xage + β4 Xinc + β5Xno + β6Xwtpt …+ βn Xi (3)
Where
Un: total expression of utility analysis function.
β0 = intercept value (constant).
βi = coefficient of Xi, β1… βn the coefficient of independent variable (coefficients of explanatory variables).
When the independent variables are, X1…. Xn (explanatory variables) increases by one unit, the odds of the
Logit model or the dependent variable equals 1 increase by a factor of βn.
TT = travel time, TC = travel cost, age = age, inc = income, wtpt=waiting time for public transport and no = number of private car.
Binary Logit Model BLM is applicable to a broader range of research situations than the discriminate analysis. Logistic regression is used extensively in the medical and social sciences. Other names for Binary Logit Model BLM are used in various other application areas that include the logistic model, logit model, and maximum-entropy classifier. Elmloshi (2014) explained in his study this functional Equation 5 form is commonly identified as a single-layer "perceptron" or single-layer artificial neural network. A single-layer neural network computes a continuous output instead of a step function. The derivative of pi with respect to X is
computed from the general form as shown in Equation 3.11:
(5)
Where f(X) is an analytic function in X, with this shift, the single-layer network is identical to the logistic regression model. This function has a continuous derivative, which allows it to be used in the back propagation. The following functional 6 form is used in this study to determine the dependent variables.
(6)
Where,
P = the prediction shift probability of dependent variable D = a constant
α = coefficient of x x = the category of variable
e = the base of natural logarithms (approximately 2.718)
Results:
The model to assess how much of the travel shift behaviour could be explained by the socioeconomic characteristics and trip variables, such as travel time, travel cost, waiting time and others(Bajracharya A. R. 2008). The proposed mode shift model (Binary logit model) was developed to estimate the factors influencing the shift mode (waiting time) .The ccurrent study has revealed the significant effect of public transport’s waiting time on the decision making of citizen pertaining to their work and study travel mode. Analyzing by using SPSS software, table 1 below presents the time spent by respondents who wait for the public transport to work and study according to both survey result and probability of prediction (P) values. The P value was derived from Equation 6 below which involves constant (D) and alpha (α) values to verify the logistic prediction model.
) (
1
1
X f
e
y
) (var
1
1
iable
e
D
P
P = 1/ 1+Deα (x) (6)
Where,
P = Probability prediction of shifting into private car D = model constant
α = coefficient of x,
x = level of waiting time for PT
Table 1: Data calibration for Waiting Time Public Transport (WTPT)
Waiting time PT p 1-p 1-p/p ln(1-p/p)
<10min 0.397 0.603 1.518892 0.417981
15min 0.779 0.221 0.283697 -1.25985
25min 0.917 0.083 0.090513 -2.40227
35min 0.972 0.028 0.028807 -3.54715
45min 0.983 0.017 0.017294 -4.0574
>60min 0.9999 1E-04 0.0001 -9.21024
In the study, model shift probabilities involved six levels of waiting time for public transport as depicted in Figure 1. Note that shifting probabilities into public transport ranged from 60.3% with current waiting time less than 10 minute to 1% of shifting into public transport with waiting time more than 60 minute. To contradict this, the likelihood of users shifting into private cars increased from 39.7% with current public transport waiting time less than 10 minute to 99% when the waiting time is more than 60 minutes. From the Figure 1 split cars to public transport may be achieved when the waiting time for the public transport is around 12 minutes per trip by the public transport.
Fig. 1: Public Transport waiting time and the likelihood shift to cars
Noted that the predicted modelling probability was obtained from a single linear regression conducted by employing the Microsoft Excel analysis tools pack resulted in the estimation of intercept constant and the regression coefficient, α value(Nurdden et al. 2007). Information in Table 2 is responsible for the results in the Analysis of Variance (ANOVA) in Table 2. By using the variable coefficient, α and intercept coefficient values, the model shows the p value that is equal to 0.006172 which was significant (significance level 0.05).
Table 2: ANOVA result for the PT waiting time model
Intercept X Variable 1
Coefficients 2.42471 -1.64796
Standard Error 1.215589 0.312135
t Stat 1.994678 -5.27965
P-value 0.116824 0.006172
Lower 95% -0.95031 -2.51459
Upper 95% 5.799727 -0.78134
Lower 95.0% -0.95031 -2.51459
Upper 95.0% 5.799727 -0.78134
α = -1.65796 R2 = 0.8745
Where, R2 approaches one value indicate the model’s strong correlation power, and for this case, the
87.45% of changes in ln(1-p/p) were explained by the waiting time for PT
Conclusions:
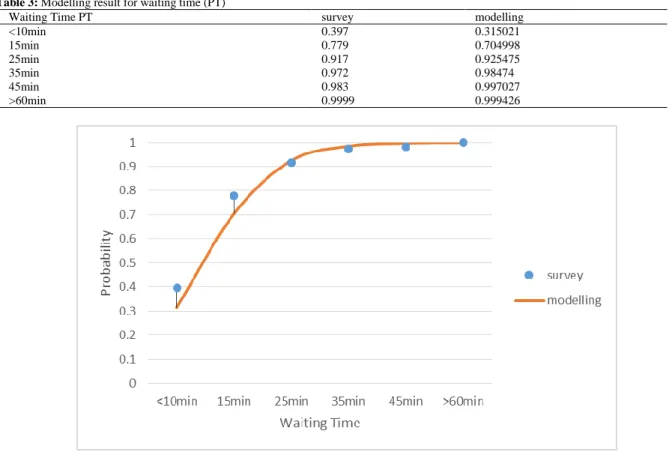
The prediction model was presented in Table 3 and Figure 2. The respective surveys data and modelling data correspond to the waiting time are detailed in Table 3. Values can be inserted into the calibrated logit model to validate its functionality. Taking waiting time for public transport less than 10 minutes, cumulative probability shift to car of 0.315021, showed maximum 8.2% score different from the survey data. Figure 2 shows the plot of the cumulative probability shifting into car users based on the waiting time in public transport. Based on the graph, we notice the steepest line that occurred at less than 10 minutes to around 15 minutes (model estimated) further indicating that the majority of users will most likely shift to public transport with probability increment of approximately 0.4 when the waiting time of public transport reduced from 15 minutes to less than 10 minutes.
Table 3: Modelling result for waiting time (PT)
Waiting Time PT survey modelling
<10min 0.397 0.315021
15min 0.779 0.704998
25min 0.917 0.925475
35min 0.972 0.98474
45min 0.983 0.997027
>60min 0.9999 0.999426
Fig. 2: Modelling result plot for waiting time (PT)
The study generally tries to find out and fill the researchs by using a Binary Logistic model to consider the model shift from private cars to public transport modes more specifically in Sana’a city .The shift from private cars to public transport modes is preferred as to achieve a sustainable transport system in the city with high number of private car users. The policy scenarios suggested in the literature studies can also be applied for studying the shift from travelling in private cars to travelling in the public transport system.
REFERENCES
Abuhamoud, M.A.A., R.A.O.K. Rahmat and A. Ismail, 2011. Modeling of transport mode in Libya: A binary Logit model for government transportation encouragement. Australian Journal of Basic and Applied Sciences, 5(5): 1291–1296. Available at: http://www.scopus.com/inward/record.url?eid=2-s2.0 84867713589&partnerID=40&md5=c58c32c52c68c44f2158bc0d9bbefbc4.
Bajracharya, A.R., 2008. The impact of modal shift on the transport ecological foot print, A case study of the proposed Bus Rapid Transit System in Ahmedabad, India. International Institute for Geo-information Science and Earth Observation.
Cheung, F. and A. Hoen, 1996. Relationships between transport and land use in Netherlands P. of P. 24th E. transport Forum, ed. Transport Policy and its Implementation.
Dissanayake, D. and T. Morikawa, 2002. A Combined RP/SP Nested Logit Model of Vehicle Ownership, Mode Choice and Trip Chaining in Developing Countries. In Traffic And Transportation Studies (2002). Reston, VA: American Society of Civil Engineers, pp. 588–595. Available at: http://ascelibrary.org/doi/abs/10.1061/40630%28255%2983 [Accessed February 13, 2017].
Elmloshi, A.E.A., 2014. Influencing Model Shift From Private Car To Public Transport: A Case Study In Tripoli. UNIVERSITI KEBANGSAAN MALAYSIA UKM.
Fitzroy, F. and I. Smith, 1998. Public Transport demand in Freiburg . Why did patronage duoble in decade Transport policy , 5: 163-175.
Harrison, S. et al., 1998. Quality bus corridors and green routes:can they achieve a public perception of permanence of bus services. Proceedings of PTRC 26th Europen Transport Conference:Public Transport Planning and Operations .
Millonig, A., M. Sleszynski and M. Ulm, 2012. Sitting, waiting, wishing: Waiting time perception in public transport. In IEEE Conference on Intelligent Transportation Systems, Proceedings, ITSC. pp: 1852-1857.
Nurdden, A., R.A.O.K. Rahmat and A. Ismail, 2007. Effect of transportation policies on modal shift from private car to public transport in Malaysia. Journal of Applied Sciences, 7: 1013-1018. Available at: internal-pdf://kanba1shift-1195721472/Kanba1shift.pdf.
Transport Sector Unit, I.D.E.A. and P.R., 2006. China Building Institutionsfor Sustainable Urban Transport, China: World Bank. Available at: internal-pdf://china-bldg-inst-1396111360/china-bldg-inst.pdf.
Wang, L. et al., 2013. Private Car Switched to Public Transit by Commuters, in Shanghai, China. Procedia - Social and Behavioral Sciences, 96(Cictp), pp: 1293-1303. Available at: http://linkinghub.elsevier.com/retrieve/pii/S1877042813022738.