Vol.5 No.1 February 2018: 1-8 Article history:
Accepted 10 January 2018 Published online 10 January 2018
Journal of Soft Computing and Decision
Support Systems
All-Inclusive Feature for Delivering Video Content in Cellular Networks
Using Small Stations
Azam Barfar a, Mohsen Mahrami a,*, Behnam Hadia,b
a
Department of Computer Engineering, Malard Branch, Islamic Azad University, Malard, Iran
a
Department of Computer Engineering, Malard Branch, Islamic Azad University, Malard, Iran
a,b
Department of Computer Engineering, Malard Branch, Islamic Azad University, Malard, Iran
* Corresponding author email address: azambarfar@yahoo.com
Abstract
With the advancement of technology, demand for video traffic is still increasing, and on the other hand, the frequency spectru m in cellular networks is saturated. In addition, to the important issue of saturation of the frequency spectrum, video traffic is another important factor for cellular networks, which is a high quality video service. If in a cellular network all users traditionally demand a high -traffic video from the central station, it may not be possible for the quality video data to reach the user and in the user's term, the problem of lack of proper service quality will be encountered. Assisting stations allow users to get better quality, faster speed and timely delivery of their video traffic requests by providing the new platform. In this paper, we have modelled the network, considering that at a given time, several users are requesting a high-res content, and the result is that the helping stations can respond to the needs of several users at a single time. The higher popularity of the file is, the more users are satisfied, and the amount of unloaded traffic has increased. In this paper, we showed that even with a limited number of files stored in the network using Zeta's distribution, a significant amount of traffic has been evacuated by unconnected communications through small stations. We set the average number of users under different network conditions, and the average rate of sending data is calculated and optimized through all-inclusive links.
Keywords: Content delivery, Zeta distribution, Cellular networks, Small stations, All-in-one communications
1. Introduction
With the ever-increasing demand for high data rates and high traffic volumes, cellular networks have undergone dramatic changes in recent years (Baştuǧ et al., 2015; Bastug et al., 2013). The third-generation network was provided for high-speed data, and in the evolution of cellular networks, a fourth-generation network was provided that greatly matched the needs of users for high data rates. Fourth generation networks have been introduced in the evolution of mobile communication systems, which uses IP protocol over the network layer to transfer data, image and sound, and uses packet switching to transmit data. The speed characteristic of this generation of mobile communications is much higher than previous generations. For fixed communications in speed mode, speeds of up to 1 gigabit per second are available for mobile communications such as cars or trains up to 100 Mbps (Gregori et al., 2016; Pingyod et al., 2014). Also, the upload speed has been increased in relation to previous generations up to 300 Mbps. Another important feature of this generation is the latency, which is very low in comparison with previous generations. In LTE, the delay is less than 10 ms, which is less and less depending on the
network scenario using optimization algorithms. The main advantage of this network is the use of TCP / IP protocols in the network core compared to previous generations, which is much more flexible and traffic control is simpler than the previous generations using conventional signalling (Pingyod et al., 2014). In this research we will use device-to-device communication capabilities to optimize the video traffic management algorithms to a large extent to meet the needs of network users.
2. Background
Liu et al., in 2016, determined the idea of coding at these stations, in which the stored content is encoded. In this research, the content is provided to users with various encodings depend on the physical conditions of the channel and the quality of the link (Liu et al., 2016).
Sadeghi et al., in 2015, determined the idea of using small stations as a content saver (Shnaiwer et al., 2015).
Siderar et al., in 2016, designed the architecture of the use of small stations as important contributors to wireless cellular networks. This research provided more opportunities in the field of wireless communications for researchers (Sridhar et al., 2016).
3. Proposed method
3.1System Model
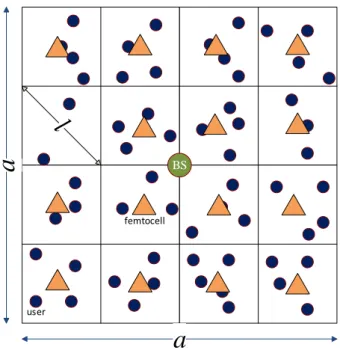
The network under investigation is a cellular cell that has several small stations and a central station. The central station connects to the main network infrastructure through a fiber optic that receives and sends control signals. Small stations are also connected to a central station via a separate communication link that receives and sends control signals. Fig. 1 shows the model of the proposed system. In this figure, the parameter (a) represents the cell's dimension. The parameter (1), shows the radius covered by each small station. Considering that the cell radius varies according to the fourth generation network (4G / LTE) in today’s cells, the radius of the cell under study is a kilometer. A certain number of users are distributed in a distributed network randomly around small stations. There are number of popular video file that have already been detected by users and are available to the central station. The central station uses the communication link with the main infrastructure of the network (Fiber Optic) to download these files in the hours of the day when the network has the least traffic load. After downloading these files, their central station distributes them between small stations. Each mini station saves a certain number of video files. Depending on the number of small stations on the network, the number of high-res files is divided among them. In this research, F station in the grid is assumed that are distributed uniformly across the grid. The coverage of each station is l meters (Xu et al., 2012).
BS
a
a
femtocell
user
Fig. 1. Proposed model (Xu et al., 2012).
Research shows that the popularity of video files complies with Zeta’s distribution. The Zeta distribution formula for
i
the file is as follows.1
i M
j
i f
j
(1)In the above relation, index
i
is related toi
th file from the m-library. The parameterm
shows the number of files in the library, which ism
here. The γ parameter is related to the distribution of zeta, which plays a major role in determining the popularity of the files. As the amount of this parameter increases, it indicates that a very limited number of high-end files are most popular among users. And as the amount of this parameter is lower, the popularity of video files in the library will be similar, and for very low values, the popularity of files will be closer to uniform distribution. That means all files are equally popular among users. That is, files with a lower index are most popular among users. For example, in formula (1), ifwe set
i
to 1, it indicates that file. 1 is most popular among users. Obviously, the last file in the library (that is, the file with index M) is less popular among users. Each small station can store a limited number of popular files. Due to the volume of the disk and the available space on the small stations, the number of files for storage in small stations is determined (Wang et al., 2015).3.1.1 Cell clustering
Clustering techniques in networks have long been considered by researchers and network designers. In this research, we use the clustering method of users and consider a number of users whose numbers are not specified as a cluster. The range of each cluster, depending on the coverage radius of each station, is small. Since the radius of coverage of each small station is equal to l, we consider the range of clusters l. To better manage the ease of the simulation process, we consider the clusters as quadrilateral. This assumption is used in various papers. We put small stations in the center of clusters (Leunget al., 2015).
3.1.2 Save video files to small stations
3.1.3 The process of sending requests by users
As noted, Zeta’s distribution is used to model the popularity of video files. To illustrate the performance of the under review system, we consider the worst case for user requests. That is, we assume that all users on the network at the same time randomly request a video file. If user requests are available at small stations, the requested file is delivered through a wireless communication link between the small station and the users. Otherwise, the requested files are delivered to the users in the traditional way through the central station.
Each user produces a random number according to the zeta distribution, which is a specific number between 1 and M. The generated number represents the requested file from the central station. Here, the violation of the parameter γ will be specified. This parameter plays an important role in determining the number of requests reached to each small station. By specifying the users' request, the process of sending information to them is carried out through a wireless communication link (Karimzadeh et al., 2016).
3.2 Send video files to users and link communication quality
After the requests are specified by the users, video files must now be sent to users. As stated, this is done through a wireless communication link. It should be noted that the frequency spectrum used in these communications varies with the traditional communication link (between users and the central station) to prevent frequency interference. To achieve this, we assume that the frequency spectrum of all mini-stations users varies, and that the frequency range of the small stations is different from the central station. Depending on the location of each user with the central station, the link communication quality is different, and so the link speed is not the same for all users. Here we use the standard drop down model (Khreishah et al., 2016).
r t
P Pd (2)
In this equation the parameter
pt
represents the power supplied by the small station. The parameter d represents the user's distance with the small station and the parameterQ
(alpha) represents the path loss coefficient. This relationship shows the amount of power received per user according to the given parameters. Obviously, the closer the user's distance to the small station is, the more power will be received, and as the user's distance to the station increases, the amount of power received per user decreases. In other words, the amount of power received per user shows the quality of the wireless communication link. We present the famous signal-to-noise relationship. Signal to Noise is the primary formula for measuring link communication quality. Since there is no frequency interference in the system, the signal is transmitted by the small station without interference to the users. But nonetheless, there are always noises in the systems that we are considering in this system. Assuming that the amount of noise in the system and for all communications withGaussian distribution is determined by the variance defined by
Q
, the signal-to-noise relationship is defined as follows:r P SNR
(3)
So, in short, each user has a different signal-to-noise ratio depending on the distance with the central station, which is the main and final parameter in determining the link quality of the link.
3.3 Wireless link speed to send video files and total system capacity
After obtaining the signal-to-noise parameter for each communication link, we can calculate the communication link speed using the well-known Shannon relationship:
2
log (1 SNR)
RW (4)
In the above relation, the parameter w represents the bandwidth of the connection, which is in Hz. The speed of the wireless communication link is expressed in bits per second. As noted above, link communication quality is not the same for all users because of different distances with the small station, so the amount of linking speed is not the same for different users. Eq. (4) is also introduced as the communication link capacity. So, from this point on, the link speed is the same as the communication link capacity, and the two will accept a common concept.
With the capacity of a free communication link for a user, we can calculate the total capacity of the communication system between asmall station and several users as follows:
1
N p x
x
T R
(5)In this regard, the parameter
n
represents the total number of wireless communication links with the smallM
P
station. The parameter RX represents the link communication capacity for the user x. If the total number of small stations in the cell environment is equal toQ
, the total capacity of the system, taking into account the connections of the small stations of users, is equal to:1 1 1
q
N Q Q femto q x
q q x
T T R
(6)In the above relation, the parameter
N
q represents the3.4 the amount of traffic discharged using small-scale wireless communications
Quite simply, the proportion of traffic jetted using the small-scale communications of small stations is as follows:
1
i
k
u i
V
(7)In the above relationship, the
v
u parameter represents the size of the file received by the useru
. This relationship shows the ratio of capacity created by small stations.4. Analysis and calculated results
4.1 Simulation coefficients
The investigated system consists of a single-cell network with a square. This size is in accordance with the standards provided by the 12th generation of the fourth-generation
LTE
network, and the value of one kilometre for the size of the network under our review is also a reasonable number and standard. Cluster the whole cell and make clustering based on a standard size. According to the standards provided for new and future generation networks (fifth generation), the radius covered is for small stations between 250 and 500 meters. Therefore, in this research, we consider the size of the clusters for each of 250 and 500 meters. Given that the radius of the whole cell is one kilometre, the number of clusters with a radius of coverage of each of them is equal to 16 meters, and if the radius covered by small stations is 500 meters, the number of virtual clusters will be 4. The placement of small stations in the cell is entirely calculated, is their location is not accidental, since all operators fully calculate their stations in the network. In the simulation environment for the system under study in this research, we place them in the center of the clusters. The number and location of users in the entire system is completely random and, as noted in the previous chapter, the distribution of users is based on a uniform distribution. The number of distributed users in this system is 500, 1000, 1500, 2000, and in each Monte Carlo simulation loop, we distribute this number across the entire network. Naturally, because of the randomness of their placement, in each Monte-Carlo ring, the number of users covered by each small station is also random. We consider video files as a 1000-by-one library. The order of their placement is in the order of their popularity, and the first file is most popular, and the 1000 file is the least popular among users. We will list 100 and 200 first-order files in the memory of all the small stations. We consider the coefficients examined for Zeta with the standard numbers analyzed in the analysis of video content in the networks: numbers 1.2 and 0.8 are reported in the actual analysis of the popularity of video files in the networks and In this study, we use the same numbers to simulate. Assuming that using multiple encoded access method, multiple connections can be established simultaneously with several types of data between the central station and the users. That is, if multiple users at one moment request
different files from small stations, the encrypted multiple access method is used to avoid interference in the delivery of the data. This method is one of the many access techniques in wireless communications that has always been used in wireless networks. The path loss ratio is considered to be 2.6 in wireless communications, which is also introduced in the standards of the new generation networks. This distribution and this average have also been widely used in large-scale wireless networks such as the network under investigation in this study. The amount of power for small stations is 10 watts and for users of 200 millimetres. Usually, power is expressed in dB networks, with 10 watts’ power equal to 10 dB, and a power of 200 mile watts equal to 7 dB. We consider the bandwidth used for each link to be 180 kHz. This number is equivalent to a physical radio block for the fourth-generation network's Frequency. This bandwidth is the most recent division in the frequency spectrum assignment, which has so far only been implemented in advanced fourth-generation networks and, according to the fifth generation standards, this bandwidth is for each block. Physical will continue to be used in 2020. We assume that the file size in the library is between 5 MB and 50 MB. Generally, the most popular files in networks, according to the analysis, have a smaller volume than the rest of the files. To illustrate the randomness of the size of the files in the video content in the library, we consider distribution of their volume as a random distribution on the basis of uniform distribution. But this randomness of the volume has no disruption in the sort of downside (in terms of popularity) of the files. The random user request (which is based on the zeta distribution) of the file size requested (which is based on uniform distribution) is completely independent, and these two random distributions do not have any random coincidence.
4.2 Simulation Method
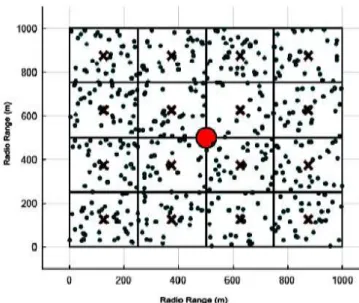
To use the simulation environment, we use the Monte Carlo method. The desired cell implemented in the simulation environment is shown in Fig. 2.
The examined cell has a central station, located in the center of the cell in Fig. 2 as a larger cell. In this figure, 1000 users are randomly distributed within the cell, as can be seen, the number of users in each cell is not necessarily equal, and their number in each cell is completely random. In each Monte Carlo ring, Fig. 2 is rebuilt, and in each reconstruction (in each loop), the users’ locations are changed randomly. The center of each cluster is equipped with a small station, and in each reconstruction, their location will not change. Their location is always in the center of the clusters, and when the size of the clusters changes, their geographic location changes due to the displacement of the center of the clusters.
method. All three functions are called in each Monte Carlo loop.
Fig. 2. Simulation environment in MATLAB with distributed users
First sub-program: Detect users in each cluster
In this sub-program, the number of users inside each cluster, along with their geographic location, is detected in terms of coordinates
( , )
x y
It also determines which user is in each cluster.Subprogram 2: Detect user requests
After detecting users in each cluster, we use a random number generator function based on Zeta's distribution (this distribution was introduced in detail in the previous chapter), we identify their request. In this phase of implementation, we specifically know what video users are requesting, and we also know which of the requested content is stored in small station memory. Users requesting them at small stations related to the cluster in which they are located will receive the content they are requesting through the offline link to the central station in the traditional way. In this research, users’ communications with the central station are not monitored and the main focus is on small stations.
Sub-program III: Deliver video content to users and calculate network passwords
Once the applications are detected in the previous sub-program, the wireless communication links are now established to deliver the video content, and the netting is calculated using descriptive relationships in the third chapter.
All three subroutines are called up for 1000 Monte-Carlo loops and calculations for each loop are stored in different matrices. After the end of the Monte-Carlo rings, we average all stored values, and the problem's goals are obtained in average values and we plot them as graphical graphs. In the following, all of these diagrams, along with a description of the behavior of the system, are examined in detail.
4.3 Simulation results
4.3.1 Average number of users covered by small stations and cellular users covered by the central station
Because the distribution of users across the network is uniform, mathematically the chances of users staying around all the same stations are the same. The meaning of the surroundings of each central station is the coverage radius of the station, which we discussed in detail in the system model. So, because of the equivalence of the probability of a random number of users being the same for all clusters, and for the purpose of checking the efficiency of the small stations, it's enough to focus on a small station and examine all the results for it in detail. The results obtained by focusing on a station are true for all stations. The effect of the size of the coverage radius of each small station:
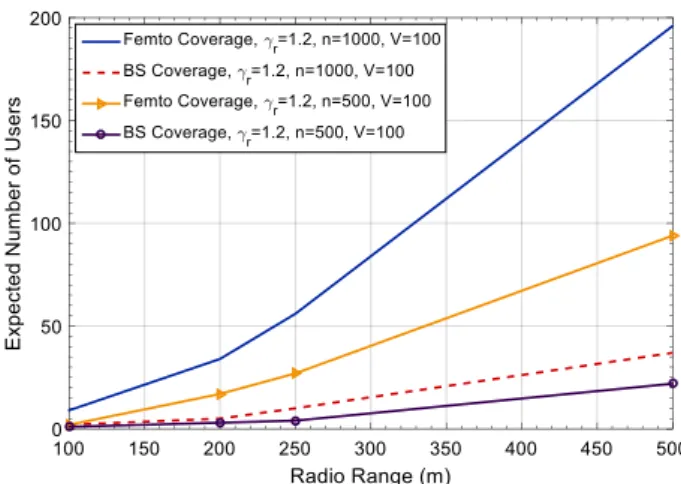
Fig. 3 shows the average number of users (receivers) covering the small stations and the central station. As shown in this Fig.3 due to equal conditions in simulation coefficients for the entire system, the number of users covered by small stations is larger than the number of users covered by the central station. As discussed in detail in previous sections, users tend to have more files stored in small stations. By increasing the radius covered by the small station, the average number of users of the requesting users increases, due to the fact that by increasing the radius covered by the small station, the crowd of users in an environment covered by the central station is randomly distributed (uniformly) Increases. Users who can-not find the contents of their application in the small station memory can receive the content they request through a direct link to the central station.
Fig. 3. The number of covered users per radio station covered by the small station
4.3.2 Effect of Zeta's Coefficient:
see, with increasing Zeta's coefficient, the average number of receivers increases dramatically. For more Zeta coefficients, the average number of users applying to the station will be larger and larger.
Fig. 4. The number of covered users per radio range covered by the small station for different values of Zeta's coefficient
The effect of the number of files stored in each small station:
Fig. 5. The number of users covered by the radio range covered by the small station for different values of the number of files stored at the small station
Fig. 5 shows the effect of the number of files stored in small stations. By increasing the number of files stored in small stations, the chances of finding content for user requests also increase. But, as seen in this figure, the increase in the number of stored files does not have much effect on the average number of requesting users, and this is technically very important and suggests the fact that even with a small number of content Saved at the small station, the average number of users is considerably higher than the number of users the central station is responsible for delivering content they requested. Naturally, if all the files in the library are stored at these stations, with feasibility, all the requests of users by small stations through e-mail links will be possible.
The impact of the number of users in the entire network:
Fig. 6. The number of users covered by the radio range covered by the small station for different values of the number of users
Fig. 6 shows the effect of the total number of users in the cell on the average number of requesting users to the small station. It is natural that with the increase in the number of users in the entire network, their congestion is randomly increased in the surroundings of small stations, and many users can find their video content in the memory of small stations. All description of Figs. 4 and 5 is valid for Fig. 6.
4.3.2 The amount of traffic depleted by small stations and the effect of important factors
This section examines the efficiency of small stations in traffic evacuation. The purpose of traffic evacuation is to deliver video content requested by users through small stations. To do this, we first need to identify the number of users covered by each small station, which is the identification by sending the request to users and searching the requested content in the corresponding small station memory. The extracted graphs for this section are apparently similar to those for the average number of users, due to the direct relationship between the average number of applicants applying to the small station and the amount of traffic depleted by the small station.
The effect of the size of the coverage radius of each small station:
Fig. 7 shows the level of single-parameter mode for the amount of traffic depleted by small stations. As seen in the results of the previous sections, as the radius covered by the small station increases, the crowd of users around it increases randomly, followed by the increase in the number of applications flowing to the central station. As seen in this figure, significant traffic by small stations is evacuated on the network for steady values of the number of users, the number of stored files, and the zeta coefficient.
Fig. 8. The amount of traffic depleted by the station in gigabyte per radio station, covered by the small station for different values of the zeta factor
and the number of files stored.
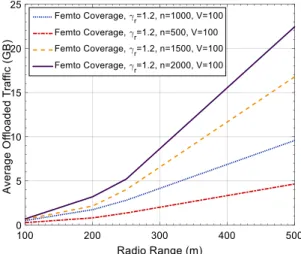
Fig. 8 shows the effect of Zeta’s coefficient on the amount of traffic drained on the network. As expected, with the increase of the Zeta coefficient, the number of users requesting the station increased, followed by the e-mail communication, the request of covered users was answered, and the amount of evacuated traffic increased Finds Fig.9 shows the impact of the total number of network users on the amount of traffic that has been discharged. As seen in the results of the previous sections, the increase in network users increases the crowds around small stations. Description of Fig. 6 is also valid for Fig. 9.
Fig. 9. The amount of traffic depleted by the station in gigabyte per radio range covered by the small station for the number of users
4.3.3 Network throughput in terms of average rate in the whole system
Along with improving the system's performance by e-mail communication by small stations, we expect e-e-mail communications to increase system performance as well as the average rate of communication, as described in the previous chapter. The realization of this improvement is due to the increase in the number of link-free links in the process of delivering video content to the requesting users. In Figs. 4 to 9, we see that if a certain number of video content is stored at small stations, the average number of requesting users increases to these stations. Due to these requests and identification of the requested video content, we calculated the amount of traffic that can be drained in the network. We now want to know how the wireless links that can be used to deliver video content using e-commerce communications can increase the rate of data transmission on the network. Fig. 10 shows the average rate of sending information in the wireless communications between small stations and the requesting users. As shown in this figure, the rate of sending information through the wireless links is noticeably more than the wireless communications of users with the central station.
One of the most important reasons for improving the rate of sending data by small stations is the close availability of the requesting users to these stations. Because the power of the received signal increases by reducing the distance from the users of the small stations, in other words, the wireless communication link is better. The effect of Zeta's coefficient and the total number of users in the network is the same as the extracted graphs in the previous sections. Another important issue that could not be outlined through these simulations is that the quality of service in the communication of small station stations is better than traditional communications with the central station. And it’s because of the high signal strength that users receive. In the new generation networks, service quality is one of the most important factors affecting the performance of systems, and in our system under review, this issue is indirectly visible.
5. Conclusion
In this paper, we propose a new method for delivering video content using e-mail communication in new generation networks. The proposed method is based on the use of small stations instead of the central station. In the works done so far, communication at small stations to deliver video content and the impact of important parameters in content delivery networks, including the distribution of zeta as a real parameter in content delivery networks, in the performance of all the small stations was not analyzed. We have shown in this paper that, even with a limited number of files stored on the network, a significant amount of traffic can be evacuated by small e-mail communications through small stations. We surveyed the average number of users under different network conditions, and finally we calculated the average rate of sending data by e-mail hyperlinked links. These networks will be deployed in the next generation, but there are challenges in this regard, which are listed below as a suggestion for future work.
6. Challenges and suggestions
Energy consumption is one of the most important challenges ahead in wireless communication networks. Small stations can greatly reduce the network traffic load, but all operations require energy. The energy consumption of small stations is directly related to their power supply. If these stations operate with constant power, the amount of energy consumed increases linearly, and because of the random nature of the presence of receivers around neighboring stations, it also increases the frequency interference. Therefore, by controlling the power of small stations, you can optimize energy consumption and reduce interference.
References
Baştuǧ, E., Bennis, M., Kountouris, M., & Debbah, M. (2015). Cache-enabled small cell networks: Modeling and tradeoffs. EURASIP Journal on Wireless Communications and Networking, 2015(1), 41.
Gregori, M., Gómez-Vilardebó, J., Matamoros, J., & Gündüz, D. (2016, May). Wireless Content Caching for Small Cell and D2D Networks: in IEEE Journal on Selected Areas in Communications, 2016(5),34.
Pingyod, A., & Somchit, Y. (2014). Content updating method in FemtoCaching: Computer Science and Software Engineering (JCSSE), 2014 11th International Joint Conference on, Chon Buri, 2014 (pp. 123-127).
Pingyod, A., & Somchit, Y. (2014). Rank-based content updating method in FemtoCaching (IEEE), 2013(pp. 1-6).
Liu, T., & Abouzeid, A, (2016). Content Placement and Service Scheduling in Femtocell Caching Networks: in Global Communications Conference (GLOBECOM), 2016 (pp. 1-6). Shnaiwer, Y. N., Sorour, S., Aboutorab, N., Sadeghi, P., & Al-Naffouri, T. Y.(2015). Network-coded content delivery in femtocaching-assisted cellular networks: in Global Communications Conference (GLOBECOM), 2015(pp. 1-6). Sridhar, A., Karamchandani, N., & Prabhakaran, V. M. (2016).
Coded caching in hybrid networks: in Twenty Second
National Conference on Communication (NCC), 2016 (pp. 1-6).
Xu, Y., Yin, R., Han, T., & Yu, G. (2012). Interference-Aware Channel Allocation for Device-to-Device Communication Underlaying Cellular Networks (ICCC). 2012.
Wang, T., Song, L., & Han, Z. (2015). Dynamic femtocaching for mobile users: IEEE Wireless Communications and Networking Conference (WCNC), 2015(pp. 861-865). Leung, W. P. T., & Shikh-Bahaei, M. (2015). A new
femtocaching file placement algorithm for Telemedicine: Annual International Conference of the IEEE Engineering in Medicine and Biology Society (EMBC), 2015 (pp. 1377-1380).
Shnaiwer, Y. N., Sorour, S., Aboutorab, N., Sadeghi, P., & Al-Naffouri, T. Y. (2015). Network-Coded Content Delivery in Femtocaching-Assisted Cellular Networks: IEEE Global Communications Conference (GLOBECOM), 2015(pp. 1-6). Karimzadeh Kiskani, M., Sadjadpour, H. (2016). Multihop
Caching-Aided Coded Multicasting for the Next Generation of Cellular Networks: in IEEE Transactions on Vehicular Technology, 2016(pp.1-1).
Khreishah, A., Chakareski, J., Gharaibeh, A. (2016). Joint Caching, Routing, and Channel Assignment for Collaborative Small-Cell Cellular Networks: in IEEE Journal on Selected Areas in Communications, 2016(pp.1-1).