DOI: 10.15575/join.v5i1.575
105
Website Based Greenhouse Microclimate Control
Automation System Design
Muhammad Hafiz1, Irfan Ardiansah2, Nurpilihan Bafdal31, 2, 3Department of Agroindustrial Technology, Padjadjaran University, Indonesia
Article Info ABSTRACT
Article history: Received May 14, 2020 Revised June 8, 2020 Accepted June 28, 2020 Published July 15, 2020
Microclimate control is very important for plants cultivation in a greenhouse, two of microclimate variables are temperature and humidity, this variable can be controlled using several methods, one option is to use the misting cooling system, but this process is still done manually. This study aims to create a greenhouse microclimate control system that can be automatically displayed and controlled via a website. This research uses engineering design methods. The results show that the system can automatically turn on the misting cooling system when temperatures are above 30 ℃ and RH below 80%. Greenhouse microclimate data can be displayed and controlled via a website. The UV index greatly influences the performance of the misting cooling system on temperature and RH conditions in the greenhouse, while the UV index rises to 12 the temperature cannot be lowered and RH cannot be increased, but when the UV index falls from 12 the temperature can be reduced by ± 3 ℃ and RH can be increased by ± 12%.
Keywords: Automation Greenhouse
Microclimate Control Misting Cooling System Website
Corresponding Author: Muhammad Hafiz,
Department of Agroindustrial Technology, Padjadjaran University,
Jl. Raya Bandung – Sumedang KM.21 Jatinangor, Indonesia Email: muhammadhafiz7724@gmail.com
1. INTRODUCTION
A greenhouse is a building used to cultivate plants, and this building is composed of a translucent material such as glass or plastic to form a microclimate inside a greenhouse that is different from the surrounding climate. A microclimate is a special environmental condition in a limited area, the occurrence of microclimate in the greenhouse is caused by changes in sunlight entering the greenhouse into longwave radiation and trapped inside the greenhouse, this radiation will heat plants, the soil inside, and the air around the soil that makes the temperature inside the greenhouse becomes higher than the temperature of the surrounding environment.[1].
The formation of microclimate inside a greenhouse makes the environment adequate for plant growth. Still, for some cases in wet tropical countries such as Indonesia, the temperature and humidity of the air inside the greenhouse are sometimes too high, which triggers stress on plants and stimulates the growth of fungi that brings disease in plants[2].
Website Based Greenhouse Microclimate Control Automation System Design
(Muhammad Hafiz1, Irfan Ardiansah2, Nurpilihan Bafdal3)
106
2. Seedling Growth 18 21-24 32
3.
Fertilization (Afternoon)
(Night) 10 15-17 30
18 20-24 30
4. Color Development 18 20-24 30
The room inside of a greenhouse has a different treatment from the outside environment, and several parameters need to be engineered properly according to the plant's needs for optimal growth, these parameters are but not limited to temperature, humidity, and light intensity [6]. These microclimate control can be done with a cooling system. A cooling system is a device that is installed in a greenhouse to reduce air temperature and increase the humidity inside, one of the cooling systems that can be used for greenhouses is misting cooling system [7]. Misting cooling system is a cooling system that uses water as its cooling subject, the water is released through a nozzle with a high-pressure pump and forms a smooth splash of water (dew), it can be done manually but the tool needs to be controlled by an operator for 24 hours. This condition requires an automatic control system for the tool to run by itself without having to be controlled intensively.
The entire automatic control system will be controlled by Raspberry Pi as the center, commands from Raspberry Pi will be forwarded to the website to make data reading and controlling task easier. Raspberry Pi is a small computer and can also be called a microcomputer, and this device can work as an ordinary desktop computer [8]. Raspberry Pi has the advantage of a wired or wireless network connection, having a Linux-based operating system benefits Rasberry Pi to have large storage capacity and lots of applications which functions as a mini server for websites. The GPIO pin contained on this device serving Raspberry Pi to work as a micro-controller. [9].
The sensors used in this study are the SHT11 sensor, the GUVA-S12SD sensor, and the relay. The function of the SHT11 sensor detects the temperature and humidity of the micro-greenhouse climate. The study [10] shows that the SHT11 sensor has the best performance at a temperature of 25° C with a tolerance level of ± 0.5° C and RH (20-80)% with a tolerance level of ± 3%. GUVA-S12SD sensor functions to detect the intensity of light in a greenhouse in UV index units. The study [11] shows that the GUVA-S12SD sensor can function to automate smart home lights. The relay functions as a switch that will turn on and off the device according to the instructions of the Raspberry Pi. The relay has two main parts, namely the electromagnet (coil) and the mechanics (switch). The relay uses the electromagnetic principle to move the switch contacts so that a small electric current run through the device and conduct higher-voltage electricity [12].
This research will create an automatic greenhouse microclimate control device to help maintain the microclimate conditions that remain stable for tomato plants cultivated by control via the website. In its implementation, this tool will record greenhouse microclimate data every minute for each day, and the maximum and minimum microclimate can be flexibly changed via the web to cater to a wide range of plant variety in the future. The method used in this research is engineering design method, this method is a series of activities consisting of planning, designing, constructing, and applicating which in its application will produce new modifications in the form of processes or products. [13].
2. METHOD
The method used in this research is the engineering design method, which creates an automatic control system to engineers the microclimate in the greenhouse. In order to objectify this automatic control system, this research uses the Python programming language and integration into the website using the HTML, MySQL, and PHP programming languages.
107
Figure 1. Research phase
2.1. Problems identification
Before making the tools, identify problems that occur in the greenhouse by monitoring the condition of the greenhouse and interviewing the owner of the greenhouse about the shortcomings or problems that still exist in the location.
2.2. Greenhouse condition data collection
The next stage is to collect data about the greenhouse utilizing field observations to determine plant varieties planted, the condition of the original microclimate, the dimensions of the greenhouse dimensions, handling when the microclimate is not suitable for plants, and the tools that are available in the greenhouse can potentially support tool making.
2.3. Study of literature
This stage is carried out to gather references sourced from books, journals, theses, and websites that are relevant to the subject of research to be a comparison and reference for developing tools to be built.
2.4. Needs analysis
Website Based Greenhouse Microclimate Control Automation System Design
(Muhammad Hafiz1, Irfan Ardiansah2, Nurpilihan Bafdal3)
108
7 Duradus Automation Tool Protective Cover 1
8 GUVA-S12SD Sensor Measuring UV INDEX Sunlight 1
9 Jumper Cable Sensor Connection Cable to Raspberry Pi 24
10 Laptop Accessing Raspberry Pi 1
11 Nozzle 0,3mm Breakwater Water Into Dew 18
12 Quick Connector Hose and Water Pump Connector 2
13 Raspberry Pi 3b+ Automation Control Center 1
14 SD Card (16gb) Raspberry Pi memory 1
15 SHT11 Sensor Measuring Temperature and Humidity 1
16 Terminal Water Pump Plugs and Automation Tools 2
17 Wooden Box Water Pump Protector 1
Table 3. Automatic microclimate control software
No Name Function
1 Advanced IP Scanner IP Address Finder
2 Balena Etcher Bootable OS Raspberry Pi
3 Bootstrap 4.4 HTML Framework
4 HTML 5 Web Programming Language
5 MySQL Web and database programming language
6 PHP Web Programming Language
7 Putty SSH
8 Python 3.0 The Raspberry Pi Programming Language
9 Raspbian Raspberry Pi Operating System
10 Windows 10 Laptop Operating System
2.5. Design process
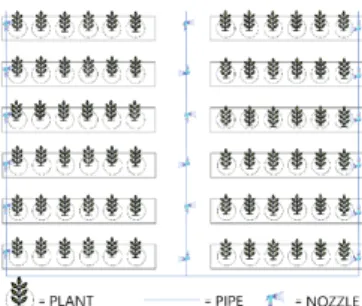
Making a design is the initial activity in realizing the manufacture of tools, by doing design blueprint, the shape of the tool will be visualized in as much detail as possible to clarify the placement of the components needed when assembling tools. Following is the schematic design and placement design of the misting cooling system, which can be seen in Figure 2 and Figure 3.
109
Figure 3. Misting cooling system placement design
2.6. Mechanism design
Before entering the tool manufacturing stage, the mechanism design is carried out in advance so that an appropriate workflow can be found for the tools manufacturing, and the automatic control system mechanism is divided into two different environments namely the information environment and the technical environment, the technical environment is the place where the system processes microclimate data and executing commands that will be sent to the device, while the information environment is a place where the system displays information on the microclimate and determines temperature or humidity in the greenhouse, the flow of the automatic control system mechanism can be seen in Figure 4.
Figure 4. The flow mechanism of automatic microclimate control
2.7. Functional design
The functional design is carried out to elaborate each component of the greenhouse automation system so that each component function is known and reasoning its use in the system. The function of the components system can be seen in Table 2 and Table 3.
2.8. Assembling and programming tools
The phase of tool assembling and programming is done by referring to the planning that has been done in the previous stages. Each component will be assembled to become a tool that functions automatically. Programming is done using Python and Raspberry Pi with access to a laptop with the Putty application.
The running time of the misting cooling system is determined by psychometric calculations. This begins by finding the temperature of the wet-bulb with the following equation [14].
𝑇𝑤 = 𝑇 atan [0,15197 ∙ (𝑅𝐻% + 8,313659)^(1/2) ] + atan (𝑇 + 𝑅𝐻%) − atan (𝑅𝐻% − 1,676331) + 0,00391838 ∙ (𝑅𝐻%)^(3/2) ∙ atan (0,023101 ∙ 𝑅𝐻%) − 4,686035
Information:
𝑇! = Wet bulb temperature (℃);
𝑇 = Dry bulb temperature (℃); 𝑅𝐻 = Relative humidity (%).
This next equation is used to calculate the pressure of the saturated water vapor temperature of a wet-bulb in a greenhouse [15].
𝑇!"= 𝑇!+ 273.15
𝑒#$!"= (−5,8002206) ∙ (1000 𝑇⁄ !") + 1,3914993 + (−4,8640239 100⁄ ) ∙ 𝑇!"
+ 4,1764768 100000 ∙ 𝑇⁄ !"%+ (−1,4452093 100000000⁄ ∙ )𝑇!"&+ 6,5459673
∙ log 𝑇!"
Website Based Greenhouse Microclimate Control Automation System Design
(Muhammad Hafiz1, Irfan Ardiansah2, Nurpilihan Bafdal3)
110
ei = Water vapor pressure in the greenhouse (kPa); Po = Atmospheric pressure (kPa).
The next equation is used to calculate absolute humidity in a greenhouse. 𝑋"= (𝜀 ∙ 𝑒") (𝑃⁄ '− 𝑒")
Information:
Xi = Absolute humidity in a greenhouse (kg.kguk-1);
𝜀 = The ratio of water molecular weight to air molecules (0.6222).
The next equation is used to calculate the water flow to be sprayed by the misting cooling system. 𝑚( = 𝑉 ∙ 𝐴 ∙ NO(𝑅𝐻"$⁄100) ∙ 𝑋#"P − 𝑋"Q 𝑅⁄
mf = V∙A∙[((RHit/100)∙Xsi) – Xi]/R
Information:
𝑚( = Discharge of water to be sprayed (kg.s-1);
𝑉 = Mass-based ventilation rate (kg.m2.s-1); 𝐴 = Surface area of the greenhouse (m2); 𝑋#" = Saturated absolute humidity (kg.kguk-1);
𝑅𝐻"$= Expected greenhouse RH (%);
𝑅 = Ratio of evaporated masses to water (0 – 1).
The next equation is used to calculate the duration of the misting cooling system. 𝑡( = 𝑡(#∙ O𝑚(⁄𝑚)P
Information:
tf = On time water pump duration (s); tfs = Cycle time (s);
mr = Nozzle discharge (kg.s-1).
2.9. Website design and integration
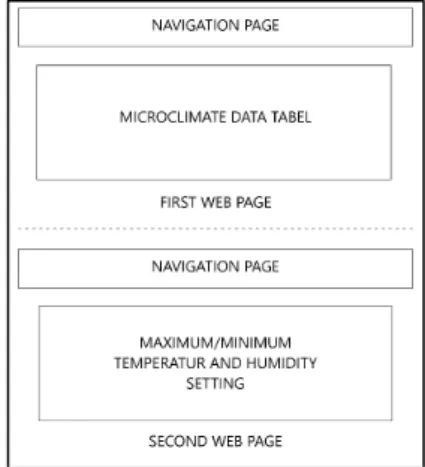
This stage is done as a refinement of tools that have been assembled in the previous stages so that the tool can be monitored and controlled through the website. The programming languages used are HTML, MySQL, and PHP. For this stage, the tool will be connected to the internet to obtain information gathered by the tool and displays it on the website. Tool settings can be done through the website. Website design is done first as a reference to visualize the appearance of the website when it has finished, and the following website layout design can be seen in Figure 5.
Figure 5. Website layout design
2.10. Testing phase
111 2.11. Results and conclusions
The test results will be analyzed and concluded whether the automatic microclimate controller can be used to monitor and control the microclimate climate through the website and reduce the temperature and increase the humidity of the greenhouse automatically.
3. RESULTS AND DISCUSSION
The results and discussion will be divided into 3 sub-chapters, namely the results of the programming of the Raspberry Pi, the results of the greenhouse microclimate website, and the analysis of microclimate conditions of the greenhouse to UV index, temperature, and RH.
3.1. Programming result of raspberry pi
Programming the automatic microclimate control device is done using the Python programming language, the microclimate control process is changing temperature and RH in the greenhouse by activating the misting cooling system pump which aims to reduce temperature and increase RH in the greenhouse and the process periodic monitoring every 1 minute of the microclimate in the greenhouse. Programming begins with taking the maximum temperature, and minimum RH data contained in the greenhouse website database, the purpose of this data collection is so that the tool knows the temperature limits and the RH, which activates the misting cooling system pump. The maximum temperature and RH of the minimum greenhouse in this study are 30 ℃ and 80%.
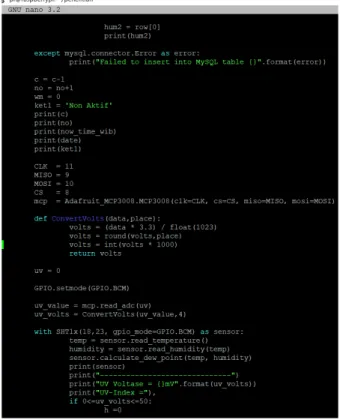
The pump ignition process uses AND logic, where the pump will start when the condition of the greenhouse temperature is above the maximum temperature (30 ℃), and RH is below the minimum RH (80%), if one of these conditions is not met then the pump will not light up. This programming also uses looping logic that is WHILE, where the results of reading the data by the SHT11 and GUVA-S12SD sensors will be displayed on the website every 1 minute in the form of a greenhouse microclimate table. In addition to this programming, the calculation of the duration of the misting pump cooling system is also calculated using a psychometric formula, following the Raspberry Pi programming snippet, which can be seen in Figure 6.
Figure 6. Python programming on raspberry pi
3.2. Website programming results
Website Based Greenhouse Microclimate Control Automation System Design
(Muhammad Hafiz1, Irfan Ardiansah2, Nurpilihan Bafdal3)
112
Figure 7. First-page display of the website
Figure 8. Second-page display of the website
3.3. Analysis of the greenhouse microclimate conditions
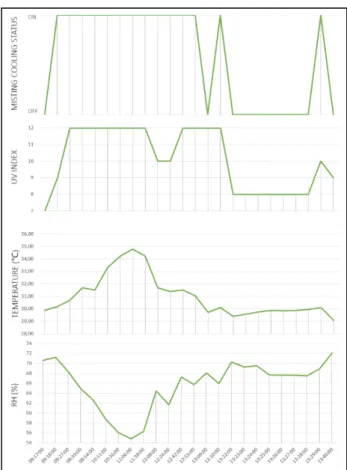
The data analyzed is when the micro-climate conditions of the greenhouse are not ideal or when the misting cooling system pump is working, this condition usually occurs at 09:00 - 14:00, with UV index conditions between 8-12. UV index, pump status, temperature, and RH data can be seen in Figure 9.
113 Figure 9 above shows the duration of the pump running longer than the duration of the pump not running, this is because the UV index conditions tend to be in the numbers 10-12, where the UV index conditions between 8-10 are very high, and UV index> 11 is included extreme category, so the sunlight in these conditions is very hot. The temperature and RH conditions on the graph also show that this automatic controller works correctly, where the misting cooling system pump only works when the temperature is above its maximum temperature of 30 ℃, and the RH is below the minimum RH of 80% which can be seen at 09:18 with temperatures and RH respectively 30.17 and 71.27%, at 13:22 the micro-climate conditions of the greenhouse began to stabilize with temperatures and RH respectively 29.38 ℃ and 70.28%, these conditions make the tool stop working because the use of AND logic in programming controls if one of the temperatures and RH enters in an ideal condition that is the temperature below the maximum temperature or RH above the minimum RH then the tool will stop working.
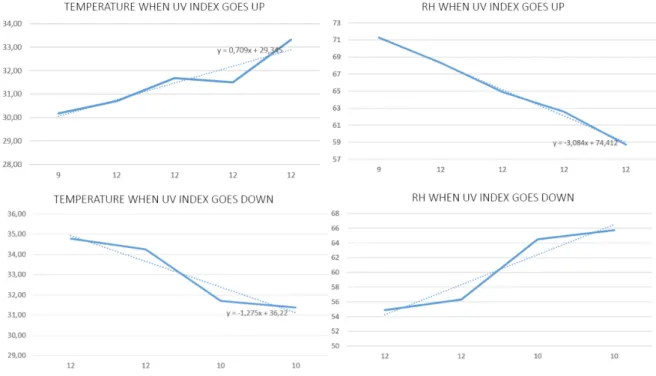
The graph in Figure 9 also shows that when the UV index tends to rise and stabilize at 12 then the temperature tends to rise and RH tends to decrease even though the microclimate control device is actively working which can be seen at 09:17 - 11:06, the greenhouse temperature is always up to 34.79 ℃ as well as RH which always drops to 54.85%, but when the UV index tends to fall from 12 microclimate controllers can lower the temperature and increase the RH it can be seen at 11:06 - 12:42, the temperature always goes down to reach 31.51 ℃ as well as RH which always goes up to reach 67.25% which means the temperature drops ± 3 ℃ and RH rises ± 12%. This condition can be seen more clearly in Figure 10 below.
Figure 10. Chart comparison of UV index against temperature and RH
This condition occurs due to the absence of paranet nets installed inside the greenhouse, so that very hot sunlight at UV index above 11 freely enters the glass without any retaining of the sun's rays and traps heat carried by sunlight into the greenhouse.
4. CONCLUSION
Based on the results of research that have been conducted on the greenhouse, greenhouse microclimate control devices can automatically trigger the misting pump of the cooling system when the temperature is greater than the maximum temperature (30 ℃), and RH is smaller than the minimum RH (80%). The website displays microclimate data in a table form, shows the setting for temperature and RH maximum/minimum, when UV index rise and stabilize at number 12 microclimate control devices cannot decrease temperature and increase RH but when UV index falls from number 12 temperature can be decreased by ± 3 ℃ and RH can be increased by ± 12%.
Website Based Greenhouse Microclimate Control Automation System Design
(Muhammad Hafiz1, Irfan Ardiansah2, Nurpilihan Bafdal3)
114 5. REFERENCES
[1] A. A. Al-Farzaq and Wildian, “Perancangan Sistem Kontrol Temperatur dan Kelembaban Tanah pada Rumah Kaca Berbasis Mikrokontroler Arduino Uno,” J. Fis. Unand, vol. 6, no. 2, pp. 113–118, 2017.
[2] Mu. Alahudin, “Kondisi Thermal Bangunan Greenhouse dan Screenhouse Pada Fakultas Pertanian Universitas Musamus Merauke,” J. Ilm. Mustek Anim Ha, vol. 2, no. 1, pp. 16–27, 2013.
[3] Agropedia, “Climatic and Temperature Requirement of Tomato,” http://agropedia.iitk.ac.in/content/climatic-and-temperature-requirement-tomato, 2019. [Online]. Available: http://agropedia.iitk.ac.in/content/climatic-and-temperature-requirement-tomato.
[4] Abd. Syakur, “Pendekatan Satuan Panas (Heat Unit) Untuk Penentuan Fase Pertumbuhan Dan Perkembangan Tanaman Tomat Di Dalam Rumah Tanaman (Greenhouse),” J. Agrol. 19, vol. 19, no. 2, pp. 96–101, 2012.
[5] B. D. Pearce, R. I. Grange, and K. Hardwick, “The growth of young tomato fruit. I. Effects of temperature and irradiance on fruit grown in controlled environments,” J. Hortic. Sci., vol. 68, no. 1, pp. 1–11, 1993, DOI: 10.1080/00221589.1993.11516322.
[6] Y. S. Defriyadi, “Pengendali Intensitas Cahaya, Suhu, dan Kelembapan pada Rumah Kaca dengan Metode PID,” in
Skripsi Fakultas Teknik Universitas Bengkulu, 2014.
[7] E. S. . Sumbayak et al., “Pedoman Teknis Pembuatan Stek Pucuk Ramin (Gonystylus bancanus (Miq.) Kurz.),” in
ITTO, 2014.
[8] RaspberryPi, “What is a Raspberry Pi?” https://www.raspberrypi.org/help/what-%20is-a-raspberry-pi/, 2019. [Online]. Available: https://www.raspberrypi.org/help/what- is-a-raspberry-pi/.
[9] I. Ardiansah and S. H. Putri, “Perbandingan Analisis SWOT Antara Platform Arduino UNO dan Raspberry Pi,” Pros. Semin. Nas. MIPA 2016, pp. 27–28, 2016.
[10] M. F. Trihandoko, “Penggunaan Sensor SHT11 sebagai Pendeteksi Suhu Ruang Inkubator Penetas Telur,” J. Tek. Elektro Dan Komput., no. 021, 2015.
[11] A. Prasetyo, “Pusat Pengontrol Lampu Pada Rumah Pintar Berbasis Raspberry Pi,” in Skripsi Universitas Sanata Dhrama, 2017.
[12] M. Saleh and M. Haryanti, “Rancang Bangun Sistem Keamanan Rumah Mengunakan Relay,” J. Teknol. Elektro, vol. 8, no. 3, pp. 181–186, 2017.
[13] W. K. Sugandi, T. Herwanto, and A. P. Yudi, “Rancang Bangun Mesin Pembersih dan Pengupas Kentang,”
Agrikultura, vol. 29, no. 2, p. 111, 2018, doi: 10.24198/agrikultura.v29i2.20850.
[14] R. Stull, “Wet-bulb temperature from relative humidity and air temperature,” J. Appl. Meteorol. Climatol., vol. 50, no. 11, pp. 2267–2269, 2011, DOI: 10.1175/JAMC-D-11-0143.1.
[15] ASHRAE Standard, ASHRAE Handbook 2001 Fundamentals, vol. 53, no. 9. 2001.