Oviedo University Press 110 Economics and Business Letters
6(4), 110-115, 2017
Credit and the housing boom in Malaysia:
A comeback?
Siti Nurazira Mohd Daud1* • Abd Halim Ahmad2 • Jan Podivinsky3
1Faculty of Economics and Muamalat, Universiti Sains Islam Malaysia, Negeri Sembilan, Malaysia 2College of Business, Universiti Utara Malaysia, Kedah, Malaysia
3Economics Division, University of Southampton, Southampton, United Kingdom
Received: 17 November 2017
Revised: 19 February 2018
Accepted: 5 March 2018
Abstract
This article investigates the existence of credit and housing booms in the Malaysian economy, with high levels of household indebtedness. The results reveal that both the credit boom and the housing boom exist and imply the fragility of the financial sector of the economy.
Keywords: credit booms; housing prices; household indebtedness; risk; fragility JEL Classification Codes: E44, E51, G20, G21
1. Introduction
Persistent house price hikes coupled with ease in credit access has elicited worries about a credit and housing boom in the world economy. Concerns have also been raised about the probability of a crisis erupting at a higher cost point (Jorda et al., 2011)1. If crisis is a catalyst for change, then the 2008 sub-prime crisis that drowned the United States and dragged other economies around the world into an economic recession has led to significant change. This change involves escalating interest in monitoring the risk of household indebtedness. Rising house prices are inextricably associated with faster credit and higher leverage and, thus, connect at least four topics: the credit boom, the housing boom, household financial fragility, and the probability of a crisis.
Credit works as a lubricant that enables consumption-smoothing for economic activities (Ando and Modigliani, 1963), while stable macroeconomic conditions, demographic structure, and asset price hikes contribute to an increase in household indebtedness (Kim, 2016). Zooming in on financial factors that accelerate high growth in debt, the extant literature on the effect of financial development on economic growth is skewed toward a positive effect (Levine et al.,
* Corresponding author. E-mail: nurazira@usim.edu.my.
Citation: Mohd Daud, S. N., Ahmad, A. H., and Podivinsky, J. (2017) Credit and the housing boom in Malaysia: A comeback?, Economics and Business Letters, 6(4), 110-115.
2000). However, Mishra and Narayan (2015) and Law and Singh (2014) suggest that an optimal
level of financial development exists and conclude that more such development is not necessarily good for the economy.
Despite its positive effect on growth, the rapid buildup of leverage may be a key symptom of the twentieth century financial crisis in emerging and advanced economies (Gourinchas and Obstfeld, 2011; Buyukkarabacak and Valev, 2010). Policy concerns in the credit-fueled housing price growth environment are centered on the availability of credit in the economy— either more or less credit supply or the high or low probability of a crisis erupting. This significantly contributes to policymakers’ conundrum.
Recent developments show that Malaysia (as an emerging economy) is now listed by the Bank of International Settlements (BIS) as one of the top 15 countries with the highest household debt; others on the list include developed economies such as Canada, the United States, the United Kingdom, Australia, and Singapore. These economies have been increasing their household debt to record-high levels, highlighting the urgency to further investigate the associated risk of high household debt. Consequently, this paper aims to examine the existence of a credit and/or housing boom in the Malaysian economy along with a lead–lag relationship between the credit market and the housing market.
However, defining a credit boom is difficult because a variety of smoothing filters and approaches can be used to measure the deviation, threshold, real-nominal growth, and absolute-relative value of a gap when trying to identify boom episodes. In general, a boom period is associated with an abnormal and persistent increase in credit level or housing price based on historical behavior. Some might define an abnormal increase as being when the real growth rate of credit or house prices is between 5 percent and 15 percent.
Thus, the primary contribution of this paper is to add value to the literature on crisis predictions as early-warning systems. Section 2 explains the methods and data used in the analysis. Section 3 presents the results. The final remarks are presented in Section 4.
2. Methods
With the notion of measuring abnormal deviations of credit and house price growth through their own movement, this paper decomposes the trends and cycles. Two definitions of boom positions are employed. Boom 1 is detected when the cyclical components exceed 1.5 times the standard deviation of the cyclical components. Cyclical components is extracted using the HP filter with a smooting parameter of 400,000. Boom 2 has set criteria where the deviation in the credit-to-gross domestic product (GDP) and house price gap exceeds two percentage points. The credit-to-GDP gap (or house price index) is calculated as the percentage point difference between the credit-to-GDP ratio (or house price index) and its long-term trend where the trend is based on a two-sided HP filter with a smoothing parameter of 400,0002. In its general form, each variable can be decomposed into unobserved components as:
𝐶𝑟𝑒𝑑𝑖𝑡_𝑡𝑜_𝐺𝐷𝑃𝑡 = 𝛼0+ 𝛼1𝑡𝑟𝑒𝑛𝑑𝑡+ 𝛼2𝑐𝑦𝑐𝑙𝑒𝑡+ 𝜀𝑡 (1)
𝐻𝑜𝑢𝑠𝑒𝑝𝑟𝑖𝑐𝑒𝑡 = 𝛼0+ 𝛼1𝑡𝑟𝑒𝑛𝑑𝑡+ 𝛼2𝑐𝑦𝑐𝑙𝑒𝑡+ 𝜀𝑡 (2)
Boom 1 for credit and housing price growth can be defined as:
𝐵𝑜𝑜𝑚1𝑐𝑟𝑒𝑑𝑖𝑡𝑡 = {1 𝑖𝑓 𝑐𝑦𝑐𝑙𝑒𝑡 > 1.5 ∗ 𝜎𝑐𝑦𝑐𝑙𝑒
0, 𝑜𝑡ℎ𝑒𝑟𝑤𝑖𝑠𝑒 (3)
𝐵𝑜𝑜𝑚1ℎ𝑜𝑢𝑠𝑒𝑡 = {1 𝑖𝑓 𝑐𝑦𝑐𝑙𝑒𝑡 > 1.5 ∗ 𝜎𝑐𝑦𝑐𝑙𝑒
0, 𝑜𝑡ℎ𝑒𝑟𝑤𝑖𝑠𝑒 (4)
where 𝜎𝑐𝑦𝑐𝑙𝑒 is the standard deviation of the cycle movement. Boom 2 for credit and housing price growth can be defined as:
𝐵𝑜𝑜𝑚2𝑐𝑟𝑒𝑑𝑖𝑡𝑡 = {
1 𝑖𝑓 𝑐𝑟𝑒𝑑𝑖𝑡_𝑡𝑜_𝐺𝐷𝑃𝑔𝑎𝑝𝑠𝑡 > 2
0, 𝑜𝑡ℎ𝑒𝑟𝑤𝑖𝑠𝑒 (5)
𝐵𝑜𝑜𝑚2ℎ𝑜𝑢𝑠𝑒𝑡 = {
1 𝑖𝑓 ℎ𝑜𝑢𝑠𝑒𝑝𝑟𝑖𝑐𝑒_ 𝑔𝑎𝑝𝑠𝑡> 2
0, 𝑜𝑡ℎ𝑒𝑟𝑤𝑖𝑠𝑒 (6)
We also consider the lead–lag relationship between the housing and credit booms by employing a Granger causality analysis. The Granger analysis tests the null hypothesis that credit growth does not cause housing price growth and the null hypothesis that housing price growth does not cause credit growth. This will be tested for up to four lag lengths.
3. Data
Quarterly series data for 1988Q1 through 2016Q4 are gathered from the BIS. The total amount of credit in the private sector, as a percentage of the GDP and the credit-to-GDP gaps, represents the movement of credit. The Malaysian house price index (HPI) and house prices gap signify the house price behavior3.
4. Empirical results
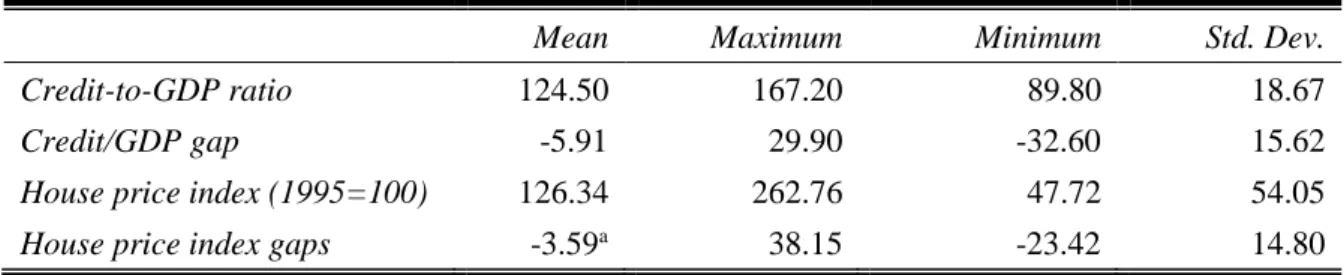
Table 1 reports the descriptive statistics using the entire data sample. A variation in the credit-to-GDP and HPI gap for Malaysia exists, ranging from -32.60 (2008Q1) to 29.90 (in 1997Q3) percentage points and -23.42 to 38.15, respectively. The large gaps indicate a wider divergence from the normal credit trend. The credit-to-GDP ratio shows a mean of 124.50. The mean of Malaysia’s HPI is 126.34. The maximum value is 262.76, achieved in 2016Q3.
Table 1. Descriptive statistics.
Mean Maximum Minimum Std. Dev.
Credit-to-GDP ratio 124.50 167.20 89.80 18.67
Credit/GDP gap -5.91 29.90 -32.60 15.62
House price index (1995=100) 126.34 262.76 47.72 54.05
House price index gaps -3.59a 38.15 -23.42 14.80
Note: a Refer to -3.59 x 10⁻¹⁰.
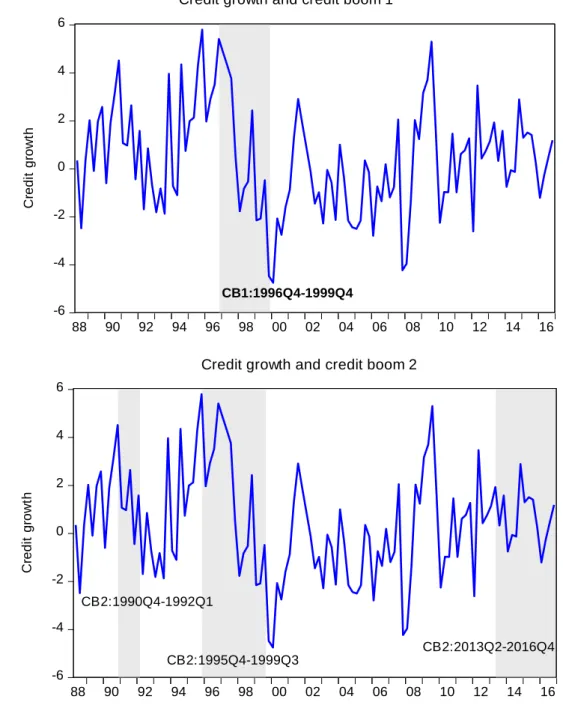
Figure 1 plots the credit growth and the housing growth. The shaded area denotes the credit boom and housing boom periods, according to the definitions in Eq.3 through Eq.6. Panel A plots the credit boom from when the credit growth reached its peak in 1995Q44. Credit Boom 1 (deviation of its cycle) is identified at one quarter after the credit growth peak. Credit Boom 2 (deviation from its trend) is identified simultaneously with the credit peak position5. The time
3 We follow the same procedure as BIS to derive the house price gap variable.
4 We also perform the same procedure by using total credit in the private sector from the banking sector, and the results so not differ materially.
periods of 1990Q4 to 1992Q1 and 2013Q2 to 2016Q4 are also identified as Credit Boom 2.
Intuitively, the credit-to-GDP gap, exceeding two percentage points, highlights the need for banks to start building a capital buffer to shelter future credit losses between 0 percent and 2.5 percent of the risk-weighted assets (RWAs).
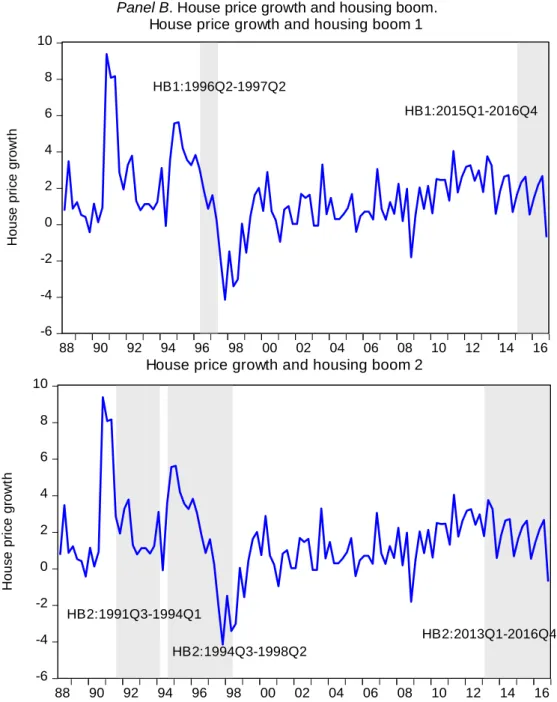
Panel B shows that house price growth and the housing boom do not vary significantly across definitions. This is the case when the growth in price reaches its peak during Housing Boom 2: 1991Q3 to 1994Q1, 1994Q3 to 1998Q2, and 2013Q1 to 2016Q4. Both definitions illustrate that the Malaysian economy is experiencing a housing boom. While close monitoring of monetary policy may help in curbing the risk, it is important to note that not every bubble ends in a recession.
Figure 1. Credit and housing booms.
Panel A. Credit growth and credit boom.
-6 -4 -2 0 2 4 6
88 90 92 94 96 98 00 02 04 06 08 10 12 14 16
CB1:1996Q4-1999Q4
C
re
d
it
g
ro
w
th
Credit growth and credit boom 1
-6 -4 -2 0 2 4 6
88 90 92 94 96 98 00 02 04 06 08 10 12 14 16
C
re
d
it
g
ro
w
th
CB2:1990Q4-1992Q1
CB2:1995Q4-1999Q3
CB2:2013Q2-2016Q4 Credit growth and credit boom 2
Panel B. House price growth and housing boom.
-6 -4 -2 0 2 4 6 8 10
88 90 92 94 96 98 00 02 04 06 08 10 12 14 16
H
o
u
s
e
p
ri
c
e
g
ro
w
th
HB1:1996Q2-1997Q2
HB1:2015Q1-2016Q4 House price growth and housing boom 1
-6 -4 -2 0 2 4 6 8 10
88 90 92 94 96 98 00 02 04 06 08 10 12 14 16
H
o
u
s
e
p
ri
c
e
g
ro
w
th
HB2:1991Q3-1994Q1
HB2:1994Q3-1998Q2
HB2:2013Q1-2016Q4 House price growth and housing boom 2
The credit boom might affect the economy by spreading into the housing market and creating a speculative bubble. We identify a series of “twin-booms” for both definitions, which is when the credit and housing booms take place simultaneously. The first twin-boom point can be associated with the Asian 1997 financial crisis that heavily affected the Malaysian economy. The results also indicate that another twin-boom started in 2013Q2 and continued through 2016Q4. These data imply a warning sign for the Malaysian economy.
Table 2. Causality between credit and house prices.
Lag Credit does not Granger cause the house price House price does not Granger cause the credit
1 23.03[0.00]** 0.55[0.46]
2 4.19[0.02]** 0.22[0.80]
3 2.28[0.08]* 1.01[0.39]
4 1.47[0.21] 0.79[0.53]
Table 2 shows that credit leverage leads the housing markets in Malaysia, which may mean
that easy access to credit is the central factor fueling the boom in house prices. The current position of the credit and housing booms in the economy indicates an early sign of financial fragility for the Malaysian economy, since the housing bubble burst is fueled by excessive credit growth.
5. Concluding remarks
In our analysis, we find signs of excessiveness. The credit and housing boom positions are detected in the current economic status, which is experiencing a twin-boom. Such findings highlight an early warning signal and the building of systematic risk toward financial instability. As Malaysia’s housing cycle is leverage-driven, the risk is that since the domestic demand and real estate cycles are interrelated they are highly leveraged. Thus, a housing correction could trigger a negative income effect that might exacerbate a downturn in consumption. General credit-targeted policies, housing credit-targeted policies on financial deregulation, and interest rate policies targeted within the policy options are recommended before it is too late and too costly to deflate the crisis.
Acknowledgments
This research was funded by a University Sains Islam Malaysia Research Grant (PPP-FEM-13615-00G00/10).
References
Ando, A. and Modigliani, F. (1963) The “life cycle" hypothesis of saving: Aggregate implications and tests, American Economic Review, 53(1), 55-84.
Borio, C. and Lowe, P. (2002) Assessing the risk of banking crises, BIS Quarterly Review, 43-54.
Buyukkarabacak, B. and Valev, N.T. (2010) The role of household and business credit in banking crises, Journal of Banking and Finance, 34(6), 1247-1256.
Drehman, M., Borio, C. and Tsatsaronis, K. (2011) Anchoring countercyclical capital buffers: The role of credit aggregates, BIS Working Papers No. 355. Basel, Switzerland. Gourinchas P. and Obstfeld, M. (2011) Stories of the twentieth century for the twenty-first,
NBER Working Paper No. 17252. Cambridge, MA.
Hansen, B.H. (2000) Sample splitting and threshold estimation, Econometrica, 68(3), 575-603. Jorda, O., Scularick, M. and Taylor, A.M. (2011) Financial crises, credit booms and external
imbalances: 140 years of lessons, IMF Economic Review, 59(2), 340-378.
Kim, Y.K. (2016) Macroeconomic effects of household debt: An empirical analysis, Review of Keynesian Economics, 4(2), 127-150.
Law, S.H. and Singh, N. (2014) Does too much finance harm economic growth? Journal of Banking and Finance, 41, 36-44.
Levine, R., Loayza, N. and Beck, T. (2000) Financial intermediation and growth: Causality and causes, Journal of Monetary Economics, 46(1), 31-77.
Mendoza, E.G. and Terrones, M.E. (2008) An anatomy of credit booms: Evidence from macro aggregates and micro data, NBER Working Paper No. 14049, Cambridge, MA. Mishra, S. and Narayan, P.K. (2015) A nonparametric model of financial system and economic
growth, International Review of Economics and Finance, 39, 175-191.