113
TOURIST PREFERENCES AND SATISFACTION IN KARANGASEM VIRGIN BEACH, BALI
I Gede Eka Arsana, Agung Permana Budi, dan Ni Made Ayu Sulasmini. Sekolah Tinggi Pariwisata Bali International.
ABSTRACT
The development of Virgin Beach which has not been maximized has caused many complaints from tourists, both aspects of completeness of facilities, accessibility. Tourist preferences and satisfaction are important factors in developing Virgin Beach to make it better in the future. This study aims to find out the preferences and satisfaction of tourists in Virgin Beach, Karangasem, Bali. This type of research is descriptive quantitative, the number of samples of 40 visiting tourists taken using incidental sampling techniques. Questionnaires that are distributed using a Likert scale have been tested for validity and reliability. Data were analyzed through descriptive statistics with the assessment categorization method based on the average score and IPA (importance performance analysis) with a method of looking for gaps between expectations and performance. The results of this study conclude that tourist preferences in Virgin Beach are good, have an average value of 3.6 in the interval of 3,5 - 4,2. While tourist satisfaction shows from 5 variables, namely: reliability, responsiveness, assurance, empathy and tangible evidence, only responsiveness and assurance variables that have performance in accordance with tourist expectations and are able to satisfy tourists while physical evidence and reliability variables have lower performance from the expectations of tourists so that they have not been able to support the satisfaction of tourists on Virgin Beach and the empathy variable is not too expected by tourists to support their satisfaction at Virgin Beach. And it is necessary to develop from the aspect of tourist facilities, and improve service performance.
Keywords: Preference, Satisfaction, IPA (Importance-Performance Analysis
BACKGROUND
114
facilities such as restaurants. The types of activities that tourists can do such as swimming, snorkeling, and also relaxing while enjoying beautiful sea views. From the beauty and tourist attractions offered, Virgin Beach is an attraction that is quite attractive to tourists. The decrease in the level of visits to Virgin Beach was caused by the lack of maximum fulfillment of tourist accommodation. This can be indicated from the number of foreign tourists who ask about the availability of tourist accommodation in the form of lodging or villas around the beach. In addition to the availability of accommodation in the form of lodging or villa. Seeing this phenomenon, it can be seen that the manager needs to develop by analyzing the preferences and satisfaction of tourists, especially tourists visiting the attraction of Virgin Beach. So that the development carried out does not become futile and can be implemented properly. This research was conducted to determine tourist preferences and satisfaction in the tourist attraction of Virgin Beach. Based on these background issues, the formulation of the problem in this study is: What are the preferences and satisfaction of tourists in Virgin Beach, Karangasem Regency, Bali. And the purpose of this study is to find out the preferences and satisfaction of tourists in Virgin Beach, Karangasem Regency, Bali.
THEORETICAL ANALYSIS Preferences
According to (Nursusanti, 2010 in Yusran Pauwah et.al 2013) tourist preferences arise from the desires and needs of tourists who travel on tourism products offered. The desire and needs of tourists for tourism products are increasingly complex, dynamic and demand adequate quality and are associated with sustainable development. The consequence is that a tourist destination must be able to adapt to all the demands of change by listening to the voices of various interested parties, especially tourists who have different perceptions and preferences in choosing tourism objects to be visited.
Quality Of Service
According to Fandy Tjiptono (2012) defining service quality is a measure of how well the level of service provided is able to match customer expectations. Another definition of service quality according to Wyckoff in Lovelock in Fandy Tjiptono (2012) is the expected level of excellence and control over these advantages to meet customer desires. Tasunar in Hardiyati (2010) states that service quality refers to customer judgments about the core of service, namely the service provider itself or the entire service organization, customers now begin to show demands for excellent service, they are no longer just needing quality products but they are more happy to enjoy the convenience of service.
Satisfaction
115
satisfied. Czepiel et.al, in Arimbawa (2015) states that customer satisfaction with satisfaction consists of two independent elements. for example in the restaurant business there are functional elements in the form of food and beverages, as well as elements of performance delivery in the form of service or service.
In previous research Dwiputra (2016) which explained about "Tourist Preferences Against Tourism Facilities in the Merapi Eruption Nature Tourism Area". The research aims to find out about how tourists' preferences can be found in tourism facilities in the Merapi Eruption Nature Tourism Area. In the discussion, it can be seen that tourist preferences in choosing tourist facilities are strongly influenced by the destinations of tourist tourists, long tourists traveled and friends of tourists in traveling. The equation of this study with the research conducted by Dwi Putra is to examine the variables of tourist preferences. The second previous study was a study conducted by Ong (2014) which explained about "Customer satisfaction analysis with important performance analysis at SBU Laboratory Cibitung PT Sucofindo (Persero)" this research discussed customer satisfaction. Where based on the calculation of customer satisfaction scores with the variables studied, namely reliability, responsiveness, assurance, empathy, tangible, product quality, and price using the analysis of important performance analysis, it can be seen that there are three best items, employees are neat and professional, Building Facility is neat / clean, and employees serve well and with important performance analysis, 13 (thirteen) things can be identified in the future. The equation of this study is that both examine tourist satisfaction using analytical techniques using Important Performance Analysis while the differences in this study are the number of variables that carefully examined the previous research only variable customer satisfaction while this study uses variable tourist preferences and tourist satisfaction. The third previous study was research conducted by Pauwah, (2013) on "visitors 'perceptions and preferences towards the Melalayang Beach tourist area" where Pauwah discussed how visitors' perceptions and preferences towards the tourist area of Melalayang Beach. The study uses tabulation techniques by giving a score on the number of criteria that are aspects of the study. In the discussion of the study it can be seen that the perception of visitors with a weighting average of 3.28 is in the aspect of tourist attraction with good sub-aspects, with an average weight of 3.75 is a natural landscape. Natural scenery in Melalayang tourist attraction is different from other places on the coast of the city of Manado. Visitors' preference for the Melalayang beach tourist area with the largest weight average or 4.36 is a sub-aspect of food stalls in Malalayang Beach tourist attraction.
RESEARCH METHODS
116
1, 2018 to July 2018. The population in this study were tourists visiting Virgin Beach. In this study using 40 samples with sampling techniques using incidental sampling techniques. With the technique of collecting data using questionnaires and documentation. In this study using technical data analysis, namely Descriptive Statistics The average calculation is done by summing all tourist preference data values (X), then divided by the number of samples. If a group of samples is random with the number of samples n, then it can be calculated.
Information :
Xi = sample value (tourist preference) N = number of samples
IPA (Importance Performance Analysis) According to Rangkuti (2002), IPA (Importance Performance Analysis) is a method used to analyze visitor expectation. The data uses a Likert scale as a size scale indicator for interests according to the visitor's perception and the level of implementation or real performance of a product. Likert scale data are given a quantitative score to be used in calculations. Based on the assessment of the level of importance and level of performance a calculation will be made on the level of importance and level of performance which is then illustrated in a Cartesian diagram. The level of importance and performance contained in the Cartesian diagram is in the form of scores of importance and total performance.
Each attribute is positioned in a diagram. The total score assessment of the level of performance (performance) shows the position of attributes on the X axis, while the position of attributes on the Y axis is indicated by the total score of importance on the attribute.
The Cartesian diagram is a building that is divided into four parts which are limited by two lines mutually perpendicular to the point (A, B) A is the average of the total score of performance level (performance) and B is the average of the total score of importance (importance ) Values A and B are measured using the formula:
𝐴 = 𝛴𝑋 𝑘 𝐵 =
𝛴𝑌 𝑘
Information:
117 Importance
High
Low Performance High
High Leverage
Quadrant I Main Priority
Quadrant II Maintain Achievement
Quadrant III Low Priority
Low Leverage
Quadrant IV Excessive
a) Quadrant I (Top Priority)
In this quadrant there are factors that are considered important and / or expected by consumers but their performance is considered not satisfactory so the company needs to concentrate on allocating its resources to improve the performance that goes into this quadrant.
b) Quadrant II (Maintain Achievement)
In this quadrant there are factors that are considered important and expected as supporting factors for customer satisfaction so companies are required to maintain these performance achievements.
c) Quadrant III (Low Priority)
In this quadrant there are factors that are considered to have a level of perception or actual performance that is low and not too important and or not too expected by consumers so the company does not need to prioritize or pay more attention to these factors
d) Quadrant IV (Excessive)
In this quadrant there are factors that are considered not too important and not too expected by the customer so that the company is better allocated resources related to these factors to other factors that have a higher priority level.
RESULT AND DISCUSSION Traveler preferences
The results of the study show that preference indicators include:
118
3.5 - 4.2 with good criteria. Virgin Beach has a clean, clean environment. Entering the beach will be treated to a view of the hills to the west and east of the beach and a clean beach, and comfortable for swimming tourists. In addition Virgin Beach also provides a place for tourists who want to relax and enjoy the beauty of nature in Virgin Beach.
2) Services in Virgin Beach tourist attraction have good value based on tourist preferences, this is because services in Virgin Beach tourist attraction have an average value of 3.9 from the interval score of 3.5 - 4.2 with good criteria. this is caused by service to tourists in Virgin Beach satisfying and in accordance with the expectations of visiting tourists.
3) Accessibility in Virgin Beach tourist attraction based on tourist preferences is quite good, because it has an average value of 3.2 from the interval score of 2.7 to 3.4 with quite good criteria. This is caused by the distance from Denpasar, which is about 1 hour 20 minutes to reach the beach and the manager has not been able to build road access to the beach, although there are already asphalt roads that can be used by motorbikes and cars, only arrive at parking lot. From parking to the beach, tourists still have to walk as far as ± 200 meters to get to the beach.
4) Tourism facilities in the tourist attraction of Virgin Beach have a fairly good value from tourist preferences, because it has an average value of 2.7 from the interval score of 2.7 to 3.4 with quite good criteria. This is because there are many restaurants around the beach that provide food and drink for tourists. Most restaurants are managed by the local community of Perasi Village, but it is a pity, restaurants on Virgin Beach are still having difficulties in providing clean water for tourists who want to take a bath or rinse their bodies after swimming on the beach. The unavailability of public toilet facilities in Virgin Beach makes tourists have to use the toilet in the restaurant in Virgin Beach. besides that tourists are still having difficulty accessing the internet network in the tourist attraction of Virgin Beach. 5) The atmosphere in Virgin Beach's tourist attraction is based on good tourist
preferences, because it has an average value of 4.2 from the interval score of 3.5 - 4.2 with good criteria. Virgin Beach is indeed famous for its interesting atmosphere, because this beach is located between two green hills, white sand and a clean beach that makes the atmosphere in Virgin Beach favored by many local and foreign tourists.
6) The ability of employees in Virgin Beach tourist attraction based on tourist preferences is good because it has an average value of 3.7 from the interval score of 3.5 - 4.2 with good criteria. This is because, employees in the Virgin Beach tourist attraction are able to serve tourists visiting the tourist attractions of Virgin Beach. In addition, restaurant employees / employees in Virgin Beach have a high sense of responsibility towards endless tourists. Nearly some employees in Virgin Beach's tourist attraction master foreign languages, especially English, which makes it easier for tourists to communicate with restaurant employees in the tourist attraction of Virgin Beach.
119 1
2
4
5 2
3
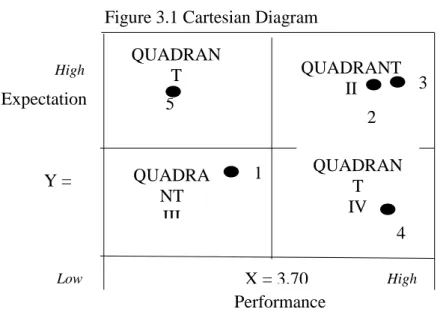
indicators of comfort, service, accessibility, facilities, an attractive atmosphere and the ability of employees
Figure 3.1 Cartesian Diagram
Information 1 = Reliability 2 = Responsiveness 3 = Assurance 4 = Empathy 5 = Tangible
Based on the results of the Importance Performance Analysis, it shows that the Cartesian diagram of the IPA (Importance Performance Analysis) variable occupies different quadrants such as:
Quadrant I (top priority) is filled by tangible variables which according to the rating of tourists this variable is considered important, and expected by tourists, but its performance is not satisfactory, it is necessary to increase the performance of physical evidence variables such as facilities, cleanliness of facilities and also the appearance of employees in the restaurant in Virgin Beach's tourist attraction. Quadrant II (maintain performance) is filled with responsiveness and assurance that is what according to the rating of tourists this variable is considered important and can support tourist satisfaction while in the tourist attraction of Virgin Beach, so the tourist attraction of Virgin Beach need to maintain the performance of the responsiveness and assurance.
Quadrant III (low priority) is filled by reliability variables which are based on variable traveler rating in this quadrant that has low performance, and is not too expected by tourists so companies such as restaurants in Virgin Beach tourist attraction need to pay more attention to reliability ( reliability) employees who work in restaurants.
Quadrant IV (excessive) is filled by the variable empathy (empathy) where based on rating of tourists this variable is not too expected so companies such as
Expectation
Low High
X = 3,70 Y =
3,98
QUADRAN T
I
QUADRAN T IV QUADRA
NT III
QUADRANT II
120
restaurants in Virgin Beach tourist attraction are better prioritizing variables that have high priority, in order to meet tourist satisfaction while in power Virgin Beach tourist attraction.
CONCLUSION
Based on the results of the study show that the conclusions:
1. The preference of tourists visiting the tourist attractions of Virgin Beach as follows:
a. Travelers have a good preference for comfort, service, employee ability and atmosphere in Virgin tourist attraction, which is in the interval of 3,5 - 4,2 with good criteria.
b. Travelers have a pretty good preference for accessibility and facilities, namely in the interval 2.7 to 3.4 with quite good criteria.
c. Overall, tourist preferences in Virgin Beach's tourist attraction are good, because it has a value of 3.8 with good criteria and has been according to the wishes of tourists.
2. Tourist Satisfaction in Virgin Beach
Based on the results of the study show the conclusion that tourist satisfaction as measured by indicators: reliability, responsiveness, assurance, empathy and tangible evidence on Virgin Beach are as follows:
a. Quadrant I (top priority) that is the indicator that is the top priority is tangible evidence which states that this indicator is a top priority and is highly expected by tourists to meet tourist satisfaction but in reality the performance of tangible indicators cannot meet tourist expectations while in Virgin Beach.
b. Quadrant II (Maintain Achievement) is an indicator that needs to maintain achievement is responsiveness and assurance where tourists are satisfied with this indicator because it is in accordance with the expectations of tourists while in Virgin Beach. Therefore the achievements of these indicators need to be maintained so that they are still able to provide satisfaction to tourists.
c. Quadrant III (Low Priority) is an indicator that gets low priority from tourists is reliability (reliability) where the indicator is not too expected by tourists and its performance is not too high. So it is necessary to increase the performance of this indicator so that this indicator is able to become a top priority and give satisfaction to tourists in Virgin Beach.
d. Quadrant IV (Excessive) which is an indicator that is considered excessive by tourists is empathy (empathy) where this indicator is not expected by tourists to meet tourist satisfaction while in Virgin Beach. So that Virgin Beach is expected to further improve the performance of priority indicators for tourists to fulfill their satisfaction while in Virgin Beach.
SUGGESTION
121
1. Accessibility aspects in the tourist attraction of Virgin Beach.
a. Improve access from parking to a rocky beach so that tourists are safer and more comfortable when passing the road.
2. Facility aspect in the tourist attraction of Virgin Beach.
a. There is a need for additional public toilets for tourists in the tourist attraction of Virgin Beach.
b. There needs to be an additional source of clean water in the tourist attraction of Virgin Beach to meet the needs of clean water for tourists who visit.
c. Improve telecommunications networks so that all network providers can access the internet while on Virgin Beach.
d. Adding complete recreational facilities so that tourists feel at home in Virgin Beach.
3. Aspects of Tourist Satisfaction
a. Improving the performance of tangible evidence in terms of the completeness of tourist facilities, cleanliness of tourist facilities and cleanliness of employees at Virgin Beach, given the tourists' expectations of tangible evidence to fulfill their satisfaction when visiting Virgin Beach.
b. Improve the performance of employees when serving tourists, in order to be able to provide services in accordance with the expectations of tourists.
REFERENCE
Ariesta. I Kadek Bayu. (2016). Pengaruh Kualitas Pelayanan Terhadap Kepuasan Tamu di U Paasha Hotel. Skripsi. Denpasar. STPBI.
Dwiputra, Roby. 2013. Preferensi Wisatawan Terhadap Sarana Wisata di Kawasan Wisata Alam Erupsi Merapi. Jurnal Perencanaan Wilayah dan Kota, Vol 24 No 1. Badan Perencanaan dan Pembangunan (Bappenas). Jakarta. http://www.sappk.itb.ac.id/jpwk/wp-content/uploads/2014/02/Jurnal-3-Roby-Edit.pdf (diakses pada 20 Maret 2018)
Ghozali, imam. 2011. Aplikasi Analisis Multivariate dengan Program SPSS. Semarang. Badan Penerbit Universitas Diponogoro.
Hadiwijoyo, Akyas.2012. Psikologi Umun dan Perkembangan. Jakarta: PT Mizan Publika
Handayani, B dan Korstanje, M.E. Place Brand Authenticity in Social Media Interaction: a Postmodern Perspective. Etudes Caribeennes, pp. 37 -38 Handayani, B., & Rashid, B (2013). Conseptualisation of nation brand image.
International Journal Of Manajement Studies (IJMS),20(2,165-183).
Hardiyati, Ratih. 2010. Analisis Pengaruh Kualitas Pelayanan Terhadap Kepuasan Konsumen Menggunakan Jasa Penginapan (Villa) Agrowisata Kebun Teh Pagilaran. Skripsi. Semarang. Universitas Diponogoro.
Hermantoro H. 2013. Tentang Kepariwisataan Kumpulan Tulisanku Seputar Kepariwisataan Nasional. Depok : Aditri.
122
Kautsar, Cindy Rosselina. 2012. Analisis Preferensi Konsumen Yoghurt My Healthy di Dramaga Bogor. Skripsi. Bogor. Departemen Manajemen Fakultas Ekonomi dan Manajemen Institute Pertanian Bogor.
Kotler, Philip and Gary Armstrong. 2008. Prinsip-prinsip Pemasaran. Edisi 12. Jilid 1. Jakarta: Erlangga.
Kusumah, Wijaya dan Dedi Dwitagama. 2011. Mengenal Penelitian Tindakan Kelas. Edisi : 2. Jakarta : PT Indeks.
Moenir, A.S. 2010. Manajemen Pelayanan Umum Di Indonesia. Jakarta : Bumi. Aksara
Nila Sari, Candra dan Reiza Miftah Wirakusuma. 2016. Pengembangan Fasilitas Wisata Berdasarkan Preferensi Pengunjung di Wana Wisata Situ Cisanti Kabupaten Bandung. Jurnal Manajemen Resort and Leisure Vol. 13 No 2.
Universitas Pendidikan Indonesia
http://ejournal.upi.edu/index.php/jurel/article/view/4977 (diakses pada 20 maret 2018)
Nugroho, Ryan. dan Japarianto, Edwin. 2013. Pengaruh People, Psycal Evidence, Product, Promotion, Price dan Place Terhadap Tinggakt Kunjungan di Kafe Coffee Cozies Surabaya. Jurnal Manajemen Pemasaran Petra. Vol 1, No. 2: 1-9.
Ong, Johan Oscar dan Pambudi, Jati. 2014. Analisis Kepuasan Pelanggan dengan Importance Performance Analysis di SBU Laboratory PT Sucofindo (PARSERO). Jurnal Jati Undip. Vol IX No.1. President University
Pauwah, Yusran. et.al. 2013. Persepsi dan Preferensi Pengunjung Terhadap Kawasan Wisata Pantai Malalayang.Jurnal Vol 5 No.1. Universitas Sam Ratulangi.
Pintana, I. Gede dan Diarta Surya. 2009. Pengantar Ilmu Pariwisata. Yogyakarta: Andi Offset.
Pantiyasa, 2013. Metodelogi Penelitian. Denpasar. Sekolah Tinggi Pariwisata Bali Internasional.
Ramly, Jhon. 2007. Educational Psychology Edisi Kesepuluh Bagian Kedua. Yogyakarta: Pustaka Belajar.
Rangkuti, F. 2002. Measuring Customer Satisfaction: Gaining Customer Relationship Strategy. Jakarta : Gramedia Pustaka Utama.
Robbins SP, dan Judge. 2008. Perilaku Organisasi. Jakarta : Salemba. Satwiko, Prasasto. 2009. Fisika Bangunan.Yogyakarta. Andy Offset.
Siregar, Syofian. 2013. Metode Penelitian Kuantitatif. Jakarta: Prenadamedia Group.
Sheth, J., N. dan Sisodia, R., S. (2012). The 4A’s of Marketing. Creating Value for Customers, Companies and Society. New York. Routledge
Sugiyono. 2014. Metode Penelitian Manajemen.Bandung : CV. Alfabeta.
Sugiyono. 2017. Metode Penelitian Pendidikan (Pendekatan Kuantitatif, Kualitatif dan R&D). Bandung : CV. Alfabeta.
Suryadana, M. Liga dan Vanny Octavia. 2015. Pengantar Pemasaran Pariwisata. Bandung : CV Alfabeta.
Suwantoro, Gamal. 2004. Dasar-Dasar Pariwisata. Edisi Kedua. Yogysaakarta : AndiOffset.
123
TripAdvisorhttps://www.tripadvisor.co.id/Attraction_Review-g608484-d1638643-Review-White_Sand_Beach-Karangasem_Bali.html (diakses pada 8 april 2018)
Wardiyanta, Drs. 2010. Metode Penelitian Pariwisata. Yogyakarta: CV Andi Offset.
Yunita, Evi. 2016. Analisis Faktor Yang Mempengaruhi Preferensi Konsumen (Kasus Ozaizy Coffee N’ Resto Kota Bogor. Skripsi. Departemen Agrobisnis Fakultas Ekonomi dan Manajemen Institut Pertanian Bogor.
Zeithaml, Valarie A., And Mary Jo Bitner. (2000). Service Marketing: Integrating Customer Focus Across The Firm, Second Edition. New York, NJ: Mc Graw-Hill Companies Inc.