i>^Ä
UNITED STATES AIR FORCE
IERA
JP-8 Volatility Study
Southwest Research Institute 6220 Culebra Road San Antonio, TX 78238
March 2001
20010921 087
Approved for public release;distribution is unlimited.
Air Force Institute for Environment, Safety and Occupational Health Risk Analysis Risk Analysis Directorate
Environmental Analysis Division 2513 Kennedy Circle
/ . -^
NOTICES
When Government drawings, specifications, or other data are used for any purpose other than in connection with a definitely Government-related procurement, the United States Government incurs no responsibility or any obligation whatsoever. The fact that the Government may have formulated or in any way supplied the said drawings, specifications, or other data, is not to be regarded by implication, or otherwise in any manner construed, as licensing.-' the holder or any other person or corporation; or as conveying any rights or permission to manufacture, use, or sell any patented invention that may in any way be related thereto.
The mention of trade names or commercial products in this publication is for illustration purposes and does not constitute endorsement or recommendation for use by the United State Air Force.
The Office of Public Affairs has reviewed this report, and it is releasable to the National Technical Information Service, where it will be available to the general public, including foreign nationals.
This report has been reviewed and is approved for publication.
Government agencies and their contractors registered with Defense Technical Information Center (DTIC) should direct requests for copies to: Defense Technical Information Center, 8725 John J. Kingman Rd STE 0944 Ft Belvoir,VA 22060-6218.
Non-Government agencies may purchase copies of this report from: National Technical Information Services (NTIS), 5285 Port Royal Road, Springfield, VA 22161-2103.
S. JEANETTE HOWARD, Maj, USAF, BSC, CIH MICHAEL G. ELLIOTT, Maj, USAF, BSC, Ph.D, PE, CIH Chief, Air Quality Branch Chief, Environmental Analysis Division
Public reporting burden for this collection of information is estimated to average 1 hour per response, including the time for reviewing instructions, searching Bursting data sources, gathering and maintaining the data needed, and completing and reviewing the collection of information. Send comments regarding this burden estimate or any other aspect of this collection of information, including suggestions for reducing this burden, to Washington Headquarters Services, Directorate for Information Operations and Reports, 1215 Jefferson Oevis Highway, Suite 1204, Arlington, VA 222024302, and to the Office of Management and Budget, Paperwork Reduction Project (0704-0188), Washington, DC 20503.
1. AGENCY USE ONLY {Leave blank) 2. REPORT DATE
March 2001
3. REPORT TYPE AND DATES COVERED
Special Report
4. TITLE AND SUBTITLE
JP-8 Volatility Study
6. AUTHORIS)
5. FUNDING NUMBERS
7. PERFORMING ORGANIZATION NAME(S) AND ADDRESS(ES)
Southwest Research Institute 6220 Culebra Road
San Antonio, TX 78238
8. PERFORMING ORGANIZATION REPORT NUMBER
IERA-RS-BR-SR-2001-0002
9. SPONSORING/MONITORING AGENCY NAME(S) AND ADDRESS(ES)
Air Force Institute of Environment Safety and Occupational Health (AFIERA) Risk Analysis Directorate
Environmental Analysis Division (RSE) 2513 Kennedy Circle
Brooks AFB. TX 78235-5123
10. SPONSORING/MONITORING AGENCY REPORT NUMBER
11. SUPPLEMENTARY NOTES
12a. DISTRIBUTION AVAILABILITY STATEMENT
Approved for public release; distribution is unlimited.
12b. DISTRIBUTION CODE
13. ABSTRACT (Maximum 200 words)
The Clean Air Act and related State/local regulations require facilities to periodically prepare and submit air emissions inventories which quantify the annual emissions from the various stationary sources/processes located at the installation. For Air Force installations, these inventories must include the evaporative losses associated with the transfer and storage of jet fuel (i.e., JP-8). To accurately calculate the evaporative losses associated with fuel storage and transfer operation, the true vapor pressure of the fuel at various "ambient" temperatures must be known. Unfortunately, very little JP-8 vapor pressure information is currently available for temperatures at or below 100 degrees Fahrenheit. This report measured the true vapor pressure of several representative JP-8 fuel at seven different ambient range temperatures.
14. SUBJECT TERMS
Air Emissions Inventory, Volatile Organic Compounds (VOC), JP-8, evaporative losses, vapor pressure, jet fuel, ASTM D 93, ASTM D 5191, ASTM D 2887
IS. NUMBER OF PAGES 38 16. PRICE CODE
17. SECURITY CLASSIFICATION OF REPORT
Unclassified
18. SECURITY CLASSIFICATION OF THIS PAGE
Unclassified
19. SECURITY CLASSIFICATION OF ABSTRACT
Unclassified
20. LIMITATION OF ABSTRACT
UL
Standard Form 298 (Rev. 2-89) (EG)
Prescribed by ANSI Std. 230.18 Designed using Perform Pro, WHS/0I0R, Oct 94
THIS PAGE INTENTIONALLY LEFT BLANK
1.0 BACKGROUND/SCOPE
The Clean Air Act and related State/local regulations require facilities (including Air Force installations) to periodically prepare and submit air emissions inventories which quantify the annual emissions from the various stationary sources/processes located at the installation. For Air Force installations, these inventories must include the evaporative losses associated with the storage and transfer of jet fuel (i.e., JP-8). To accurately calculate the evaporative losses associated with fuel storage and transfer operations, the true vapor pressure of the fuel at various "ambient" temperatures (ranging from 40-100°F) must be known. Unfortunately, very little JP-8 vapor pressure information is currently available for temperatures at or below 100°F. The purpose of this effort is to measure the true vapor pressure of several representative JP-8 fuel samples at seven different ambient-range temperatures.
2.0 APPLICABLE DOCUMENTS
1. Military Specification MIL-T-83133D, "Turbine Fuel, Aviation, Kerosene Types, NATO F-34 (JP-8) and NATO F-35," 29 January 1992.
2. Coordinating Research Council (CRC) Aviation Fuel Properties Handbook
3. American Society for Testing and Materials (ASTM) Test Method D5191-96, "Standard Test Method for Vapor Pressure of Petroleum Products (Mini Method)" 4. ASTM Test Method D5842-95, "Standard Practice for Sampling and Handling of Fuels
for Volatility Measurement"
5. ASTM Test Method D93, "Standard Test Methods for Flash Point by Pensky-Martens Closed Cup Testers"
6. ASTM Test Method D2887, "Boiling Range Distribution of Petroleum Fractions by GC" 7. Documents found on the Air Force Research Laboratory's Fuels Branch (AFRL/PRSF)
internet site: https://posfbbs.appl.wpafb.af.mil/
March 15,2001
3.0 APPROACH
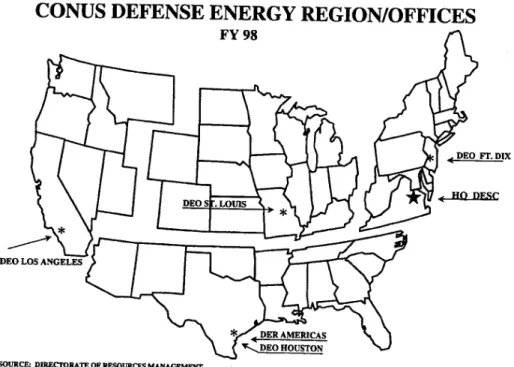
Under this project, SwRI obtained and analyzed six different samples of JP-8. The samples were
selected based on their flash point as measured by ASTM D 93. Samples were selected to cover
the range from 38° to 60°C (100° to 140°F) to the extent possible. The Air Force also requested
that samples be obtained from as many of the Defense Energy Regions as possible. The Defense
Energy Regions are shown in Figure 1.
CONUS DEFENSE ENERGY REGION/OFFICES
FY98
DEO FT. DIX
HO r>Esr
DEO LOS ANGELES
SOURCE: DIRECTORATE OF RESOURCES MANAGEMENT
Figure 1. Defense Energy Regions
SwRI obtained fuel delivery data from the Defense Energy Support Center headquarters. Using
this information, SwRI selected candidate fuel sample sites and submitted the list to the technical
project manager. Following approval, SwRI arranged to obtain the selected samples.
SwRI provided sampling instructions and sample containers. The sampling instructions were written in accordance with standardized sampling methods currently available from ASTM and the Air Force. The sample containers were 1-gallon, epoxy-lined, steel cans.
The following analyses were performed on each.
3.1 Standard Test Method for Flash-Point by Pensky-Martens Closed Cup Tester, ASTM D 93.
Under this test method, a brass test cup of specified dimensions, filled to the inside mark with test specimen and fitted with a cover of specified dimensions, is heated and the specimen stirred at specified rates, by either of two defined procedures (A or B). An ignition source is directed into the test cup at regular intervals with simultaneous interruption of the stirring, until a flash is detected.
3.2 Vapor Pressure by the Mini-Method, ASTM D 5191, at four temperatures.
Under this test method, a known volume of chilled, air-saturated sample is introduced into an evacuated, thermostatically controlled test chamber, the internal volume of which is five times that of the total test specimen introduced into the chamber. After injection into the test chamber, the test specimen is allowed to reach thermal equilibrium at the test temperature. The resulting rise in pressure in the chamber is measured using a pressure transducer sensor and indicator. Only total pressure measurements (sum of the partial pressure of the sample and the partial pressure of the dissolved air) are used in this test method, although some instruments can measure the absolute pressure of the sample as well.
This test method covers the use of automated vapor pressure instruments to determine the total vapor pressure exerted in vacuum by air-containing, volatile, liquid petroleum products. This test method is suitable for testing samples with boiling points above 0°C (32°F) that exert a vapor pressure between 7 and 130 kPa (1.0 and 18.6 psi) at 37.8°C (100°F) at a vapor-to-liquid ratio of 4:1. Measurements are made on liquid sample sizes in the range from 1 to 10 mL. No account is
March 15,2001
made for dissolved water in the sample. Although the method is not specifically applicable to JP-8 fuels, it is the method most commonly used to measure vapor pressure. The tests were conducted to provide comparison data with the results from the gas chromatography method. The selected test temperatures were 40°F, 60°F, 80°F, and 100°F. Four different temperatures were selected because vapor pressure is a function of temperature. These temperatures were selected to cover a reasonable range of typical ambient temperatures for fuel storage.
3.3 Standard Test Method for Boiling Range Distribution of Petroleum Fractions by Gas Chromatography, ASTM D 2887.
The boiling range distribution determination by distillation is simulated by the use of gas chromatography. A non-polar packed or open tubular (capillary) gas Chromatographie column is used to elute the hydrocarbon components of the sample in order of increasing boiling point. The column temperature is raised at a reproducible linear rate and the area under the chromatogram is recorded throughout the analysis. Boiling points are assigned to the time axis from a calibration curve obtained under the same Chromatographie conditions by analyzing a known mixture of hydrocarbons covering the boiling range expected in the sample. From these data, the boiling range distribution can be obtained.
3.4 Vapor Pressure and Vapor Speciation by Gas Chromatography at 40°F 50°F, 60°F, 70°F, 80°F, 90°F, and 100°F. The speciation included special attention to compounds listed as Hazardous Air Pollutants.
To summarize this method, the fuel sample is heated to the desired temperature in a fuel vaporization chamber. A sample of the vapor space is collected and injected into a gas Chromatograph (GC). In the GC, the various compounds present in the vapor are separated. Data analysis software is used to identify (speciate) each peak, normalize the peak areas, and calculate the molar concentration of each compound. The individual molar concentrations are then summed to obtain the total molar concentration of hydrocarbons in the vapor. That number is then used to calculate the vapor pressure as described later in this report.
A fuel vaporization chamber was used to produce fuel vapors. The 1.2-liter chamber was equipped with a gas-sampling probe and sensors to measure the pressure and fuel temperature. The chamber was kept isothermal (within 0.2°F) by an Isotemp 10285 bath made by Fisher Scientific. Fuel temperature was measured with a Wavetek 600 series RTD.
The gas-sampling probe was made 0.062-inch internal diameter, electro-polished nickel tubing. The tubing was also used as the transfer line from the probe to the sample loop in the gas Chromatograph. The transfer line was enveloped by a 0.25 inch copper tube which was wrapped with heating tape and heated above 250°F. The sample loop temperature was 257°F. A high- temperature bellows valve isolated the gas-sampling probe so that the transfer line and sample loop could be evacuated. This was done so the vapor samples could be extracted into the sample loop.
Fuel vapor analysis was performed with a Hewlett-Packard model 5890 gas Chromatograph equipped with a 105-meter x 0.25-millimeter capillary column and a flame ionization detector. Data were acquired with Separation Systems Inc. software designed specifically for high- resolution analysis of complex hydrocarbon mixtures. The retention times and species identifications were obtained using a hydrocarbon standard composed of over 400 identified compounds. The analysis required an elaborate temperature program that gave excellent separation of the species in jet fuel vapors.
4.0 RESULTS
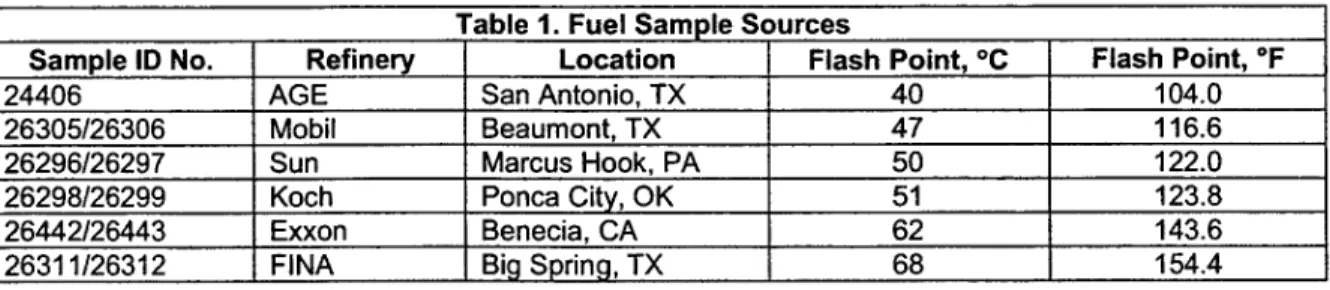
Table 1 is a listing of the fuel sample sources and the measured flash point of each sample.
Table 1. Fuel Sample Sources
Sample ID No. Refinery Location Flash Point, °C Flash Point, °F
24406 AGE San Antonio, TX 40 104.0
26305/26306 Mobil Beaumont, TX 47 116.6 26296/26297 Sun Marcus Hook, PA 50 122.0 26298/26299 Koch Ponca City, OK 51 123.8 26442/26443 Exxon Benecia, CA 62 143.6 26311/26312 FINA Big Spring, TX 68 154.4
March 15,2001
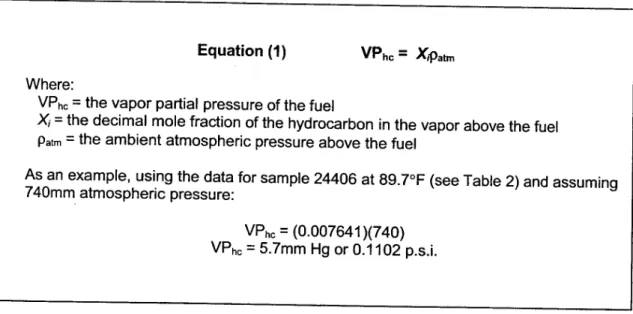
The mole fraction of a component of a vapor is equal to its pressure fraction in the vapor. Therefore, the fuel-related vapor pressure above a liquid fuel is determined by multiplying the decimal mole fraction of the hydrocarbon by the average local atmospheric (ambient) pressure. This is demonstrated in the following example (Equation 1).
Equation (1) VPhc = Xpalm
Where:
VPhc = the vapor partial pressure of the fuel
Xj = the decimal mole fraction of the hydrocarbon in the vapor above the fuel
Patm = the ambient atmospheric pressure above the fuel
As an example, using the data for sample 24406 at 89.7°F (see Table 2) and assuminq 740mm atmospheric pressure:
VPhc = (0.007641 )(740)
VPhc = 5.7mm Hg or 0.1102 p.s.i.
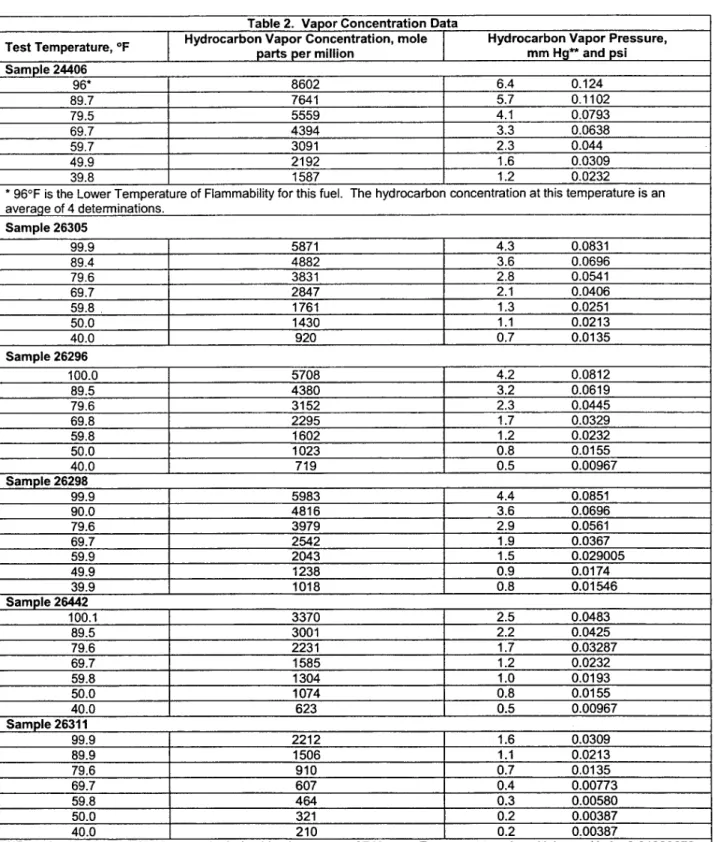
Table 2 contains the temperature and vapor concentration data from the analysis of the test fuels. This table also includes hydrocarbon vapor pressure data for the test fuels (assuming an ambient atmospheric pressure of 740 mm). Figures 2-7 are plots of the data from Table 2. Figures 8 and 9 contain plots of all the data from Table 2 combined on one graph. Figure 8 is a plot using vapor concentration in parts per million while Figure 9 is a plot using vapor concentration in milligrams per liter. Figures 10 and 11 (parts per million and milligrams per liter, respectively) are plots of the equation to model all of the data on a single plot. It is this equation that can be used to estimate vapor concentration based on flash point and storage temperature.
Table 2. Vapor Concentration Data
Test Temperature, °F Hydrocarbon Vapor Concentration, mole parts per million Hydrocarbon Vapor Pressure, mm Hg** and psi Sample 24406
96* 8602 6.4 0.124
89.7 7641 5.7 0.1102
79.5 5559 4.1 0.0793
69.7 4394 3.3 0.0638
59.7 3091 2.3 0.044
49.9 [ 2192 1.6 0.0309
39.8 1587 1.2 0.0232
* 96°F is the Lower Temperature of Flammability for this fuel. The hydrocarbon concentration at this temperature is an averaqe of 4 determinations.
Sample 26305
99.9 5871 4.3 0.0831
89.4 4882 3.6 0.0696
79.6 3831 2.8 0.0541
69.7 2847 2.1 0.0406
59.8 1761 1.3 0.0251
50.0 1430 1.1 0.0213
40.0 920 0.7 0.0135
Sample 26296
100.0 5708 4.2 0.0812
89.5 4380 3.2 0.0619
79.6 3152 2.3 0.0445
69.8 2295 1.7 0.0329
59.8 1602 1.2 0.0232
50.0 1023 0.8 0.0155
40.0 719 0.5 0.00967
Sample 26298
99.9 5983 4.4 0.0851
90.0 4816 3.6 0.0696
79.6 3979 2.9 0.0561
69.7 2542 1.9 0.0367
59.9 2043 1.5 0.029005
49.9 1238 0.9 0.0174
39.9 1018 0.8 0.01546
Sample 26442
100.1 3370 2.5 0.0483
89.5 3001 2.2 0.0425
79.6 2231 1.7 0.03287
69.7 1585 1.2 0.0232
59.8 1304 1.0 0.0193
50.0 1074 0.8 0.0155
40.0 623 0.5 0.00967
Sample 26311
99.9 2212 1.6 0.0309
89.9 1506 1.1 0.0213
79.6 910 0.7 0.0135
69.7 607 0.4 0.00773
59.8 464 0.3 0.00580
50.0 321 0.2 0.00387
40.0 210 0.2 0.00387
March 15, 2001
Fuel Flash Point = 40°C (104°F)
3000
2400
1900
1500
1200
C
vap= 2.29 x 10
10Exp[-8213.9/(460+T)]
C = Vapor Cone.
1.80 1.84 1.88 1.92 1.96 2.00
1000/TpR]
Figure 2. Dependence of JP-8 Vapor Concentration on Temperature: Fuel No. 24406
Fuel Flash Point = 47°C (117°F)
E
Q.
Q.
Ö
C
O
Ü
s_O Q_ CO >
7000
5300
4000
3000
2400
1900
1500
1200
950
750
Cvap = 1.01x10¹⁰ Exp[8015/(T+460)]
Cvap = Vapor Cone.
T = °F
1.80 1.84 1.88 1.92 1.96 2.00
1000/T[°R]
Fuel Flash Point = 50°C (122°F)
9000 - 7000 -
£
Q. 5300 4000 -
6
C
o
Ü
i_
o
3000 - 2400 1900 ■ 1500 -
Q. CO
>
1200 - 950 - 750 - 600 -
, = 9.35 x 10,u Exp[-9292/(T+460)]
Cvap = Vapor Cone.
T = °F
1.80 1.84 1.88 1.92 1.96 2.00
IOOO/T[°R]
Figure 4. Dependence of JP-8 Vapor Concentration on Temperature: Fuel No. 26296
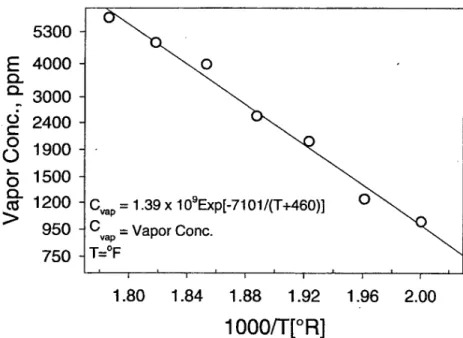
Fuel Flash Point = 51 °C (124°F)
E
Q. Q. Ü
C
o
Ü
o
Q.CO >
5300
4000
3000
2400
1900
1500
1200
950
750
\o
CvaP = 1-39 x 109Exp[-7101/(T+460)]
o\
CvaP = VaPor Cone.T=°F
L. , , , 1 , 1 L_ —i ' 1 ■—
1.80
1.84 1.88 1.92 1.96
2.00
1000/T[°R]
March 15,2001
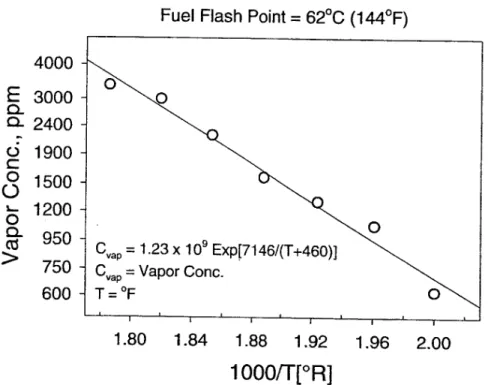
Fuel Flash Point = 62°C (144°F)
Q. Q.
d
c
o
Üo
Q_
CO
>
4000 -
3000
2400
1900
1500
1200
950
750
600
Cvap = 1.23 x 10⁹ Exp[7146/(T+460)]
Cvap = Vapor Cone.
T = °F
1.80 1.84 1.88 1.92 1.96 2.00
1000/T[°R]
Figure 6. Dependence of JP-8 Vapor Concentration on Temperature: Fuel No. 26442
Fuel Flash Point = 68°C (154°F)
E
Q. Ü
C
o
Üi_
o
Q.
CO
>
3000
2400
1900
1500
1200
950
750
600
450
325
225 ^
150
Cvap = 7.72 x 101t> Exp[9767/(T + 460)]
Cvap = Vapor Cone.
T = °F
1.80 1.84 1.88 1.92 1.96 2.00
1000/T(°R)
Figure 7. Dependence of JP-8 Vapor Concentration on Temperature: Fuel No. 26311
Q. Q. ü C
o
ü
o
Q.
co
>.76 1.80 1.84 1.88 1.92 1.96 2.00 2.04
1000/T, °R
Figure 8. Vapor Concentration (ppm) vs. Temperature (All Fuels)
March 15,2001
E
d
c
o
O
o
Q.
>
24406
©
26305
*
26296
A
26298
■
26442
V
26311
1.80 1.84 1.88 1.92 1.96 2.00
1000/T, °R
Figure 9. Vapor Concentration (mg/L) vs. Temperature (All Fuels)
9000 -
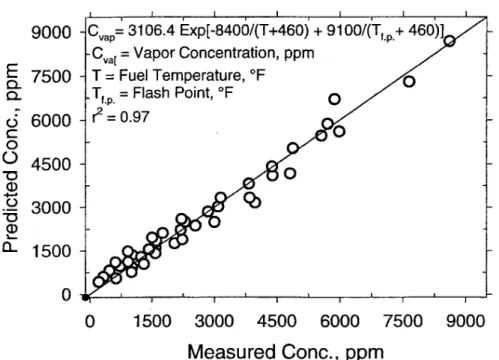
vap-, ' , ' , ' r-
= 3106.4 Exp[-8400/(T+460) •+ —' •9100/(T■ fp+460)] 'S ' ■ "-TI "Cva[ = Vapor Concentration, ppm yS
§_ 7500 -
T = Fuel Temperature, °F= Flash Point, °F
O X
6 6000 -
c
o
ü
4500 -
T3 O
•J 3000 -
CD
£ 1500 -
r2 = 0.97
i
1
1
0 i J 1 ' 1 ' 1 1 ' 1 ' 1
0 1500 3000 4500 6000 7500 9000
Measured Gone, ppm
Figure 10. Correlation of Vapor Concentration (ppm) with Temperature and Flash Point
40
O)
o
c
o
O
CDo
CD30 -
20
10 -
0
Cvap=14.55Exp[-8211/(T+ 460) + 8900/(T(D+460)]
C = Vapor Concentration, mg/L T = Fuel Temperature, °F
Tfp= Flash Point, °F
r2 = 0.98
0 10 20 30 40
Measured Cone, mg/L
Figure 11. Correlation of Vapor Concentration (mg/L) with Temperature and Flash Point
March 15, 2001
Table 3 contains the equations for the nonlinear regression fit of the data. Table 3 also contains
the composite equation, which describes all the test data.
Figure 12 contains six gas chromatograms. These chromatograms are the plots of the boiling
point distribution analysis data for each of the test fuels. They are plotted on a single page for
the purposes of comparison. The plots are arranged from the lowest flash point to the highest
flash point (top to bottom). Note that as the flash point of the fuel increases, the "front-end" of
the fuel moves progressively farther up scale. The complete gas chromatography, boiling point
distillation reports are found in Appendix A.
Sample
Table 3. Equations for Calculating Vapor Concentration (ppm)
24406 26305 26296 26298 26442 26311
Composite Data
m-— Equation CvaD = 2.29 x 10'" expr-8213.9/(460+T)1
Cvap = 1.01 x 10'" expr-8015.3/(460+T)l
Cvap = 9.35 x 10'" expr-9291.8/(460+T)1
Cvap = 1.24 x 10'" expj-8126.3/(460+T)T
CV3P = 1.23 x 10" expf-7146.5/(460+T)l
Cva~ = 3.04 x 10" expH0518/(460+T)i
Cvap = 3106.4 exp[-8400/(T+460) + 9100/(Tfo+460)1
Cvap - Vapor Concentration T = temperature, °F Tfn = flash point, °F
Calculating Vapor Pressure Values
As an example, for a JP-8 with a flash point of 110°F and stored at 80°F, the vapor concentration
would be:
Cvap = 3106.4 exp[-8400/(80+460) + 9100/(110+460)]
Cvap = 3106.4 exp[0.4]
Cvap = 4628 mole parts per million (and the decimal mole fraction of hydrocarbon in
the vapor above the fuel would be 0.004628)
Assuming an atmospheric pressure of 740 mm Hg, and substituting into Equation (1), gives a
calculated vapor pressure of:
(0.004628)(740) = 3.42 mm Hg
(3.42 mm)(0.01933678 p.s.i./mm) = 0.07 psi
mVote_
40— 30- 20-
10—I
0—1—
mVoltZJ 60—I
50—j 40-J
30-J
20-J 10—1
(jMrl
^ v
Fa«:eA.bu\moAJ|«iajl1B00 iBMOfrrljiji
ChanneEA'A Results LastrecateNA ■
ChannafcA"A Results { MsliecalgNA I
■ FH*c4rf»WKidul.18umMaBSaW.nrt OiannatA-A Rnu*s
LXmalcNA •
FtadsWmoduta1W»D»ß&U21 ChanmtA-A Rasdt»
«rtraafcJIA
H
FJIa'f=>sb»Vj«>dulcHS|H7HI»l263H1.nii^ CtwinatA - A Results
^stmohrNA
IT
lo—5 : Rö
Figure 12. Boiling Point Distribution by Gas Chromatography
W
March 15,2001
Table 4 is a summary of vapor pressure results, by ASTM D 5191, for the six test fuels at the four test temperatures. Recall that these results include the partial pressure of the air entrained in the sample. The results obtained by the gas Chromatographie method are also presented in the table for comparison. Examination of all the data shows that ASTM D 5191 is indeed less sensitive than the gas Chromatographie method. This is as expected since D 5191 was developed for fuels with vapor pressure of 1 psi or higher. Use of the gas Chromatographie method provides a measurement of the vapor partial pressure for the hydrocarbons and not the entrained air.
Table 5 is a lookup table provided for the convenience of the reader. The calculated vapor partial pressure is based on an atmospheric pressure of 740 mm Hg.
Table 6 summarizes the findings of the analysis of fuel vapors for hazardous air pollutants. These data were obtained by comparing the results of the vapor speciation analysis with the published list of hazardous air pollutants. Many factors control the concentration of these compounds in a given finished fuel. For this reason, the average concentrations should be used to describe an average fuel.
Table 4. Comparison of Vapor Pressure Results me Calculated from Gas Chromatoo
asured by ASTM D 5191 with Results raphy Data. D.s.i.
Sample No. 40°F 60°F 80°F 100°F
D5191 GC D5191 GC D5191 GC D5191 GC
24406 0.06 0.02 0.06 0.04 0.20 0.08 0.26 01
26305 0.09 0.01 0.11 0.03 0.26 0.05 0.32 0.08
26296 0.06 0.01 0.06 0.02 0.16 0.04 0.26 0.08
26298 0.02 0.02 0.02 0.03 0.16 0.06 0.19 0.09
26442 0.05 0.01 0.06 0.02 0.20 0.03 0.22 0.05
26311 0.04 <0.01 0.05 0.01 0.19 0.01 0.21 0.03
Table 5. JP-8 Vapor Partial Pressure Look-Up Table as Calculated from Gas Chromatography Data (Assuming an Atmospheric Pressure of 740 mm Hg)
Part a. Partial Pressure in p.s.i.
Flash Point, °F Fuel Temperature, °F
40 50 60 70 80 90 100
100 0.03 0.04 0.05 0.07 0.09 0.12 0.16
105 0.02 0.03 0.04 0.06 0.08 0.10 0.13
110 0.02 0.03 0.04 0.05 0.07 0.09 0.12
115 0.02 0.02 0.03 0.04 0.06 0.08 0.10
120 0.01 0.02 0.03 0.04 0.05 0.07 0.09
125 0.01 0.02 0.02 0.03 0.04 0.06 0.08
130 0.01 0.02 0.02 0.03 0.04 0.05 0.07
135 0.01 0.01 0.02 0.03 0.03 0.05 0.06
140 0.01 0.01 0.02 0.02 0.03 0.04 0.05
145 0.01 0.01 0.01 0.02 0.03 0.04 0.05
150 0.01 0.01 0.01 0.02 0.02 0.03 0.04
155 0.01 0.01 0.01 0.02 0.02 0.03 0.04
160 0.01 0.01 0.01 0.01 0.02 0.02 0.03
Part b. Partial Pressure in mm of Hg
Flash Point, °F Fuel Temperature, °F
40 50 60 70 80 90 100
100 1.33 1.84 2.53 3.43 4.60 6.11 8.02
105 1.15 1.60 2.19 2.97 3.99 5.29 6.95
110 1.00 1.39 1.90 2.58 3.46 4.59 6.03
115 0.87 1.21 1.66 2.25 3.01 4.00 5.25
120 0.76 1.05 1.45 1.96 2.63 3.49 4.58
125 0.66 0.92 1.26 1.71 2.30 3.05 4.01
130 0.58 0.81 1.11 1.50 2.01 2.67 3.51
135 0.51 0.71 0.97 1.32 1.77 2.35 3.08
140 0.45 0.62 0.86 1.16 1.56 2.07 2.72
145 0.40 0.55 0.76 1.02 1.37 1.82 2.40
150 0.35 0.49 0.67 0.91 1.22 1.61 2.12
155 0.31 0.43 0.59 0.80 1.08 1.43 1.88
160 0.28 0.38 0.53 0.71 0.96 1.27 1.66
o o o o
to ™
J 10- co ■*" O £ © B in m CO o Z u cu
"c7 u
a.
5
COr
o
a
a> K "Ü c D)(0 o a> CO ■* CO in CN ,_ CN ,_
a) >
CM CM 00 CO CO p o CD <* r» Ö d d d d T^ d T-^ CN d
< £ CM
o o CO CD r~- in 1^ ■<fr CD CD r>-
CO CO CM
o Ö Ö V
CO
d CD d o d CO d
CO
d o d m d d
CN d
CM
3
CO od
V
■*
CO
CO
p CO o P CO CO 00 CD in
co
CM Ö d d T~ d CM
d
V T_ T_ d
CO
■tf o
d
V
m CO CD CD CD CD 00 T—
CM co CM CD CN ■* CN o in CD CO
5?
c CO
CM Ö d d ■*- d ^ d d d d
(O ^
o CO CD CO o CD o CO ■si- ■*
n CM o ■* 00 o O cq CO CM
3 <o CM Ö d V d d d d V d d V CO ■* T—
"5 a.
<
in
o CD o •* CN CD CM CO ^_ CO CO T—
CO CO d
V
CM p o T— CO o CD CD 00 (0
3 (O
CM Ö d ■<- c\i d CM d T^ T^ d
o CO N CO I <o
o CD o CO in CN LO p
d
V
■^ ■<J- ■*
3
Ö d VV
^in
d o d 1^ CO
CO CN
CD p o
a (0 ^.^
> o op o
DL -> «^ O a. Ö 00 in i CN
LO CO CO CD CO
co CM
CO
d CO CD CD
>* CO
00 CO co
c ~ o o ** m
10
*■*
c
0> o c JO JO
o u 3 3 ° E
°,?
CO
X
CO X CM
I
©
X X
CO X o CO X Ü CO X o X o X o X
(b o
d
C7>
O Ü CO
o
CO O O CO COo
COo
COo
0)
s
11-
.a
(0
l-
CM o 1 CO •<* 1 CO i CO CO ■ CO CO CO
CO .O cö CD CM ■<d- o oö rr i oö CM
< E
O 3
,^- CD ■ 00
5-
in i CM 00 00i CO ■*
^~ CD 00 Ö o 1 oö o in i CD
00 CD z r*- O
T— CD o ^r—
CD o in o o
co c
2
CD a) c
■a c c CO CO c 3 O a E o CO c CO N c cu CO 3 0) c co E co N c CO JQ CO c CO X co X c CO CO x: co c CD 3 a. >» +-> CO CO CO c CO CO c CO CO CO c CO co
CD £0 i
3
o
■>..c
a. o E X ■ X 1 ><
ü CO ■
*—•
LU
CO
2 \- i
CN CN
APPENDIX A BOILING POINT DATA
File: C:\Star\Module16\JL1800AL24406RRl CDF Sample: JL1800 AL24406RR U^UDKK1CDF
Parameter: D2887 JUL 18, 2000-15:31:29
Operator-
Calibration Curve
ASTM D2887
BP(C)
500"
450~
400
350 ~
300"
250~_
200"
150 j
i i
I !
p i i I
I I I
I
'i i'
i! J
:i '
■
HI
■
' i in ill U
IJSIilf
"',: ■'}■' I i n v !i 3 'Si
iSgrnii
:N-C40
Signal(mV)
350
h-C32
"300
N-C24
"250
•N-C18
%C16
N-C14
"200
Ü! T:J it
u;;
150
100
j/,!; ;•
to; '; • >;:•
0.0 5.0
"50
o o o
w
10.0 15.0
Time (Min)
20.0 25.0
Jormal
1 Aromatic
Branch 20
Parameter: D2887
Boiling Point Table
ASTM D2887
%Off BP(C) %0ff BP(C) %Off BP(C)
IBP 104.1 45.0 7333 90.0 "250.2 1.0 109.9 46.0 195.4 91.0 251.5 2.0 117.0 47.0 196.3 92.0 252.3 3.0 122.4 48.0 196.8 93.0 253.1 4.0 125.2 49.0 197.2 94.0 255.2 5.0 130.7 50.0 197.5 95.0 258.5 6.0 133.9 51.0 198.3 96.0 261.9 7.0 136.4 52.0 199.8 97.0 264.4 8.0 137.4 53.0 200.8 98.0 268.8 9.0 140.1 54.0 202.0 99.0 273.3 10.0 141.7 55.0 203.3 FBP 281.3 11.0 142.8 56.0 204.7
12.0 144.5 57.0 206.0 13.0 148.7 58.0 207.1 14.0 149.8 59.0 208.3 15.0 150.4 60.0 209.7 16.0 151.0 61.0 211.1 17.0 153.5 62.0 212.5 18.0 155.5 63.0 213.1 19.0 157.6 64.0 213.6 20.0 159.1 65.0 214.0 21.0 160.2 66.0 214.5 22.0 161.7 67.0 215.6 23.0 163.2 68.0 216.7 24.0 165.0 69.0 218.4 25.0 166.3 70.0 220.5 26.0 167.3 71.0 222.4 27.0 168.1 72.0 223.6 28.0 169.1 73.0 225.0 29.0 172.0 74.0 226.2 30.0 173.7 75.0 227.4 31.0 174.5 76.0 228.6 32.0 175.1 77.0 230.1 33.0 175.5 78.0 231.9 34.0 176.2 79.0 232.8 35.0 178.5 80.0 233.4 36.0 179.9 81.0 234.0 37.0 181.0 82.0 235.2 38.0 182.2 83.0 237.2 39.0 183.3 84.0 239.4 40.0 186.0 85.0 241.8 41.0 187.6 86.0 243.7 42.0 188.9 87.0 245.3 43.0 190.3 88.0 246.9 44.0 192.1 89.0 248.2 . _. .. _ _ .
Recovery: 100.0
Analysis Area: 1.0873e+05 Sample Amt: 1.0000 R.Time Date: 6/23/2000 R.Factor Date:
End Time: 12.00 min. End Signal: 0 319 mV Start Time: 0.17 min.
Start Signal: 0.000 mV Solvent Amt: 1.0000
R.Time File: C:\Star\Module16\D2887ST20C J2000 1M1001 CDF R.Factor File:
Blank File:
Sample: JL1700AL26305 ML^UÖT-CDF
Parameter: D2887
Calibration Curve
ASTM D2887
JUL17, 2000-14:42:40 Operator:
BP(C)
500~ N-C40
_Signal(mV)
.-"900
450~
400"
350~
300~
250 _'
200
150"
100 JE \N_ci
-rt - \: t>- '■ i,
<p; : !
■£>: -: ,: :.
1" •■='■■
0.0
•N-C32
I I I
'i I /
I ■ i ,
I | I I
ill! I i
Jijll
■! i.'ili
•N-C24
1 ■ '] J i ijiil! !i II I !
' n
} i I
'N-C18
%C16
«''»teil I
9? »I
,,.'JI!,I
! !•
CO
en
- 800
'700
600
-"500
"400
300
"200
100
5.0
—— $L_
10.0 15.0
Time (Min)
20.0 25.0
r'RöTmär"
• Aromatic « Branch 22
Parameter: D2887
Boiling Point Table
ASTM D2887
%Off BP(C) %Off BP{C) %Off BP(C) 253.7 IBP 106.0 45.0 195.0 90.0
1.0 117.4 46.0 196.8 91.0 254.7 2.0 127.9 47.0 197.8 92.0 255.6 3.0 136.4 48.0 198.4 93.0 258.1 4.0 140.8 49.0 198.9 94.0 261.5 5.0 143.4 50.0 199.4 95.0 264.3 6.0 145.9 51.0 199.8 96.0 267.2 7.0 150.3 52.0 200.6 97.0 270.6 8.0 151.4 53.0 201.8 98.0 272.6 9.0 152.2 54.0 202.8 99.0 280.4 10.0 153.0 55.0 203.8 FBP 286.3 11.0 155.3 56.0 205.0
12.0 157.8 57.0 206.3 13.0 159.6 58.0 207.7 14.0 160.9 59.0 208.8 15.0 161.8 60.0 209.8 16.0 162.6 61.0 211.0 17.0 163.5 62.0 212.4 18.0 164.8 63.0 214.0 19.0 166.2 64.0 214.8 20.0 167.5 65.0 215.4 21.0 168.6 66.0 215.9 22.0 169.4 67.0 216.5 23.0 170.2 68.0 217.9 24.0 170.8 69.0 219.3 25.0 171.6 70.0 221.0 26.0 173.4 71.0 223.2 27.0 175.5 72.0 225.0 28.0 176.5 73.0 226.3 29.0 177.1 74.0 227.7 30.0 177.7 75.0 228.9 31.0 178.2 76.0 230.4 32.0 178.6 77.0 232.6 33.0 179.5 78.0 234.2 34.0 181.4 79.0 235.2 35.0 182.6 80.0 236.0 36.0 183.6 81.0 236.8 37.0 184.5 82.0 238.4 38.0 185.5 83.0 240.7 39.0 186.8 84.0 243.3 40.0 188.8 85.0 245.4 41.0 189.9 86.0 247.1 42.0 190.9 87.0 248.8 43.0 192.0 88.0 250.2 44.0 193.5 89.0 252.3 - - . _ - - ._.. _
Recovery: 100.0
Analysis Area: 2.7265e+05 Sample Amt: 1.0000 R.Time Date: 6/23/2000 R.Factor Date:
End Time: 11.99 min. End Signal: 0.000 mV Start Time: 0.07 min.
Start Signal: 0.080 mV Solvent Amt: 1.0000
R.Time File: C:\Star\Module16\D2887ST20C J2000 1M1001.CDF R. Factor File:
Blank File:
File. CASar\Module16\JL1700AL262961 CDF Sample: JL1700 AL26296
Parameter: D2887 JUL 17, 2000-15:20:48
Operator
Calibration Curve
ASTM D2887
BP(C)
500" N-C40
Signal(mV)
~200
450 :,
> f, i
N-C32
180
400"
350~-
| ? i
i .i N-C24
- 160
"140
300
250"-
200"
150"
i'i I I
i Hi ill j ;' i, I "111; :!'! :'.'..IMS i;;
ili..|l!?H
j lliii.'!/!!! '•' ii i,' !l
i
1i
ii .!
I! 1
■I ?
!,' /I
•N-C18
/6-C16
N-C14
.:(|lli|tfi!
m Hi U'i!
100" ;N-e7
'5!
v«
0.0 5.0
¥ 10.0
"120
- 100
"80
"60
~40
"20
15.0 Time (Min)
20.0 25.0
r Normal • Aromatic
■t Branch
Parameter: D2887
Boiling Point Table
ASTM D2887
%Off BP(C) 130.6
%Off BP(C) %Off BP(C) IBP 45.0 183.3 90.0 227.2 1.0 132.5 46.0 184.7 91.0 229.2 2.0 136.6 47.0 186.5 92.0 231.4 3.0 138.2 48.0 187.5 93.0 232.3 4.0 141.3 49.0 188.3 94.0 233.1 5.0 142.4 50.0 189.0 95.0 235.8 6.0 143.7 51.0 190.0 96.0 240.7 7.0 145.4 52.0 191.3 97.0 245.0 8.0 149.0 53.0 192.5 98.0 250.0 9.0 149.8 54.0 193.8 99.0 255.9 10.0 150.3 55.0 195.0 FBP 263.7 11.0 150.9 56.0 195.8
12.0 152.3 57.0 196.3 13.0 154.6 58.0 196.6 14.0 156.3 59.0 196.9 15.0 157.8 60.0 197.1 16.0 158.7 61.0 197.5 17.0 159.5 62.0 198.3 18.0 160.2 63.0 199.5 19.0 160.9 64.0 200.3 20.0 161.9 65.0 201.0 21.0 163.1 66.0 201.9 22.0 164.4 67.0 202.9 23.0 165.5 68.0 203.8 24.0 166.3 69.0 205.0 25.0 167.0 70.0 206.0 26.0 167.5 71.0 206.8 27.0 168.0 72.0 207.6 28.0 168.5 73.0 208.6 29.0 169.3 74.0 209.7 30.0 171.0 75.0 211.0 31.0 172.8 76.0 212.2 32.0 173.8 77.0 212.8 33.0 174.3 78.0 213.1 34.0 174.7 79.0 213.4 35.0 175.0 80.0 213.8 36.0 175.4 81.0 214.4 37.0 175.8 82.0 215.4 38.0 177.1 83.0 216.4 39.0 178.7 84.0 218.0 40.0 179.6 85.0 220.0 41.0 180.3 86.0 222.0 42.0 181.0 87.0 223.1 43.0 181.8 88.0 224.4 44.0 182.5 89.0 225.7
Recovery: 100.0
Analysis Area: 4.4099e+04 Sample Amt: 1.0000 R.Time Date: 6/23/2000 R.Factor Date:
End Time: 11.01 min. End Signal: 0.000 mV Start Time: 1.28 min.
Start Signal: 0.000 mV Solvent Amt: 1.0000
R.Time File: C:\Star\Module16\D2887ST20C J2000 1M1001.CDF R.Factor File:
Blank File: 25
File: C:\Star\Module16\JL1800 AL26298RRi~rnc~ Sample: JL1800AL26298RR nL^yöRR1CDF
Parameter D2887 JUL 18, 2000-14:34-43"
Operator:
Calibration Curve
ASTM D2887
BP(C)
500" N-C40
Signal(mV)
450" %C32
~400
400
350~
30Q-Z
250~
200--:
150"-
%IJ
J ! Mt.. i i! I/"
N-C24
300
200
"100
■
MJ
1°0 -€ VN_C7 .■'■: E C
0.0
w
5.0 10.0
15.0
Time (Min)
20.0 25.0
I "fsförrnäT | • Aromatic
? Branch
Parameter: D2887
Boiling Point Table
ASTM D2887
%Off BP(C) %Off BP(C)
"200.3
%Off BP(C)
IBP TOB^r 45.0 90.0 251.5 1.0 117.4 46.0 201.0 91.0 252.4 2.0 130.9 47.0 201.8 92.0 253.3 3.0 139.3 48.0 202.9 93.0 255.4 4.0 143.9 49.0 204.0 94.0 258.3 5.0 149.1 50.0 205.2 95.0 261.2 6.0 151.0 51.0 206.3 96.0 263.4 7.0 155.6 52.0 207.1 97.0 267.0 8.0 158.2 53.0 208.0 98.0 269.6 9.0 159.6 54.0 209.1 99.0 277.9 10.0 161.5 55.0 210.1 FBP 288.2 11.0 163.8 56.0 211.2
12.0 165.4 57.0 212.4 13.0 166.6 58.0 213.1 14.0 167.6 59.0 213.6 15.0 168.7 60.0 214.0 16.0 170.5 61.0 214.5 17.0 172.6 62.0 215.4 18.0 173.8 63.0 216.1 19.0 174.5 64.0 217.1 20.0 175.1 65.0 218.4 21.0 175.5 66.0 219.7 22.0 176.2 67.0 221.3 23.0 178.1 68.0 222.7 24.0 179.5 69.0 223.8 25.0 180.4 70.0 225.0 26.0 181.2 71.0 226.1 27.0 182.0 72.0 227.2 28.0 182.9 73.0 228.3 29.0 184.0 74.0 229.5 30.0 185.9 75.0 231.1 31.0 187.3 76.0 232.3 32.0 188.3 77.0 233.1 33.0 189.3 78.0 233.7 34.0 190.6 79.0 234.4 35.0 192.0 8ö:ö 235:7 36.0 193.3 81.0 237.3 37.0 194.6 82.0 239.1 38.0 195.7 83.0 240.9 39.0 196.4 84.0 242.8 40.0 196.9 85.0 244.4 41.0 197.2 86.0 246.0 42.0 197.6 87.0 247.3 43.0 198.1 88.0 248.5 44.0 199.2 89.0 250.2
Recovery: 100.0
Analysis Area: 1.1918e+05 Sample Amt: 1.0000 R.Time Date: 6/23/2000 R.Factor Date:
End Time: 12.89 min. End Signal: 0.597 mV Start Time: 0.01 min.
Start Signal: 0.000 mV Solvent Amt: 1.0000
R.Time File: C:\Star\Module16\D2887ST20C J2000 1M1001.CDF R. Factor File:
Blank File:
Sample: JL1800 AL26442 u^°^i -UJF
Parameter: D2887
Calibration Curve
ASTM D2887
JUL 18, 2000-09:08:34 Operator:
BP(C)
500" 'N-C40
Signal(mV)
450" 1 ! N-C32
~45.0
400~ s S
- 40.0
■N-C24 350"
300 ~
250
200"
S ;! 'i
liUiii
IP I
litt
M!■N-C18 /N-C16
|,'jjQ-C14 j!l!
:!?/
•'N-C11
IB
III
"35.0
"30.0
- 25.0
20.O
"15.0
150" .■•N-f JÜ!
"10.0
ioo -e ;N.C7
IS.
o o
!,
o.o 5.0
o
CM
o
10.0 15.0
Time (Min)
20.0 25.0
'5.0
"0.0
formal
1 Aromatic
Branch 28
File: C:\Star\Module16\JL1800AL264421.CDF JUL18, 2000 - 09:08:34
Sample: JL1800 AL26442 Operator:
Parameter: D2887
-
I
Boiling Point Table
ASTM D2887
%Off BP(C) %Off BP(C) %Off BP(C)
IBP 116.7 45.0 212.2 90.0 254.7 1.0 128.2 46.0 212.7 91.0 256.3 2.0 137.1 47.0 213.3 92.0 257.7 3.0 147.0 48.0 214.1 93.0 259.3 4.0 152.5 49.0 214.8 94.0 260.9 5.0 157.9 50.0 215.5 95.0 262.3 6.0 162.6 51.0 216.3 96.0 264.2 7.0 165.8 52.0 217.1 97.0 266.8 8.0 169.7 53.0 218.0 98.0 268.5 9.0 172.5 54.0 219.2 99.0 272.1 10.0 174.0 55.0 220.3 FBP 276.7 11.0 177.5 56.0 221.2
12.0 179.4 57.0 222.0 13.0 181.0 58.0 222.9 14.0 183.5 59.0 223.9 15.0 185.7 60.0 224.8 16.0 17.0 18.0 19.0 20.0 21.0 22.0 23.0 24.0 25.0 26.0 27.0 28.0 29.0 30.0 31.0 32.0 33.0 34.0 35.0 36.0 37.0 38.0 39.0 40.0 41.0 42.0 43.0 44.0 187.1 188.8 190.4 191.8 193.1 194.2 194.9 195.4 196.0 196.8 198.0 198.8 199.5 200.1 200.9 201.8 202.8 203.7 204.7 205.4 206.1 206.8 207.6 208.4 209.1 209.8 210.7 211.4 211.9 61.0 62.0 63.0 64.0 65.0 66.0 67.0 68.0 69.0 70.0 71.0 72.0 73.0 74.0 75.0 76.0 77.0 78.0 79.0 80.0 81.0 82.0 83.0 84.0 85.0 86.0 87.0 88.0 89.0 225.7 226.7 227.6 228.6 229.5 230.4 231.0 231.5 232.2 233.0 234.0 235.1 236.4 237.6 238.7 240.0 241.2 242.2 243.3 244.4 245.5 246.5 247.5 248.7 249.6 250.3 251.0 251.9 253.2 Recovery: 100.0
Analysis Area: 1.5338e+04 Sample Amt: 1.0000 R.Time Date: 6/23/2000 R.Factor Date:
End Time: 11.02 min. End Signal: 0.000 mV Start Time: 0.01 min.
Startsignal: 0.000 mV Solvent Amt: 1.0000
R.Time File: C:\Star\Module16\D2887ST20C J2000 1M1001.CDF R.Factor File:
Blank File:
File: C:\Star\Module16\JL1700AL26311i rnp Sample: JL1700 AL26311 UAU:W111-CDF
■ Parameter: D2887 JUL 17, 2000-14:06:17"
Operator:
Calibration Curve
ASTM D2887
BP(C)500"^ 'N-C40
Signaf(mV)
~65.0
450~
400"
350~
300"
250"
200~
150^
!
:N-C32
i
I! jl
If I
.4M
'N-C18 %C16
js j ;N-C14
<F
!
.ii
/N-C24
r 60.0
_ 55.0
,~50.0
"45.0
40.0
_- 35.0
r 30.0
25.0
_ 20.0
_ 15.0
100" "• S_C7
Ö
0.0 5.0
t'
r 10.0
"5.0
10.0 15.0
Time (Min)
20.0 25.0 " 0.0
' formal • Aromatic » Branch 30
Parameter: D2887
Boiling Point Table
ASTM D2887
%Off BP(C) %Off BP(C) %Off BP(C)
IBP 133.4 45.0 204.4 90.0 230.7 1.0 140.9 46.0 205.0 91.0 231.2 2.0 151.1 47.0 205.4 92.0 231.6 3.0 158.8 48.0 205.9 93.0 232.2 4.0 165.0 49.0 206.3 94.0 233.5 5.0 170.3 50.0 206.7 95.0 235.5 6.0 173.4 51.0 207.2 96.0 238.3 7.0 177.0 52.0 207.7 97.0 242.2 8.0 179.3 53.0 208.3 98.0 246.8 9.0 180.7 54.0 208.8 99.0 256.2 10.0 182.2 55.0 209.3 FBP 289:6 11.0 184.6 56.0 209.9
12.0 186.1 57.0 210.4 13.0 187.0 58.0 211.1 14.0 188.0 59.0 211.5 15.0 189.1 60.0 211.8 16.0 190.2 61.0 212.0 17.0 191.1 62.0 212.2 18.0 191.8 63.0 212.4 19.0 192.6 64.0 212.6 20.0 193.4 65.0 212.8 21.0 194.1 66.0 213.0 22.0 194.6 67.0 213.4 23.0 194.9 68.0 213.9 24.0 195.2 69.0 214.4 25.0 195.4 70.0 214.8
26.0 195.6 71.0 215.2 . 27.0 195.8 72.0 215.6
28.0 196.1 73.0 216.2 29.0 196.3 74.0 216.9 30.0 196.7 75.0 217.6 31.0 197.4 76.0 218.4 32.0 198.1 77.0 219.4 33.0 198.7 78.0 220.4 34.0 199.2 79.0 221.2 35.0 199.5 80.0 221.9 36.0 199.8 81.0 222.6 37.0 200.2 82.0 223.5 38.0 200.6 83.0 224.2 39.0 201.0 84.0 224.9 40.0 201.5 85.0 225.7 41.0 202.0 86.0 226.5 42.0 202.5 87.0 227.4 43.0 203.1 88.0 228.5 44.0 203.7 89.0 229.9
Recovery: 100.0
Analysis Area: 9.9226e+03 Sample Amt: 1.0000 R.Time Date: 6/23/2000 R.Factor Date:
End Time: 11.95 min. End Signal: 0.106 mV Start Time: 0:71 min.
Startsignal: 0.000 mV Solvent Amt: 1.0000
R.Time File: C:\Star\Moclule16\D2887ST20C J2000 1M1001.CDF R.Factor File:
Blank File:
t/3
w
t/3
CQ