1 3/11/15
EXECUTIVE SUMMARY
The purpose of this report is to provide a snapshot of substance dependency, and its related costs, for Barnstable County, Massachusetts. The report is intended to inform programming and policy needs as defined by the Barnstable County Regional Substance Abuse Council (RSAC).
This report was produced by the Barnstable County Department of Human Services. The Department plans, develops and implements programming to improve the delivery of human services, promote health and social well-being, and strengthen community care for all Barnstable County residents.
The RSAC was convened and funded in 2014 by the Barnstable County Department of Human Services after members of the County’s Health and Human Services Advisory Council identified the need for regional coordination around the issue of substance abuse. In particular they identified a need for a systematic and thoughtful approach to connecting the variety of substance abuse related efforts already underway across the region and to develop regional recommendations for further action.
The Barnstable Regional Substance Abuse Council brings together a diverse group of 35 stakeholders representing local government, elected officials, law enforcement, courts, schools, healthcare providers, and community coalitions.
The Council’s goal is to implement a coordinated and comprehensive regional approach to substance abuse across the continuum of prevention, treatment and recovery, harms reduction and criminal justice. The Council utilizes the public health approach which focuses on population health and organized community efforts rather than on individual behavior.
We would like to acknowledge and thank Council members, community members and organizations who provided critical local information and feedback on the report as it was being developed, the Massachusetts Technical Assistance Partnership for Prevention, Health Resources in Action, and the Barnstable County Commissioners for supporting this effort.
The Report
In response to the need for a coordinated regional plan to address substance abuse on Cape Cod, the Barnstable County Regional Substance Abuse Council proposed to measure the impact of substance abuse using a “public health-oriented approach based on the four pillars model of prevention, treatment, harm reduction, and public safety”.1-5i
i
Pugh T, Netherland J, Finkelstein R, Sayegh G, Meeks S, Frederique K. Blueprint for a Public Health and Safety Approach to Drug Policy. New York, NY: New York Academy of Medicine; 2013.
2 3/11/15
This work is innovative in that it closely examines local epidemiological and cost data across the spectrum of state and local entities involved with addressing substance abuse.6 Data were obtained from the sectors of medicine, substance abuse treatment and recovery, prevention, harm reduction (e.g. needle exchange), law enforcement, judiciary, and corrections. The information presented in this report was compiled over a 10-month period (May 2014-February 2015). Data collection and analyses were conducted by staff from the Barnstable County Department of Human Services and Health Resources in Action (HRiA).
The report’s findings are organized by:
1. Epidemiological data on the prevalence and incidence of substance use and associated mortality
2. Cost analysis by substance across the domains of harm reduction, prevention, treatment and recovery, and law enforcement
3. Environmental scan of existing services and resources.
Regional Context
Barnstable County (also interchangeably referred to as Cape Cod in this report) retains a unique social cohesion due to its semi-rural character and geographical remoteness from urban resources. However its age-adjusted rates (per 100,000 residents) of alcohol addiction, drug addiction, accidental overdose, and deaths among adults (18 +) do not differ substantially from those of Massachusetts.
Notably, the county is home to a disproportionately large population of older adults (age 65+), 25%, when compared to Massachusetts (14%).7 This feature has the potential to impact the community’s planning and implementation of region-wide substance abuse prevention and treatment interventions.
Barnstable County youth are at risk for uptake of substance abuse habits during their high school years. In two town-based surveysii high school students self-reported substance-related behaviors at rates that are generally equivalent to their state-wide peers for lifetime and current alcohol use, lifetime marijuana use, lifetime heroin use, and lifetime cocaine and ecstasy use.8 Findings further suggest that current marijuana use, binge drinking, and lifetime use of over-the-counter (OTC) drugs to get high amongst Cape Cod high school students may be higher than statewide rates. However, additional survey data from a representative sample of high school students Cape-wide would be needed to render more conclusive judgment.
Findings
The following is a summary of key findings (figures stated are estimates):
3 3/11/15
Epidemiological Findings
Alcohol addiction is endemic.iii The estimated number of persons addicted to alcohol on Cape Cod (17,063, or 7.9% of the population9-12) outnumbers that of all other substances combined. Although prevalence of substance abuse is lowest amongst older adults, over 2/3 of treatment admissions for older adults are due to alcoholism.13
At least 3.1% of Barnstable County residents are addicted to or dependent upon heroin or prescription opioids (5,691 persons)9,11,14,15, and 3.1% are addicted to “other drugs” (5,691).14,16 This is very likely an under-estimate of the prevalence of heroin/prescription opioid users.
Approximately 27,000 adults (age 18+) and 3,000 children (17 and under) on Cape Cod use marijuana regularly. Approximately 9% of those users are addicted to marijuana (or 2,715 persons)10,12,17.
Mortality rates attributable to alcohol dependence and drug dependence were roughly equal in 2013 (0.80 % and 0.90% respectively). However, an accelerating mortality rate from heroin and prescription opioid overdoses from 2013 through 2014 shows that deaths attributable to this cause are increasing at a much higher rate than deaths attributable to alcohol.
Cost Analysis Findings
The estimated annual direct cost18 of substance abuse in Barnstable County is $110,085,000 (the base year is 2013). These cost findings are summarized in Table 6 of the full report. Direct costs are those costs that are identifiable as being a direct result of substance abuse activity on Cape Cod (e.g. treatment, rehabilitation, arrests, incarceration, prevention).
Annual expenditures on prevention and on community harm reduction in 2013 were less than 1% each of the total direct costs spent on combating substance abuse in Barnstable County; 0.9% for prevention activities, and 0.6% for harm reduction.
Annual expenditures on substance abuse related law enforcement activities in 2013 were approximately $56,900,000 (52% of total), representing expenditures by the Police, Courts, Probation, Sheriff’s Office/Jail, District Attorney’s Office.
iii
Endemic: A disease native to a people or region, or which is regularly or constantly found among a people or specific region. Epidemic: The occurrence of more cases of disease than expected in a given area or among a specific group of people over a particular period of time.
4 3/11/15
Annual expenditures on treatment and recovery activities were approximately $51,457,000 in 2013 (47% of total), representing services from agencies such as Gosnold on Cape Cod, Cape Cod Healthcare, community health centers, emergency medical services, private providers, self-help meetings, and sober living facilities.
Of the total direct costs associated with substance abuse in Barnstable County, approximately 43% are attributable to the abuse of alcohol and 52% are attributable to the abuse of heroin/prescription opioids.
Additional work is needed to further define and analyze the impact of the “Other Drug” category since it represents a non-trivial amount of cost, morbidity, and mortality in the system.
Preliminary work on external costsiv suggests that for every $1 of direct cost there may be, conservatively, a further one to three and a half dollars ($3.5) of productivity costs associated with substance abuse in our community ($110 million to $355 million).
In this analysis we use a Cost-of-Illness19 approach combined with basic cost allocation to estimate the expenditures attributable to substance abuse for agencies and participants in the four domains of prevention, treatment and recovery, harms reduction, and criminal justice. It is important to note that the intent of the costing work presented assumes a 15% margin of error, which the RSAC members have agreed is adequate to provide baseline information that is actionable by the Council. It is recognized that data sources may cross multiple years and be inconsistently available, thus the reported substance abuse-related costs are, at best, estimates.
Key Informant Interviews and Resource Inventory
The report includes a comprehensive environmental scan undertaken by the Department to identify resources and identify gaps in service delivery. A series of key informant interviews were conducted from May 2014 to February 2015. Key informant interviews are qualitative, in-depth interviews of people who have specific knowledge about the topic of substance abuse and related issues in Barnstable County.
A resource inventory of substance abuse-related services in Barnstable County was compiled. The protocol for inclusion of substance abuse sector resources was determined prior to data collection and only those resources that were directly related to addressing substance abuse were considered for inclusion. It is acknowledged that there are a number of organizations that
iv
Direct Costs + External Costs = Total Social Cost. The external costs of substance abuse include those that impact local community and economic environment various ways, for example: lost worker productivity, declining neighborhoods.
5 3/11/15
have tangential effects on substance abuse in Barnstable County, though they are not directly serving substance abuse-related needs. Many of these tangential programs provide prevention-focused services, whose benefits are multifaceted. This resource inventory does not fully represent the resources available to Barnstable County citizens that are located in other areas of the state or country.
Next Steps and Preliminary Recommendations
This report provides a baseline assessment of the epidemiological and financial cost features of substance abuse on Cape Cod and an inventory of community resources involved in addressing the consequences of these behaviors. As a next step the RSAC will offer recommendations for action, a plan for implementing those recommendations, and a timeline for doing so.
Based upon the integration of the key findings of this report, the following are preliminary recommendations for consideration by the Regional Substance Abuse Council to inform their priority setting work.
A. Harm Reduction
i. Increase awareness that addiction is a chronic medical condition.
ii. Educate consumers on the appropriate use and disposal of prescription drugs.
iii. Engage health care professionals, including prescribers and pharmacists, to reduce the negative effects of prescription drug abuse.
iv. Educate the public and policy makers about the importance of harm reduction practices. v. Institute active systematic surveillance of federal, state and locally generated substance
abuse data. B. Prevention
i. Prevention efforts must address alcohol use, non-medical use of prescription drugs, and illicit drugs.
ii. Identify effective prevention interventions and programs which are evidenced-based for use in Barnstable County.
iii. Evaluate current prevention efforts in Barnstable County. iv. Establish a unified substance abuse prevention effort.
C. Treatment and Recovery.
i. Centralize substance abuse treatment referrals to help consumers, families, first responders, schools and providers to be matched with appropriate resources and assisted in navigating the treatment system.
6 3/11/15
ii. Conduct a review of the adequacy of treatment resources available to Cape Cod residents.
iii. Expand recovery support services on Cape Cod, especially for youth and young adults (age 15 to 25). Consideration should be given to developing a recovery high school. iv. Substance abuse clients exiting the criminal justice system could benefit from
evidenced-based case management services as part of re-entry planning/recovery support.
v. Given the impact of addiction on youth and young adults, youth and youth in recovery must be included in the planning process.
D. Criminal Justice/Law Enforcement
i. Support and expand promising community policing programs, substance abuse treatment programs for people in the correction system, re-entry programs and community based supports, and diversion programs such as the drug court and the juvenile and young adult diversion programs.
__________________________
References for Executive Summary
1. Pugh T, Netherland J, Finkelstein R, Sayegh G, Meeks S, Frederique K. Blueprint for a Public Health and Safety Approach to Drug Policy. New York, NY: New York Academy of Medicine; 2013.
2. MacPherson D. A Framework for Action: A Four-Pillar Approach to Drug Problems in Vancouver (Revised) Vancouver, Canada April 24, 2001.
3. Mendes Davidson W. The Public Health Development Theory of Four Stages of Prevention. 2011:13.
4. National Association for Public Health Policy. A public health approach to mitigating the negative consequences of illicit drug abuse. Journal of Public Hlth Policy. 1999; 20(3):268-281. 5. New York Academy of Medicine. New Directions for New York: A Public Health and Safety Approach to Drug Policy: What is a Public Health Approach to Drug Policy? 2013:2. http://www.drugpolicy.org/docUploads/ndny_pubhealth.pdf. Accessed 4/2/2014.
For further information and questions please contact:
Vaira Harik, MS
Senior Project Manager, Barnstable County Dept. of Human Services [email protected]
A full copy of the report is available at: http://www.bchumanservices.net
7 3/11/15
6. The National Center on Addiction and Substance Abuse. Shoveling Up II: The Impact of Substance Abuse on Federal, State, and Local Budgets. Columbia University New York, NY, USA; 2009.
7. MADPH, MADESE. Health and Risk Behaviors of Massachusetts Youth, 2013 (MA YRBS + YHS Results). Boston, MA: MA Dept of Public Health and MA Dept of Elementary and Secondary Education; May 2014.
8. Barnstable County Dept. of Human Services, Stein C. In Focus: The Demographic and Socioeconomic Landscape of Barnstable County. Barnstable, MA: Barnstable County Dept. of Human Services; 2013.
9. MA Health Council. Common Health for the Commonwealth, MA Report on the
Preventable Determinants of Health. Needham, MA: Massachusetts Health Council, Inc; 2014. 10. SAMHSA-CBHSQ. Results from the 2012 National Survey on Drug Use and Health: Summary of National Findings Rockville, MD: SAMHSA; 2013.
11. SAMHSA, RTI. Behavioral Health Barometer: Massachusetts, 2013. Rockville, MD: Substance Abuse and Mental Health Services Administration; 2013.
12. Wagner FA, Anthony JC. From first drug use to drug dependence; developmental periods of risk for dependence upon marijuana, cocaine, and alcohol.
Neuropsychopharmacology. 2002; 26(4):479-488.
13. Lofwall MR, Schuster A, Strain EC. Changing profile of abused substances by older persons entering treatment. Journal of Nervous Mental Disorders. 2008; 196(12):898-905. 14. SAMHSA-CBHSQ. Results from the 2013 National Survey on Drug Use and Health: Summary of National Findings Rockville, MD: SAMHSA; 9/2014.
15. National Institute on Drug Abuse (NIDA). Heroin: What is the Scope of Heroin Use in the United States. Rockville, MD: NIDA; 2014.
16. Greenwald MK, Steinmiller CL. Cocaine behavioral economics: from the naturalistic environment to the controlled laboratory setting. Drug Alcohol Depend. 2014; 141:27-33. 17. Barclay R. Marijuana Addiction is Rare, But Very Real. 7/20/2014.
http://www.healthline.com/health-news/marijuana-addiction-rare-but-real-072014.
18. Federal Reserve Bank. What is the difference between private and social costs, and how do they relate to pollution and production? 2002;
http://www.frbsf.org/education/publications/doctor-econ/2002/november/private-social-costs-pollution-production.
19. Honeycutt AA, Segel JE, Hoerger TJ, Finkelstein EA. Comparing Cost-of-Illness Estimates from Alternative Approaches: An Application to Diabetes. Health Services Research. 2009; 44(1):303-320.
8 3/11/15 TABLE OF CONTENTS Executive Summary 1 1. Introduction 10 2. Methods 16
2.a. Epidemiological Analysis 16
2.b. Cost Analysis 17
2.c. Environmental Scan 19
2.d. Methodological Limitations 22
3. Findings 23
3.a. Epidemiological Findings, by Substance 24
3.b. Cost Analysis Findings, by Domain 30
3.c. External Cost Findings 35
3.d. Environmental Scan and Findings 36
4. Next Steps and Preliminary Recommendations 44
Appendix A. Epidemiology 46
EPI1. Mortality Rates for Substance Abuse-Attributable Conditions in 46 Barnstable County
EPI2. Youth Self-Reported Substance Abuse-Related Behaviors 48 EPI3. Adult Self-Reported Substance Abuse-Related Behaviors 50
Appendix B. Indicators by Domain 52
B.1. Harm Reduction: HR1 to HR6 53
B.2. Prevention: P1. Cost of Prevention Activities, Youth and Adult Focused 55 B.3. Law Enforcement:
LE0. Criminal Justice System Costs Attributable to Substance Abuse in 57 Barnstable County
LE2. Substance Abuse-Related Motor Vehicle Accidents and Costs in
Barnstable County, 2012 59
9 3/11/15
Appendix B. Indicators by Domain (continued) B.4. Treatment and Recovery:
TR0. Summary Analysis of Substance Abuse-Related Treatment and 63 Recovery Costs
TR7. Recovery Community Costs 65
TR. Sub-Analysis: Treatment Admissions to DPH-Licensed Substance 67 Abuse Treatment Programs
TR. Sub-Analysis: Cancer Incidence for Alcohol Abuse-Related 70 Conditions
TR. Sub-Analysis: Incidence of IDU-Related HIV Infection, 2012 72 TR. Sub-Analysis: Incidence of Hepatitis C Infection Attributable to 74
Substance Abuse, 2012
Appendix C. Environmental Scan 75
C.1. Key Informant Interviews and Resource Map 75
C.2. Resource Inventory 77
Appendix D. Data Sourcesand References 82
D.1. Data Sources 82
D.2. References 86
10 3/11/15
1. INTRODUCTION
Throughout the text we refer to Barnstable County and Cape Cod interchangeably.
This report was produced by the Barnstable County Department of Human Services (BCDHS). BCDHS plans, develops and implements programming to improve the delivery of human services, promotes the health and social well-being of County residents, and works to strengthen community care for all Barnstable County residents.
BCDHS organized and staffed the Barnstable County Regional Substance Abuse Council (RSAC) in January 2014 to develop a coordinated and comprehensive regional approach to substance abuse across the continuum of prevention, treatment, criminal justice and recovery. The Council aims to establish a communication infrastructure across towns, providers, organizations and individuals on Cape Cod in order to identify and address gaps and disparities in the service system, and maximize interagency collaboration, funding and resource opportunities.
The purpose of this report is to provide a snapshot of substance dependency, and the related costs, for Barnstable County, Massachusetts. It has been created to inform programming and policy needs to be defined by the Barnstable County Regional Substance Abuse Council. The report provides a portrait of Barnstable County in terms of alcohol and prescription medication misuse and illicit drug use, the consequences resulting from substance use and abuse in terms of morbidity and mortality, insight into associated behaviors (such as motor vehicle crashes and risk of infectious disease), and cost estimates of the impact of substance abuse in Barnstable County.
The RSAC employed a public health approach to examine substance abuse on Cape Cod. Specifically, the Four Pillars Model was utilized to guide analysis2,3 due to its success in describing community-level initiatives to address the problem of substance abuse. In the Four Pillars Model substance abuse behaviors, outcomes, and costs are divided amongst the following four Domains:
1. Harm Reduction 2. Prevention 3. Law Enforcement
11 3/11/15
4. Treatment and Recovery Some definitions will be useful here.
Harm (or “Harms”) and “Harm Reduction”20,21
Physical Harm includes death, illness, addiction, the spread of disease such as HIV/AIDS and hepatitis, and injury caused by drug-related accidents and violence.
Psychological Harm can include fear of crime and violence and the effects of family breakdown.
Societal Harm refers to breakdown of social systems.
Economic Harm includes the large-scale impact of the illegal drug trade and enforcement efforts as well as economic harm to individual users and society, including costs, of decreased and lost productivity, workplace accidents, health care harm, and business and neighborhood economic development.
n.b. Harm to the individual may be physical, psychological, spiritual, social, or economic.
Harm reduction is a set of practical strategies and ideas aimed at reducing negative consequences associated with drug use for both the dependent individual and the community. Examples include needle exchange programs, community policing, and distribution of Narcan (naloxone hydrochloride) to reverse opioid overdose.
“Prevention”22
1. PrimaryPrevention: attempts to prevent substance use altogether or delay the onset of substance use.
2. SecondaryPrevention: addresses the early stages of substance misuse before serious problems have developed.
(Identify and treat asymptomatic persons who have already developed risk factors or pre-clinical disease but in whom the condition is not clinically apparent)
3. TertiaryPrevention: focuses on preventing serious harm to individuals who have become addicted to drugs.
(Care of established disease, with attempts made to restore to highest function, and minimize the negative effects of disease)
12 3/11/15
n.b. Many interventions within the areas of secondary and tertiary prevention can also be referred to as Harm Reduction.
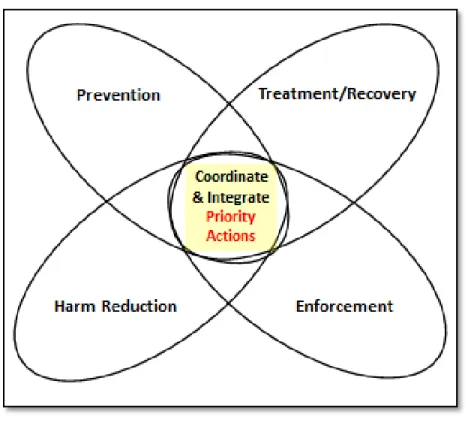
The Four Pillars approach to combating substance abuse can be summarized graphically as follows:
Figure 1. Four Pillars Model to Promote Improved Public Health and Safety
Source: MacPherson, D. (2001). A Framework for Action: A Four-Pillar Approach to Drug Problems in Vancouver (Revised).2
Given the broad analytic scope of this report it should be noted that the data and cost information come from a variety of sources which generally refer to the period 2010 - 2013.
13 3/11/15
Great care has been taken here to note the sources and years of data used. When possible, cost information was extrapolated forward to a reference year of 2013 due to the fact that it is the most recent year for which both epidemiological and cost data are largely complete.
The data gathering and analytic work for this analysis took place between May 2014 and February 2015.
This analysis and report provides the RSAC with the means to begin prioritizing and planning its approach to combating substance abuse within the Cape Community. As shown graphically in Figure 2, doing so will require identifying and then integrating “Priority Actions” based (in part) on the report’s findings in the four domains.
Figure 2. Intersection of Four Pillars Domains Suggests Priority Actions
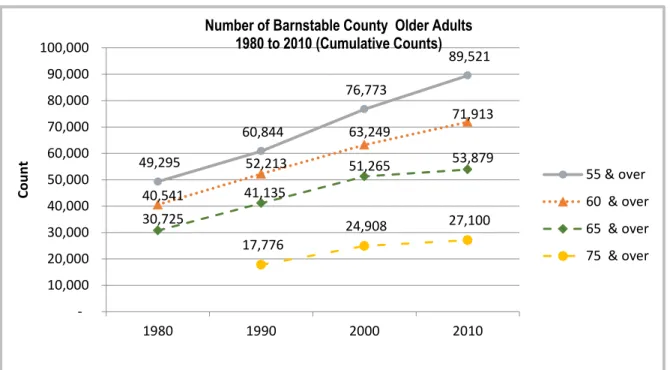
14 3/11/15 49,295 60,844 76,773 89,521 40,541 52,213 63,249 71,913 30,725 41,135 51,265 53,879 17,776 24,908 27,100 10,000 20,000 30,000 40,000 50,000 60,000 70,000 80,000 90,000 100,000 1980 1990 2000 2010 Co u n t
Number of Barnstable County Older Adults 1980 to 2010 (Cumulative Counts)
55 & over 60 & over 65 & over 75 & over
Statewide Context of Substance Abuse Adults
Research shows that the demographic at highest risk for drug abuse, addiction, overdose, and death is persons age 18-44. On Cape Cod 26% of population falls within this age range vs. 38% of the Massachusetts population7. However, Barnstable County’s age-adjusted rates (per 100,000 residents) of adult alcohol addiction, drug addiction, accidental overdose, and deaths do not differ substantially from those of Massachusetts.
Older Adults
Cape Cod is home to a disproportionately large population of older adults (age 65+), 25%, when compared to Massachusetts (14%) and indeed the nation (13%).7 This feature has the potential to impact the community’s planning and implementation of region-wide substance abuse prevention and treatment interventions, at present and into the future, due to the fact that the rates of increase in the population bands that will be aging into the 65+ cohort (namely 55+ and 60+) are relatively high (see Table 1). Specifically, in 2010 the population band aged 55-64 was the single largest in Barnstable County, representing 16.5% of the population.
15 3/11/15
Nationwide, research shows that the prevalence of alcohol and drug abuse and dependence is the lowest amongst persons age 50 and older in the US population.23 Year 2001 data from substance abuse treatment programs (all payors) show that over 75% of admissions for patients age 50+ were for alcoholism, followed by heroin/prescription opioids (14%).23 By 2005 a clear upward trend in admissions for abuse of drugs (largely heroin/prescription opioids, 17%, and cocaine 8.5%) was observed while alcohol abuse, as the primary reason for admission, began a drift downward (69%).13 These trends have continued and are applicable in Barnstable County.
The total population of Barnstable County is expected to fall at a slow but steady rate over the coming 20 years, from 215,888 in 2010 to approximately 210,000 by 2030.24 Consequently, the percentage of older adults is projected to increase significantly during this time period as the Baby Boomer generation continues to age into the 65+ cohort, and therefore the absolute number of people over the age of 65 who are abusing alcohol and drugs is expected to rise.
Youth
Barnstable County youth are at risk for developing substance dependence during their high school years. The most recent data available come from 2012-2013 surveys of youth risk behaviors (one statewide survey, and two community surveys).v In the two towns that completed community surveys, Barnstable County high school students self-reported substance-related behaviors8,25 at rates that are generally equivalent to their state-wide peers for the activities of lifetime (i.e. “ever used”) and current alcohol use (approximately 66% and 35% respectively), lifetime marijuana use (approximately 40%), lifetime heroin use (1%), and lifetime cocaine and ecstasy use (5%).
It appears that current marijuana use amongst Cape Cod high school students, current binge drinking, and lifetime over-the-counter (OTC) drug use to get high could be higher than statewide rates. However, additional survey data from a representative sample of high school students Cape-wide would be needed to render conclusive judgment.
v
Note that the communities of Sandwich and Falmouth are in no way being singled out. These communities’ survey information is the most recent available.
16 3/11/15
It is important to note that in one of the Cape Cod communities surveyed (Falmouth) a community-wide 5-year substance abuse prevention program was very successful in bringing its youth use rates down.26, vi Their experience offers important insight into ways that their program and outcomes could be replicated Cape-wide.
2. METHODS
2.a. Epidemiological Analysis--Methods
Substance use and abuse is a complex issue across the lifespan, and involves a broad societal reach. To fully understand the issue we undertook an indicator development process following the Substance Abuse and Mental Health Services Administration’s (SAMHSA) Four Pillar approach targeting the domains of harm reduction, prevention, law enforcement, and treatment/recovery domains. A literature review of peer-reviewed and published report sources gave us a list of indicators for which our analysis would need data.27-31
Description of Data Sources
Data from a variety of sources were utilized to provide a view of the current situation of substance use and abuse in Barnstable County. Sources include: national and state-administered behavioral surveys (e.g., Behavioral Risk Factor Surveillance Survey, Youth Risk Behavior Surveillance Survey, MA Youth Survey), the U.S. Census and associated community surveys, federal data (e.g., traffic safety administration, FBI), vital records, and hospital discharge databases, among others. A full description of each data source can be found in Appendix D. It is important to note that this report is a compilation of aggregated data from analyses conducted by the agencies which administered the surveys or otherwise collected the information. All data compiled for this report are from the same 5 year period (2010-2014). Efforts were made to obtain the most recent data from all sources.
vi
Sandwich Substance Abuse Task Force. Meeting Minutes of 12/16/2013: Presentation from the Falmouth
17 3/11/15
Criteria for Selection
To create a meaningful report it was first important to establish a set of criteria for selection of the indicators to be included. Indicators that were relevant and timely, with good availability and reliability were sought.
•Relevance: All indicators presented in this report are either directly related to substance abuse, or are evidence-based protective or contributing factors.
•Timeliness: Data included are as recent as possible; older data have been included for comparison in trends over time where available.
•Availability and Reliability: Data needed to be consistently available, and reliable, i.e. comparable from year to year. Many of the indicators therefore came from national surveys conducted at regular intervals, or consistently reported data. In certain instances, data were not available for the local level of Barnstable County; where this is the case, Massachusetts data are included.
2.b. Cost Analysis--Methods
As with the Epidemiological methods describe above, a literature review of peer-reviewed and published report sources provided a list of indicators necessary to conduct cost analyses.
Conservative unit cost estimates32 were produced using data from the following sources:
Key informant interviews and data requests from local agencies and individuals (see section 2.c.)
Publically available local and state budgets and annual reports.
State and national average costs of specified services
In this analysis a Cost-of-Illness19 approach was combined with basic cost allocation to estimate the expenditures attributable to substance abuse for agencies and participants in four domains of the sector. It is important to note that the costing work presented here assumes a 15% margin of error, which the RSAC members have agreed is adequate to provide baseline
18 3/11/15
information that is actionable by the Council. In other words, we recognize that since available data can cross multiple years and can be inconsistently available the substance abuse-related costs that we report are, at best, estimates. They will not be accurate to the penny. However, the belief is that they will represent an order of magnitude that will be important to and sufficient for prioritization of actions by the RSAC.
The cost analysis allocates identified service costs by domain (Harm Reduction, Prevention, Law Enforcement, Treatment/Recovery) and by the main substances abused on Cape Cod (Alcohol, Opiates/Opioids, Marijuana, Other Drugs).
To our knowledge this is an innovative approach to capturing and presenting a community’s substance abuse problem for a particular period of time (1 year—2013).
At its most basic, the analytic matrix can be summarized graphically as follows:
Table 2. Outline of Analytic Matrix
Note that Table 2 above refers to “direct costs”. Simply put, these are costs that are identifiable as being expended as a result of addressing substance abuse on Cape Cod.
Additional cost information of interest to the RSAC is the “external cost” of substance abuse. The external costs of substance abuse include those that impact the local community and
SUMMARY OF COSTS SUBSTANCE ABUSE-RELATED ACTIVITIES IN BARNSTABLE COUNTY DOMAIN Total by Domain Sub-Total Alcohol Sub-Total Heroin/Opiates Sub-Total Marijuana Sub-Total Other Drug HARMS REDUCTION PREVENTION LAW ENFORCEMENT TREATMENT & RECOVERY
Total Estimated Cost of Substance Abuse on Cape Cod
COSTS---19 3/11/15
economic environment in various ways (for example: lost worker productivity, victimization from crime).
It is beyond the scope of the current analysis to estimate the external costs of substance abuse at the same level of detail that direct costs were estimated. Section 3.c. of this report includes a general estimate of external costs that makes use of proportions found in the peer-reviewed literature.
The private cost + external cost equals the total social cost of substance abuse.18
2.c. Environmental Scan--Methods
Key Informant Interviews
As part of a comprehensive environmental scan undertaken by the Department to identify resources and identify gaps in service delivery, a series of key informant interviews were conducted from May 2014 to February 2015. Key informant interviews are qualitative, in-depth interviews of people who have specific knowledge about the topic of substance abuse and related issues in Barnstable County. Representatives from major sectors, including harm reduction, treatment, schools, law enforcement, youth, and people in recovery were identified and included as key informants. The number of individuals interviewed was expanded based on recommendations from initial key informants and members of the Barnstable County Regional Substance Abuse Council. Interview questions varied depending upon the subject expertise of each key informant, but all were asked for their opinion on regional recommendations. At the end of each interview, a 1-2 page interview summary was created that helped to identify themes, issues, and recommendations.
Resource Inventory
A resource inventory of substance abuse-related services in Barnstable County was conductedto identify the specific needs of this community. The protocol for inclusion of substance abuse sector resources was determined prior to data collection and only those resources that were directly related to substance abuse were considered for inclusion.
20 3/11/15
However, it is acknowledged that there are a number of organizations that, though they are not directly serving substance abuse-related needs, are having tangential effects on substance abuse in Barnstable County. Many of these are prevention-focused services, whose benefits are multifaceted. This resource inventory also does not fully represent the resources that are available to Barnstable County citizens that are located in other areas of the state or country. As with the other portions of this analysis, the data collected were organized using a public health framework. Organizations were categorized by their main focus under prevention, harm reduction, treatment/recovery, and law enforcement. Services or organizations that had clearly differentiated departments that fit into different categories under the Four Pillars Approach were recorded in this way in the resource inventory. The resources that were gathered in this inventory were also used in a mapping exercise in order to view the potential geographic influences on service availability (see Figure 3 and Appendix C).
Data were initially collected using internet and database searches. The list was expanded through formal and informal interviews with key informants and experts in the field. The completed inventory of resources was distributed to all RSAC members, and their final input was included.
21 3/11/15
Figure 3. Barnstable County Substance Abuse Services Resource Map
Green pins mark harm reduction activity locations. Yellow pins mark prevention activity locations.
Blue pins mark law enforcement activity and service locations.
22 3/11/15
2.d. Methodological Limitations
Many of the indicators included in these analyses are limited by the data collection methodology. It is important for readers to be aware of the specific source populations of each of the indicators and the potential biases possible. For example, the majority of data on consumption were obtained from self-reported behaviors from large nationally-representative surveys. It is possible that over or under-reporting may have occurred due to survey administration method, perceived desirability of the behavior in question, as well as the socio-demographics of each respondent. Arrest data, crime data and hospital discharges should not be considered comprehensive of all relevant incidents, as not all behaviors or outcomes come into contact with the law or seek medical treatment.
Some costing data in this report are based on national and state averages, and may not be consistent across indicators (i.e., inclusion of different cost domains). Within estimates that used attributable fractions (e.g., crime, morbidity, mortality, and motor vehicle accidents), it is important to note that double-counting may be a concern due to concurrent diagnoses and behaviors. Due to difficulty in accessing certain data at the county level, some of the indicators in this report are based heavily on national or state-level data. Finally, the data user should not consider any one indicator to be representative of the situation of substance abuse in Barnstable County; it is important to consider all the indicators together as presenting an overall picture.
23 3/11/15
3. FINDINGS
a. Epidemiological Findings, by Substance b. Cost Analysis, by Domain
c. External Costs d. Environmental Scan
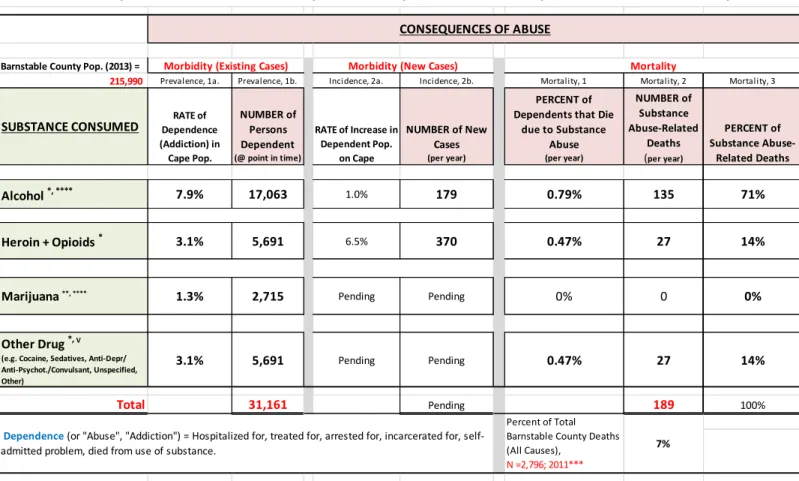
Table 3. Summary of Estimated Annual Morbidity and Mortality Due to Substance Dependence in Barnstable County, 2013.
Sources: 7,9,10,33,34 Barnstable County Pop. (2013) =
215,990
Prevalence, 1a. Prevalence, 1b. Incidence, 2a. Incidence, 2b. Mortality, 1 Mortality, 2 Mortality, 3
SUBSTANCE CONSUMED Dependence RATE of (Addiction) in Cape Pop. NUMBER of Persons Dependent (@ point in time) RATE of Increase in Dependent Pop. on Cape NUMBER of New Cases (per year) PERCENT of Dependents that Die
due to Substance Abuse (per year) NUMBER of Substance Abuse-Related Deaths (per year) PERCENT of Substance Abuse-Related Deaths Alcohol *, **** 7.9% 17,063 1.0% 179 0.79% 135 71% Heroin + Opioids * 3.1% 5,691 6.5% 370 0.47% 27 14%
Marijuana **, **** 1.3% 2,715 Pending Pending 0% 0 0%
Other Drug *, V
(e.g. Cocaine, Sedatives, Anti-Depr/ Anti-Psychot./Convulsant, Unspecified, Other)
3.1% 5,691 Pending Pending 0.47% 27 14%
Total 31,161 Pending 189 100%
Sources:
* Mass. Health Council (2014). Common Health for the Commonwealth: MA Report on the Peventable Determinants of Health, p. 54. (Alcohol addiction @ 7.5% in MA) ** Stein, C. (2013). In Focus: The Demographic and Socioecnomic Landscape of Barnstable County, p. 10.
*** Paul Oppedisano, Director, MassCHIP. 10/7/2014. ****SAHMSA, 2012 (Alcohol addict. @ 8.3% in MA) v Multiple Sources Percent of Total
Barnstable County Deaths (All Causes),
N =2,796; 2011***
7%
Summary of Estimated Annual Morbidity, and Mortality Due to Substance Dependence in Barnstable County
Dependence (or "Abuse", "Addiction") = Hospitalized for, treated for, arrested for, incarcerated for, self-admitted problem, died from use of substance.
CONSEQUENCES OF ABUSE
24 3/11/15
Table 4. Drug and Alcohol-Related Mortality for Barnstable County, by Category, 2002-2011
Total Deaths
(2002-2011)
Avg. Mortality Rate
per 100,000 Pop. Per Year Alcohol-Related 1,368 63 Direct Causes 248 11 Indirect Causes 756 35 Unintentional Injuries 274 13 Intentional Injuries 90 4 Drug-Related 539 25 Direct Causes 367 17 Indirect Causes 34 2 Unintentional Injuries 20 1 Intentional Injuries 118 5 Total 1,907 88
Data Source: Centers for Disease Control and Prevention, National Center for Health Statistics, Compressed Mortality File 1999-201135; Census Bureau, 2010 Census of Population, Public Law 94-171 Redistricting Data file.36
3.a. Epidemiological Findings, by Substance
Alcohol
Table 3 shows that alcohol addiction afflicts more Barnstable County residents (17,063) than does addiction to all other substances combined. Indeed, Massachusetts estimates of alcohol addiction range from 7.5% to 8.3% of the population; for this analysis the mid-point (7.9%) of the two estimates was used in order to estimate the number of Cape Cod residents that are dependent upon alcohol (17,000). The percentage and number would be slightly higher (8.7%) if children under the age of 15 (pre-high school age) were eliminated from the analysis.
It is important here to distinguish between regular use of alcohol versus dependence (“addiction”). The Massachusetts Behavioral Risk Factor Surveillance System (MA BRFSS, 2012) survey and the Massachusetts Youth Risk Behavior Survey (MYRBS, 2013) respectively show regular alcohol use rates of 69% for adults (age 18+) and 36% for high school-age children. Applying this information to Barnstable County results in the finding that approximately 126,000 adults (age 18+) and 3,900 high-school children on Cape Cod use alcohol regularly.
25 3/11/15
Previous research estimates that approximately 12% of these alcohol users become addicted.10,34
While the prevalence of alcohol use is widespread, the incidence (rate of increase new cases) of alcohol addiction is relatively flat9, with approximately 179 new cases appearing per year. Annual deaths attributable to alcohol dependency in Barnstable County are estimated to be 135 per year for the period 2002-2011. Applying that same number forward allows for further estimation that alcohol-related deaths accounted for fully 75% (135 of 181) of all substance abuse-related deaths on Cape Cod in 2013.
Heroin and Opioids
Current figures on prevalence and incidence of heroin/prescription opioid use on Cape Cod are difficult to come by due to the rapid increase in the number of new cases over the past 18 months. This may sound counter-intuitive. Why is this so?
State and local data show a significant increase in admissions for heroin use since 2011 and a related decrease in use of all other opioids.37,38 The broadly-held opinion amongst key informants is that increased scrutiny of prescribing practices has reduced the supply of opioids on the street, and thus increased demand for heroin during the same period. However, it cannot be assumed that these admissions statistics and rates fully reflect the absolute number of dependent persons since not all users will necessarily be seeking treatment and since the number of beds available for treatment does not necessarily meet treatment demand. Additionally, rapid increases in number of overdoses and deaths due to heroin and/or prescription opioid overdose cannot be taken to fully reflect the scope of the problem, since work has not yet been done to differentiate between deaths due to the increased number of users and deaths due to more lethal product concentration or mixture being consumed. What is known is that the number of heroin users is increasing, and so are the number of overdoses and deaths, both state and county-wide.
The Massachusetts Health Council, in its 2014 report entitled “Common Health for the Commonwealth”9 reports that 3.1% of the MA population over the age of 12 is dependent upon
26 3/11/15
drugs. From other sources we learn that the percentage increase in heroin dependence per year ranges from 3% to 10%. Note that 10% is the reported increase in deaths from drug overdose in MA [D. Patrick, 3/27/14 Opioid Emergency Declaration].39 Thus it is estimated that nearly 5,700 residents of Barnstable County were addicted to heroin or prescription opioids in 2013. The mid-point of the 3%-10% range, 6.5%, was selected to estimate the rate of increase of addiction, which yields an estimate of 435 new cases of addiction per year.
The estimate of deaths attributable to heroin/prescription opioid use in 2013 is hampered by the standard lag of approximately 1.5 years in the availability of mortality data from state sources. The mortality data included in the present analysis is from the year 2012. Thus, given the observed spike in heroin use and overdoses since 2011 it is likely that this report underestimates heroin/prescription opioid morbidity and mortality.
Using the rates shown in Table 4, deaths attributable to “drug dependency” are estimated at 54 per year during the period 2002-2011. Lacking more specific information that would allow for the allocation of these deaths between heroin/prescription opioid use versus Other Drugs, they were divided equally, thus allocating 27 deaths to each, and then applying that number to 2013. Again, given the preceding discussion, it is recognized that this very likely under-estimates deaths from heroin/prescription opioid use in Barnstable County in 2013 given the dramatic year over year increased in mortality from this source.
Recently-released information on opioid poisoning deaths by the MDPH Registry of Vital Records and Statistics (December 2014)40,41 provides information for Table 5, below. Based upon the estimates provided in this document, on a population percentage basis Barnstable County’s share could have been 33 deaths in 2013, and 45 in 2014.
27 3/11/15
Table 5. Estimated Fatal Opioid-Related Overdoses Among Massachusetts and Barnstable County Residents, 2012 – 2014. Year Total MA Deaths from Opioidsiii Rate per 100,000 Pop. Estimated Opioid-Related Deaths in Barnstable Countyii
2012 711 10.6 23
2013 1,023 15.3 33
2014i Pending 20.8iv 45v
i
Based upon information from the Barnstable County District Attorney, 2/6/15 (reported in Barnstable Patriot by N. Hoffenberg).42
ii
Estimated population of Barnstable County = 215,990 in 2013 (Source: Census.gov).
iii
Source: MADPH, "Data Brief: Fatal Opioid-Related Overdoses Among MA Residents". December 2014.41
iv
Calculated from Estimated Deaths. v
Source: M. O’Keefe, DA for Cape & Islands, 2/11/2015.43
Marijuana
The MA Behavioral Risk Factor Surveillance System survey among adults (age 18+) (MA BRFSS, 2012)44 and the Massachusetts Youth Risk Behavior Survey (MYRBS, 2013)8 show regular marijuana use rates of 9% for adults (age 18+) and 28% for high school-age children. This apparent contradiction can be resolved with a closer look at the age groupings amongst adult marijuana users. Rates of past month marijuana use among adults age 18-25 are 41% in Massachusetts. The 9% rate just cited encompasses the entire adult population age 18 and over. Thus, approximately 27,000 adults (age 18+) and 3,000 children (17 and under) on Cape Cod use marijuana regularly. Approximately 9% of users become addicted.10
Information on rates of increase in marijuana use, and estimates of new users per year is not available.
This analysis does not show any deaths specifically attributable to marijuana use. However, the data could be missing accidental deaths that, if fully investigated, could yield partial or full attribution to marijuana use.
28 3/11/15
Although marijuana use does not attract attention due to its lack of direct effects on mortality and (as we will see) cost figures, this substance is identified in its own category due to its important role as a “gateway substance” to hard drug use45,46 when abused by children (17 and under) (the other acknowledged gateway substance is alcohol). This important information is especially provided to the RSAC for prevention planning purposes.
Other Drugs
The Other Drugs category ofthe analysis consists of an array of drugs that are not otherwise categorized above; it includes: cocaine (which has low incidence and prevalence), tranquilizers, anti-depressives/psychotics/convulsants, and “other drugs”.47
As with heroin/prescription opioids additional information is not available for this “catch-all” category. The information from the previously-cited Massachusetts Health Council’s 2014 report9 was applied with findings that3.1% of the MA population over the age of 12 is dependent upon drugs. This yields an estimated prevalence of approximately 5,700 persons on Cape Cod who are dependent upon other addictive substances.
Information on rates of increase in Other Drug use, and estimates of new users per year were not available.
From the rate shown in Table 4, deaths attributable to “drug dependency” numbered 54 per year during the period 2002-2011. Lacking more specific information that would allow separation of those deaths into heroin/prescription opioid use versus Other Drugs, we divide them equally, thus allocating 27 deaths to each, and then applying that number to 2013.
29 3/11/15
Summary of Epidemiological Findings for Barnstable County
Alcohol dependence is an endemic problem.
Heroin/Opioid dependence is an epidemic problem in “outbreak” status.vii
With regard to Table 3, mortality attributable to “Alcohol Dependence” (estimated to be 0.80% of dependents) and “Drug Dependence” (estimated to be 0.90% of dependents
)
appeared to be roughly equal in 2013 when viewed as a percentage of total dependent persons. In other words, once you are addicted to alcohol or drugs it appears that the two were equally lethal in the year 2013. However, an accelerating mortality rate from heroin and prescription opioid overdoses from 2013 through 2014 suggests that deaths attributable to this cause are accelerating at a much higher rate than deaths attributable to alcohol.
Marijuana use, although virtually non-lethal, is important to consider in the RSAC’s deliberations since it, along with alcohol, is a gateway substance to the use of harder drugs.
vii
Endemic: A disease native to a people or region, or which is regularly or constantly found among a people or specific region. Epidemic: The occurrence of more cases of disease than expected in a given area or among a specific group of people over a particular period of time.
30 3/11/15
3.b. Cost Analysis Findings, by Domain
The total Direct Costs of substance abuse to the Cape Cod community are estimated to be approximately $110 million.
Note that while the figures in the tables that follow, and elsewhere in this document, appear to be calculated to the dollar they should always be interpreted as estimates only. When practical, figures presented are rounded to the nearest 1,000 or multiples thereof. Additionally, the word “pending” has been inserted to indicate that further costing work is needed.
Appendix B (Indicators by Domain) contains details of this analysis for reference purposes and discusses the methodological approaches taken to compile these findings
Table 6. Summary of Costs of Substance Abuse-Related Activities in Barnstable County
Harm Reduction
Harm reduction is a set of practical strategies and ideas aimed at reducing negative consequences associated with drug use for both the dependent individual and the community. Examples include needle exchange programs, community policing, and distribution of Narcan (naloxone hydrochloride) to reverse opioid overdose.
The 2013 cost of these activities was approximately $700,000, with over 85% of that cost attributable to reducing the harm associated with heroin/prescription opioid use.
SUMMARY OF COSTS SUBSTANCE ABUSE-RELATED ACTIVITIES IN BARNSTABLE COUNTY
DOMAIN Total by Domain Percent of Total Sub-TotalAlcohol Heroin/OpiatesSub-Total MarijuanaSub-Total Other DrugSub-Total
HARMS REDUCTION $ 707,000 0.6% $79,000 $615,000 $13,000 Pending
PREVENTION $1,010,000 0.9% $566,000 $303,000 $141,000 Pending
LAW ENFORCEMENT $56,900,000 51.7% $23,500,000 $33,400,000 Pending Pending TREATMENT & RECOVERY $51,467,000 46.8% $23,030,000 $23,596,000 $751,000 $4,090,000
Total Estimated Cost of Substance Abuse on
Cape Cod $110,084,000 100.0% $47,175,000 $57,914,000 $905,000 $4,090,000
Percent of
Total 43% 53% 1% 4%
COSTS---31 3/11/15
The analysis of harm reduction activities in Barnstable County includes the following: 1. Collection and disposal of excess prescription drugs by local police departments 2. Community-based syringe and needle exchange programs
3. Community-based syringe and needle disposal programs 4. Proactive law enforcement—community policing.
5. Blood borne pathogen training of public workers, and monitoring of public places for substance abuse-related waste
6. Programming to provide education to first responders and community and to provide naloxone (Narcan) to prevent opioid overdose.
In spite of the protective effects of these activities in the midst of a broadly acknowledged epidemic of heroin/prescription opioid use, investment in harm reducing activities is extremely low. The costs of these services are estimated comprise only six-tenths of one percent (0.6%) of the total estimated direct costs of substance abuse on Cape Cod.
Prevention
Substance abuse prevention activities also receive very little funding on Cape Cod, approximately $1 million per year (see Table 7), or approximately 0.9% of total direct costs (Table 6).
Table 7. Substance Abuse Prevention—Youth and Adult Focused
This analysis suggests that the majority the funding that is received (85%) supports prevention of activities that are directed at youth.
Throughout Barnstable County 12 coalitions, non-profit agencies, and local government entities were identified as working in the drug abuse prevention area (see Appendix B, Indicator P1). It remains to be seen if the variety of prevention activities in the community is evidence-based
Substance Youth Adult Total
Alcohol $482,532 $83,076 $565,608
Heroin/Opioids $258,499 $44,505 $303,004
Marijuana $120,633 $20,769 $141,402
$861,665 $148,350 $1,010,015
85% 15%
32 3/11/15
and effective in supporting youth to avoid experimentation and use of illegal substances. As such, there may be opportunities to plan and seek funding for a Cape-wide unified substance abuse prevention effort.
Law Enforcement
Law enforcement activities account for approximately one-half of all substance abuse-related costs in Barnstable County.
Table 8. Summary of Substance Abuse-Related Criminal Justice System Costs
Barnstable County’s estimated substance abuse-related costs of the criminal justice system include:
The 15 police departments in Barnstable County,
The Barnstable County Sheriff’s Office (includes Barnstable County House of Corrections)
The state and local judiciary, including Public Counsel, Trial Court, Superior Court, District Court, Juvenile Court, Probation, Community Corrections, and District Attorney. Law enforcement entities are meaningfully involved in each of the four domains articulated in this report. For example, within the Harm Reduction domain the Town of Barnstable Police Department operates its Community Policing Unit, and it is highly likely that the policing activities of the 14 other town police departments also perform harm reducing activities during
Indicator LE0: Summary of Substance Abuse Related Criminal Justice System Costs
SUMMARY
As of 1/1/2015Sector Total Cost
Alcohol Attributed Heroin/Opioid Attributed Marijuana Attributed Other Drug Attributed
Police $26,939,111 $9,428,689 $17,510,422 Pending Pending
Courts $13,184,811 $6,178,026 $7,006,785 Pending Pending
Sheriff--Jail $15,052,063 $7,052,967 $7,999,096 Pending Pending
Sheriff--Other $1,529,681 $716,765 $812,916 Pending Pending
33 3/11/15
the course of their duties. Within the Prevention Domain both the Barnsttable County Sheriff’s Office and the Barnstable County District Attorney’s Office offer programs for youth that are intended to prevent substance abuse and its related criminal offenses. Within the Treatment and Recovery domain the Barnstable County House of Corrections’s health and counseling services address the needs of substance dependent incarcerated individuals and participate in “release planning” following their incarceration.48
Additional work is needed to learn more about the law enforcement costs associated with marijuana and other drugs.
Treatment & Recovery
Treatment and recovery costs are estimated to account for 47% of total direct costs, or $51.5 million. These costs are associated with the clinical care and psychological rehabilitation of substance abusing patients. Note that the costing of this domain also includes the estimated costs of the “Recovery Community”28 viii on Cape Cod (which includes mutual-support groups and Sober Homes). Table 9presents the treatment and recovery cost findings, summarized by type.
[This space left blank]
34 3/11/15
Table 9. Estimate of Substance Abuse Treatment and Recovery Costs, Inpatient and Outpatient, 2013
Note that private mental health counselors’ costs attributable to counseling clients for substance abuse-related problems are not included in this analysis at this time.
Further work is needed to learn more about the outpatient treatment costs and the recovery community costs associated with marijuana and other drugs.
Estimate of Substance Abuse Treatment and Recovery Costs, Inpatient and Outpatient, 2013
(From Locally Sourced Data)
Treatment Type (Modality) Estimated Cost Alcohol Heroin/ Opioids Marijuana Other Drug
Inpatient Treatment Detox + Hospitalization + Residential Treatment $29,623,832 $15,764,449 $10,246,022 $597,981 $3,015,380
Outpatient Treatment OBOT + Vivitrol + Methadone + Counseling
$15,102,900 $3,523,200 $11,579,700 Pending Pending
Emergency Department Emergency Dept. $3,428,469 $1,981,503 $495,606 $112,650 $838,710
EMS Transport to Hospital Emergency Transport $1,156,072 $663,320 $216,053 $40,936 $235,763 Recovery Community Self-Help Meetings +
Sober Homes $2,156,318 $1,097,480 $1,058,838 Pending Pending
$51,467,591 $23,029,952 $23,596,219 $751,567 $4,089,853
45% 46% 1% 8%
Alcohol Heroin/ Opioids Marijuana Other Drug
Sources and Linked Sheets: South Ba y: Intervi ew, 10/7/14
Gos nol d: Sub-s heet i n P1, Prevention--Youth-Focus ed a nd Adul t Focus ed Cos ts .xl s x Ca pe Cod Hea l thCa re: Revi s ed Di rect by Subs tance Cons umed_Rev6, VH Ana l ys i s 12-18-14.xl s x * Metha done a nd OBOT/MAT Trea tment: Sub-s heet i n thi s workbook = TR4_Tx_MAT_Cos t
Attribution to Substance: Percentages & Costs
Total Estimated Expediture in Barn. County for Substance Abuse Treatment and Recovery
35 3/11/15
3.c. External Costs—Preliminary Findings
An important component of the impact of substance abuse on a community is that of the external burdens and expenses. Lost economic productivity costs are usually employed in these calculations. Additional features of external costs include a process of establishing the monetary value of reduction in quality of life and other qualitative indicators. Such qualitative factors are beyond the scope of the present analysis.
The factors used to estimate local productivity costs are based on rates found in the peer-reviewed alcohol and drug abuse literature.
The most recent national estimate of the productivity costs associated with drug abuse come from the 2011 US Dept. of Justice’s National Drug Threat Assessment “Economic Impact of Illicit Drug Use on American Society”.49 This report finds that productivity costs account for 62% of all costs attributable to drug abuse.
With regard to alcohol abuse-related costs Sacks et al. (2006)50 suggests that productivity costs account for 76% of total alcohol abuse costs.
The straight average rate of the two is 69%.
Thus a rough estimate of the productivity costs for Barnstable County is calculated as follows:
Productivity Cost = (Direct Cost, $110,085,000/(1- 0.69) = $355,113,000
This figure provides only a starting point for estimating these costs. It suggests that for every $1 of direct cost there may be, conservatively, a further one to three and a half dollars ($3.50) of productivity costs associated with substance abuse in our community ($110 million to $355 million).
36 3/11/15
3.d. Environmental Scan—Findings
3.d.1. Harm Reduction
The main provider of harm reduction programs in Barnstable County is the AIDS Support Group of Cape Cod (ASGCC). The substance abuse harm reduction services at the ASGCC include opioid overdose education and prevention training through the use of nasal Narcan and HIV and Hepatitis C testing and counseling. The ASGCC also runs a needle exchange program, one of only six in Massachusetts. The Barnstable County Health Department assists the AIDS Support Group with this work.
In key informant interviews with prevention and education staff of the ASGCC, Hepatitis C testing was recognized as an important and underdeveloped area in substance abuse harm reduction. Informants cited low availability of rapid hepatitis C testing kits and high percentages of positive test results among the young injection drug using population as evidence of the need for more focus in this area.
Local police departments have a role in harm reduction in the form of proactive law enforcement engagement with high risk groups. Examples of this work include preventative measures such as high-visibility patrol and specialized units (i.e. Barnstable Police Department’s Community Impact Unit). Key informants from this sector reported that not all police departments have the resources required to form specialized units in response to specific substance abuse needs, but they were recognized as a useful strategy in proactive law enforcement. In addition, prescription drug disposal kiosks or drop boxes are located in all police department lobbies, providing a safe and secure way for the public to dispose of unwanted and/or expired medications.
The impact of unused prescription medication and other medical waste such as discarded syringes was identified as an important community-focused harm reduction sector. The Cape Cod Cooperative Extension has worked in this area to provide public education about disposal of unused prescription medication and sharps. Syringe and needle disposal, however, continues to be a problem in the community, as reported by local police departments and
37 3/11/15
town public works departments. Opportunities for linkages between blood-borne pathogen training providers and public works employees/law enforcement were identified by key informants.
3.d.2. Law Enforcement
Law enforcement strategies for reduction of substance use and abuse involve many areas of the criminal justice system, including police, courts, and correctional facilities. Law enforcement involvement in substance abuse often occurs after the onset of dependent use of illicit or licit substances.
In addition to local policing by individual police departments in all 15 towns in Barnstable County, there are a number of ongoing collaborative efforts. The Cape Cod Drug Task Force is headed by the Massachusetts State Police, with participation from the District Attorney’s Office, Sheriff’s Department, all local police departments, and court officials. The Street Crimes Unit was organized by the Barnstable Police Department and works in collaboration with neighboring police departments. These groups focus the large majority of their effort on stopping the supply of illicit substances from entering and being sold in Barnstable County. In key informant interviews with police officials from various towns, informants reported that between 50% and 85% of all of their calls for service were related to substance abuse. They noted that many arrests often relate to substance abuse, even if the charges were not violations of laws prohibiting the possession or distribution of illegal drugs. Interviewees reported that larceny and other similar charges are often related to the need for money to support continued use, and that domestic disputes often involve substance use, especially alcohol. Law enforcement key informants identified alcohol as the most common substance of abuse contributing to calls for service. Due to this, police officers find it difficult to distinguish how many of their calls for service were related to licit or illicit substance abuse. Key informants in law enforcement identified a number of concerns regarding their work as it pertained to substance abuse, including treatment options and availability for those seeking voluntary help. There were a number of barriers noted, including insurance options, transportation, and legal barriers for police officers interacting with medical professionals,