Abstract—Business intelligence (BI), which has proven to be a key strategy to improve business benefits and performance, is a crucial need for information and communications technology (ICT) industry. Data warehousing and reporting are two concepts that BI provides to create meaningful information from integrated data. Microsoft offers SQL server reporting services (SSRS) as a reporting solution to provide a ready to use, scalable, versatile platform to create, deploy and manage reports. There are numerous studies that define data warehouse and reporting, their components, usage and benefits in the literature. In addition to such studies, this paper presents implementation scenarios of taking reports from different data sources to show difference between taking report from operational database and data warehouse by using Adventureworks database.
Index Terms—Adventureworks, business intelligence, data warehouse, reporting examples, SQL server reporting services.
I. INTRODUCTION
Business Intelligence (BI) is set of solutions and methodologies that enable companies to produce significant information more quickly and accurately to make proper decisions [1]. There are many concepts that BI provides to create meaningful information from integrated data. Data warehousing and reporting are two of those concepts.
Reporting and analysis are fundamental benefits of BI solutions that help companies to track and improve their business performance. Reporting is basically the summary of the business performance and activities that are performed to determine which actions would be taken in upcoming years [2], [3].
Reports can be generated directly from an operational database or data warehouse if it exists. This paper suggests reporting from data warehouse rather than operational database because of the performance gain on report generation and also to avoid performance loss on on-going operations.
II. MICROSOFT SQLSERVER REPORTING SERVICES
Most of the BI solutions include reporting elements which provide standard business reports. Microsoft offers SQL Server Reporting Services (SSRS) as a server-based
Manuscript received March 2, 2015; revised June 3, 2015.
D. Gunduz and E. Arslan is with the Department of Computer Engineering, Faculty of Engineering, Istanbul University, 34320, Avcilar, Istanbul, Turkey (e-mail: derya.gunduz@outlook.com, earslan@istanbul.edu.tr).
M. E. Azizler is with Business Information Systems, Bogazici University, Hisar Campus, 34342, Bebek/İstanbul (e-mail: ergaziz@gmail.com).
reporting solution to provide a ready to use, scalable, versatile platform to create, deploy and manage reports. SSRS is a core part of Microsoft’s BI platform. It is compatible with different data sources include multidimensional, relational, xml based sources [4]. It provides programming features to customize reports. Complex reports which serve detailed information via sub-reports and graphs, can be designed and generated quickly with SSRS [5]. All editions of Microsoft SQL servers even the free versions include SSRS. SSRS offers Report Designer, Report Builder, Power View and Report Server as report authoring environments.
There are many considerations when planning a detailed design of the report solution depending on the specific business requirements. Business requirements must include information about the required reports by finding out the answers of the questions such as what reports are required, what data sources are required to support the report, who are the audiences for the reports, how and when will reports be delivered, what render formats are required and are there any requirements for the self-service reporting [6].
Required data source and determination of how the reporting tools will access the data should be taken into consideration before planning the design. According to the needs, tools can reach the data directly from the data source in some cases, whereas in some others you may need the data which is processed with Extract, Transform and Load (ETL) operations. ETL systems are commonly used to transfer data from an operational database to a data warehouse. For this purpose, ETL extracts data from the source system, transforms the content of the data to the data warehouse schema and loads it into the data warehouse.
Data warehouse is assumed to be the brain of the BI solutions as it is the central data repository which all reporting and analysis are based on. We need a structure which will decrease the load of operational databases. These needs are recompensed by the data warehouses. Business data is consolidated into a data warehouse which makes the data easier to be analyzed or to be used to generate reports [2].
III. IMPLEMENTATION SCENARIO EXAMPLES OF SQL SERVER REPORTING SERVICES
For the following implementation scenario examples, SQL Server Data Tools, set up with SQL Server 2012 is used as the development tool. Report Server is used as report authoring environment. Adventureworks database is a sample database generated by Microsoft which is an
Implementation Scenarios of Reporting from Data
Warehouse for Business Intelligence
operational database of multinational corporations that manufacture and sell bicycles and cycling accessories [5]. The selected examples show the effectiveness of BI in terms of data management and reporting.
Reports can be generated from different data sources. In the proposed implementation scenario, we are going to prepare two reports with similar results while one of them is generated from the operational database and the other is from the data warehouse. The purpose of this example is to reveal the difference between these two databases in terms of performance and querying.
A. Creation of Reports with Operational Database In this implementation scenario we will report Adventureworks Company’s sales by filtering year, month and employee [7]. The first step of designing a report is to add the data source. For the first report we are supposed to have Adventureworks2012 database on SQL server which we use as the database source. Fig.1 and Fig. 2 denote how to add a new shared data source. Instead of using pre-created shared data source, we can use new data source.
Fig. 1. New shared datasource screen.
Secondly we need datasets from the source database. We need to think about tables related to employee, month, year, sales, and category of sold products. For the scenario we will be using two datasets. The example report will be filtered by employee, month and year values.
Since user will be asked to select employee name as filtering, we need collection of the employee names and identities which reflected by BusinessEntityID column. With the script in SQL Code 1, employees who made sales are listed.
SQL Code 1
Fig. 2. Connection properties screen.
We need to add parameters for showing the filtering items. The parameter screen for Employee item is shown in Fig. 3. EmployeeID refers to main report script’s employee filter.
Fig. 3. Report parameter properties screen.
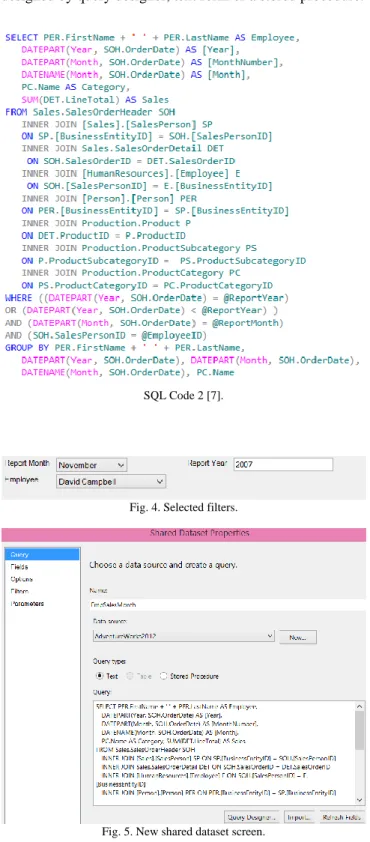
For the second dataset we need information about product categories and sales. Dataset named as EmpSalesMonth is created for this purpose as shown in SQL Code 2.
@ReportYear,@ReportMonth,@EmployeeID parameters in WHERE clause of the sql script will be filled from selected values via the user interface as shown in Fig. 4. The user interface is generated by the configurations done in Fig. 3. It
reports the sales on behalf of the selected year and earlier than the selected year sales. The report shows sales both with graphical and a table view grouped by category and year.
Dataset screen is shown in Fig. 5. SQL script can be designed by query designer, text form or a stored procedure.
SQL Code 2 [7].
Fig. 4. Selected filters.
Fig. 5. New shared dataset screen.
The report outputs are the graphic as shown in Fig. 6 (a) and tables as shown in Fig. 6(b), when we select the parameters as shown in Fig. 4. Results show employee named David Campbell’s sales on different categories in 2005, 2006 and 2007.
B. Creation of Report with Data Warehouse Database For the second scenario we get the report result from a different database. We add AdventureworksDW2012 as
source of the report.
Fig. 6. (a) Total amount of Sales in 2005, 2006, 2007.
Fig. 6. (b) Distribution of sales.
All of the steps for this report will be the same with the first scenario except the data source and the dataset. Dataset that retrieves employee information is created by the query in SQL Code 3.
SQL Code 3.
Compared to the first scenario, this script is linked to just one table to get employee information.
query in SQL Code 4 is used.
SQL Code 4.
Number of tables used in data warehouse database is less than the tables used in operational database. In data warehouse, transactions or events are kept in fact tables whereas dimensions correspond to objects like people and items. To show the sales transactions, FactResellerSales table is used. The fact table is joined with dim tables to find product category, date and employee.
C. Comparison of the Two Scenarios
For the two implementation scenarios, main datasets, EmpSalesMonth and EmpSalesMonthDW, SQL scripts are compared in terms of time results found in Table I and Table II.
TABLEI:EMPSALESMONTH DATASET SCRIPT OF OPERATIONAL DATABASE Channels Trial 5 Trial 4 Trial 3 Trial 2 Trial 1 Average Client processing time 355 219 594 752 156 415.2 Total execution time 2107 1821 2314 7123 1593 2991.6 Wait time on server replies 1752 1602 1720 6371 1437 2576.4 TABLEII:EMPSALESMONTHDW DATASET SCRIPT OF DATA WAREHOUSE
DATABASE Channels Trial 5 Trial 4 Trial 3 Trial 2 Trial 1 Average Client processing time 15 125 47 47 94 65.6 Total execution time 718 796 781 648 734 735.4 Wait time on server replies 703 671 734 601 640 669.8
We generated the same reports five times for two different scenarios. Depending on the obtained results, average total execution time of the report taken from the data warehouse is faster (more than 3 times) than the report taken from the
operational database. Wait time on server replies are more than 4 times faster for the data warehouse. There is an obvious performance difference between two scenarios.
Here are some implications highlights that indicate how data warehouse can out-perform than the operatıonal database:
Due to the fact that there is ongoing operations, producing reports or making analysis directly from operational databases may take a long time and cause slowdowns on actual operations.
Tables in a data warehouse are de-normalized, which may decrease the number of tables and increase the volume of the saved information.
The columns’ names in the data warehouse are given meaningful to be directly used in the reports. Therefore, we don’t have to rename the columns or change their alias.
During the creation of data warehouse, improving the data quality and data cleansing are done with the help of Extract, Transform and Load (ETL) operations. For instance, the same expression can be written in different formats. When the data is transformed into a form of the data warehouse, these conflicts are handled and all types refer to the original one,
Without having advanced IT knowledge, users can produce their own reports with data warehouse, leading to “Self Service BI” [8],
Data warehouse has drill down capability in which user can reach the details underlying summaries on Key Performance Indicator (KPI), graphics, dashboards and reports [8].
IV. CONCLUSION
This paper confirmed the necessity of BI solutions for reporting in Information and Communications Technology (ICT) industry to take effective results and proper decisions based on the significant information more quickly and accurately in the growing competitive environment [2]. We first examined BI solutions for reporting and focused on Microsoft’s reporting solution to show the effectiveness of BI in terms of implementation aspects by considering example scenarios. The scenarios generate the same report from different data sources. We have compared reports taken from the data warehouse and the operational database. We tried to generate the same reports from different data sources for five times. Experiment results show that reports taken from data warehouse give much better performance than the reports taken from the operational database. This paper highly recommends using the data warehouses rather than the operational databases to create consistent reports.
REFERENCES
[1] J. Mundy, W. Thornthwaite, and R. Kimball, SQL Server 2008 R2 and the Microsoft Business Intelligence Toolset.
[2] D. Gunduz, E. Arslan, and Z. Orman, "A generic implementation framework for business intelligence,” in Proc. Clute Institute International Business and Education Conference, San Francisco. [3] F. Azma and M. A. Mostafapour, “Business intelligence as a key
[4] Microsoft Msdn Reporting Services (SSRS). [Online] Available: https://msdn.microsoft.com/en-us/library/ms159106.aspx
[5] DMC, SQL Server Reporting Services, Editing Data with Microsoft
SQL Server Reporting Services.
[6] Designing Business Intelligence Solutions with Microsoft® SQL Server® 2012, Microsoft Corporation, Product Number: 20467B. [7] Adventureworks Sample Reports 2008 R2. [Online] Available:
http://msftdbprodsamples.codeplex.com/releases/view/89245. [8] James Serras’s Blog. Why You Need a Data Warehouse. [Online]
Available:
http://www.jamesserra.com/archive/2013/07/why-you-need-a-data-wa rehouse/
D. Gunduz was born in Mardin, Turkey, in 1988. She
has studied in Eskisehir Osmangazi University in Computer Engineering Department. She is studying as a master student at Istanbul University in Computer Engineering Department.
She is working for Ericsson Turkey as a CRM software developer since 2013.
E. Azizler was born in Uşak, Turkey, in 1987. He has
studied in Istanbul technical University in Mathematics Engineering Program. He is studying in business information systems M.A. program in Bogazici University.
He is working for Ericsson Turkey as a CRM software developer since 2012.
E. Arslan was born in Istanbul, Turkey, in 1977.
She received the B.Sc. and M.Sc. degrees from Trakya University, Edirne, Turkey, and Ph.D. degree from Istanbul University, Istanbul, Turkey, in 2001, 2004 and 2011, respectively.
She is currently working as an assistant professor in the Department of Computer Engineering, Istanbul University.
Her research interests are artificial neural networks, natural language processing, image processing applications and intelligent systems.
Author’s formal photo