https://doi.org/10.1038/s41586-019-1144-0
XFEL structures of the human MT
2
melatonin
receptor reveal the basis of subtype selectivity
Linda C. Johansson1,2,14, Benjamin Stauch1,2,14, John D. McCorvy3,13, Gye Won Han1,2, Nilkanth Patel1,4, Xi-Ping Huang3,5,
Alexander Batyuk6, Cornelius Gati7,8, Samuel t. Slocum3,5, Chufeng Li9,10, Jessica M. Grandner1,4, Shuming Hao1,2,
reid H. J. Olsen3, Alexandra r. tribo3, Sahba Zaare9, Lan Zhu10, Nadia A. Zatsepin9,10, Uwe Weierstall9,10, Saïd Yous11,
raymond C. Stevens1,2,4, Wei Liu10, Bryan L. roth3,5,12*, Vsevolod Katritch1,2,4* & Vadim Cherezov1,2,4*
The human MT1 and MT2 melatonin receptors1,2 are G-protein-coupled receptors (GPCRs) that help to regulate circadian rhythm and sleep patterns3. Drug development efforts have targeted both receptors for the treatment of insomnia, circadian rhythm and mood disorders, and cancer3, and MT
2 has also been implicated in type 2 diabetes4,5. Here we report X-ray free electron laser (XFEL) structures of the human MT2 receptor in complex with the agonists 2-phenylmelatonin (2-PMT) and ramelteon6 at resolutions of 2.8 Å and 3.3 Å, respectively, along with two structures of function-related mutants: H2085.46A (superscripts represent the
Ballesteros–Weinstein residue numbering nomenclature7) and
N862.50D, obtained in complex with 2-PMT. Comparison of the structures of MT2 with a published structure8 of MT1 reveals that, despite conservation of the orthosteric ligand-binding site residues, there are notable conformational variations as well as differences in [3H]melatonin dissociation kinetics that provide insights into the selectivity between melatonin receptor subtypes. A membrane-buried lateral ligand entry channel is observed in both MT1 and MT2, but in addition the MT2 structures reveal a narrow opening towards the solvent in the extracellular part of the receptor. We provide functional and kinetic data that support a prominent role for intramembrane ligand entry in both receptors, and suggest that there might also be an extracellular entry path in MT2. Our findings contribute to a molecular understanding of melatonin receptor subtype selectivity and ligand access modes, which are essential for the design of highly selective melatonin tool compounds and therapeutic agents.
To improve the low surface expression and stability of wild-type MT2, we introduced eight point mutations on the basis of homology to
other class A receptors: D862.50N (ref. 9), L108ECL1F, F1293.41W (ref. 10),
N1373.49D, C1403.52L, W2646.48F, A3057.50P, and N3128.47D; these were
essential for determination of the high-resolution structure of both MT2 and MT18. To promote crystal contacts, we used a double-fusion
approach, with rubredoxin11 in the intracellular loop 3 (ICL3) and
ther-mostabilized apocytochrome b562RIL (BRIL)11 attached to the receptor
N terminus. Radioligand binding assays revealed a 120-fold reduction in melatonin binding affinity (approximately 30-fold reduction at phys-iological concentration of NaCl), probably owing to stabilization of the crystallized construct in an inactive ‘low agonist affinity’ state that is deficient in G-protein coupling and signalling9,12 (Extended Data
Table 1). All four MT2 structures were obtained using lipidic cubic
phase (LCP)13 crystallization (Extended Data Fig. 1, Extended Data
Table 2). The overall receptor conformation was similar in all four
structures (Cα root mean squared deviation (r.m.s.d.) < 0.3 Å), so we used the highest resolution MT2–2-PMT structure in the analysis below
unless otherwise noted.
MT2 adopts the canonical seven-transmembrane-domain (7TM)
fold of class A receptors, with the short amphipathic helix VIII parallel to the membrane on the intracellular side (Fig. 1a). As in MT18, the
7TM bundle of MT2 is found in an inactive conformation. Restoration
of the function-impairing D862.50N mutation (Extended Data Table 3)
allowed us to solve the MT2(N86D)–2-PMT structure at a lower
reso-lution and showed that this mutation had no major effect on the overall
1Bridge Institute, USC Michelson Center for Convergent Biosciences, University of Southern California, Los Angeles, CA, USA. 2Department of Chemistry, University of Southern California, Los
Angeles, CA, USA. 3Department of Pharmacology, University of North Carolina at Chapel Hill, Chapel Hill, NC, USA. 4Department of Biological Sciences, University of Southern California, Los Angeles, CA, USA. 5National Institute of Mental Health Psychoactive Drug Screening Program, University of North Carolina at Chapel Hill, Chapel Hill, NC, USA. 6Linac Coherent Light Source, SLAC National Accelerator Laboratory, Menlo Park, CA, USA. 7Bioscience Division, SLAC National Accelerator Laboratory, Menlo Park, CA, USA. 8Department of Structural Biology, Stanford University, Stanford, CA, USA. 9Department of Physics, Arizona State University, Tempe, AZ, USA. 10School of Molecular Sciences and Biodesign Center for Applied Structural Discovery, Biodesign Institute, Arizona State University, Tempe, AZ, USA. 11Université de Lille, CHU Lille, Inserm, UMR-S 1172 - JPArc - Centre de Recherche Jean-Pierre AUBERT Neurosciences et Cancer, Lille, France. 12Division of Chemical Biology and Medicinal Chemistry, Eshelman School of Pharmacy, University of North Carolina at Chapel Hill, Chapel Hill, NC, USA. 13Present address: Department of Cell Biology, Neurobiology and Anatomy, Medical College of Wisconsin, Milwaukee, WI, USA. 14These authors contributed equally: Linda C. Johansson, Benjamin Stauch. *e-mail: [email protected]; [email protected]; [email protected] N1754.60 N2686.52 Q194ECL2 F192ECL2 IV VI c b d 90° VIII VI V I II III IV VII a IV III II VII I VI V Extracellular Intracellular V204 M120 Y294 G121 L181 A297 Y298 H N O N H O N175 Q194 T191 Y200 F192 V205 N268 V89 V124 Y94 T201 L267 I187
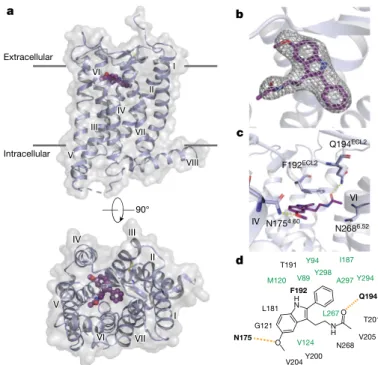
Fig. 1 | Overview of the MT2 structure. a, Overview of MT2 (violet)
shows the canonical 7TM topology, with the ligand 2-PMT (purple) in the binding pocket. A 90° view shows the receptor from the extracellular side. Approximate membrane boundaries are shown as grey lines.
b, 2mFo − DFc density (grey mesh) of 2-PMT contoured at 1σ. c, Binding
pocket of MT2 is about 50 Å3 (7%) larger than that of MT1, with most
of the volume difference attributed to the region around the alkylamide tail and the hydrophobic subpocket that accommodates substituents of melatonin analogues in our structures (Fig. 1d, Extended Data Fig. 2b). These regions have a key role in MT2 selectivity, as discussed below.
Structural analysis of MT2 revealed an opening between helices IV
and V from the orthosteric ligand binding site to the membrane (Fig. 2a). This channel is similar to that seen in MT1, but is more
con-stricted (around 2.6 Å in diameter at the narrowest part). Comparison of the structures of MT2 and MT1 revealed that Y2005.38 in MT2 makes
a hydrogen bond to N1754.60, constricting the channel, whereas in MT1
it adopts a different conformation, pointing towards the lipid interface
(Fig. 2a–c, Extended Data Fig. 2c, d). In our MT2(H208A)–2-PMT
structure, mutating H2085.46 near the channel entrance to alanine
further closes off the opening by an approximately 0.9 Å inward shift of helix V (Extended Data Fig. 4). This finding suggests that H2085.46
helps to control the channel entrance, albeit only moderately influ-encing ligand affinity and receptor function in MT2 (Extended Data
Tables 1, 4). Further analysis of the MT2 structures revealed a potential
secondary access route to the orthosteric binding site from the sol-vent-exposed extracellular (ECL) region (Fig. 2d). This second opening has a slightly larger diameter (about 2.5–3 Å) and is lined by aromatic Y2947.39 and hydrophilic T191ECL2 and Q194ECL2 residues (Fig. 2e). In
MT1, the corresponding residues Q181ECL2 and Y2817.39 adopt different
conformations, completely sealing off this entrance (Fig. 2f).
90° H2085.46 Y2005.38 A1714.56 2-PMT 2-PMT H1955.46 Y1875.38 A1584.56
MT2 MT1
Extracellular
Intracellular
90°
Extracellular
Intracellular
a b c
d MT1 Y2817.39 0° MT2 Y2947.39 Q194ECL2 T191ECL2 Q181ECL2 T178ECL2 e f 2-PMT 2-PMT MT2 MT1
0 2 4 6 8 10 12 2
4 6
Channel depth (Å) Minimum diameter (Å
) 0 2 4 6 8 10 12 14 16
2 4 6
Opening dept h (Å) Minimum diameter (Å)
g MT2 [3H]melatonin dissociation
channel mutants
0 25 50 75
100 WT: 227 ± 10H2085.46A: 110 ± 8.3
Y2005.38A: 7.6 ± 0.83
A1714.56M: 1,316 ± 25
0 60120180240300360420480540600660720 Time (min) [ 3H]me la tonin bound
(% specific binding)
h 0 25 50 75 100 0 60120180240300360420480540600660720 Time (min)
WT: 37 ± 3.3 Y1875.38A: 8.5 ± 1
A1584.56M: 588 ± 14
MT1 [3H]melatonin dissociation
channel mutants
[
3H]me
la
tonin bound
(% specific binding)
0 25 50 75 100
0 60 120 180 240 300 360 420 480 Time (min)
WT: 227±10 T191ECL2A: 23.3 ± 1.1
Q194ECL2A: 13.6 ± 0.9
Y2947.39A: 10.3 ± 0.7
MT2 [3H]melatonin dissociation
extracellular mutants
[
3H]me
la
tonin bound
(% specific binding) 0 25 50 75 100
0 60 120 180 240 300 360 420 480 Time (min)
WT: 37±3.3 T178ECL2A: 8.3 ± 2 Q181ECL2A: 6.9 ± 0.9 Y2817.39A: 24.4 ± 3.3
MT1 [3H]melatonin dissociation
extracellular mutants
[
3H]me
la
tonin bound
(% specific binding)
MT2
e, A 90° view through the ECL opening in MT2, highlighting three residues
discussed in the text. f, The same view as in e of MT1 (green), showing
a different conformation of Y2817.39 that seals the ECL opening. g, [3H]
Melatonin dissociation kinetics for MT2 membrane channel mutants (top)
and ECL opening mutants (bottom). h, As in g for MT1. Residence time
(koff−1) in g and h is given in minutes. Data are shown as mean ± s.e.m. for n = 3 independent experiments.
Fig. 2 | Two possible ligand entries in MT2. a, View of the
membrane-buried channel in MT2. Inset, channel diameter profile across its length
for MT1 and MT2. b, A 90° view of the channel in MT2, highlighting three
residues discussed in the text. c, The same view as in b of MT1 (green)
showing a different conformation of Y1875.38 that widens the channel
compared to MT2. d, View of the ECL opening found in MT2 (violet)
with 2-PMT (purple). Inset, ECL opening profile across the length.
receptor conformation, as also supported by molecular dynamics sim-ulations (Supplementary Fig. 1). Structural comparison of
MT2 and MT1—which share 68% sequence identity—revealed
notable overall similarity (Cα r.m.s.d. < 0.6 Å), with all ligand-interacting residues conserved8 (Fig. 1d, Extended Data Fig. 2c).
There is a common phar-macophore between receptor subtypes that consists of aromatic stack-ing of the ligand core with F192ECL2, as
well as hydrogen bonds between the methoxy group of 2-PMT and N1754.60 and between the alkyla-mide tail of the ligand and
Q194ECL2 (Fig. 1c, d). The stability of these ligand-anchoring
interactions was confirmed by molecular dynamics simulations
(Extended Data Fig. 3). Further, mutation of F192ECL2 to
isoleucine or alanine caused loss of ligand binding and signalling (Extended Data Tables 1, 4), as also observed for MT18. In contrast
to MT1, however, mutation of N1754.60 to alanine in MT2 did not
impair receptor function, which indicates that this residue has different roles in the activation of the two receptor subtypes. Mutation of either Q194ECL2 or N2686.52 to alanine had only minor effects on
receptor ligand affinity, receptor activation or stability (Extended Data Tables 1, 4, 5), whereas the double mutation Q194ECL2A/
N2686.52A results in a marked loss of receptor activity (Extended
Data Tables 4, 5), which suggests that these residues show functional redundancy in MT2. Notably, despite the binding site
residues being conserved between the two receptors, we observed subtle conformational differences between them, such as in the side chains of Y2005.38 and Y2947.39 and in the backbone region
sur-rounding P1744.59 (Extended Data Fig. 2d). Furthermore, the
To test the relative importance of these two putative binding site access routes, we performed kinetic ligand dissociation studies on both receptors using [3H]melatonin as a tracer. The ligand residence time
(koff–1) is substantially longer in wild-type MT2 than in MT1,
which sug-gests that the narrower membrane entry channel restricts ligand access (Fig. 2g, h). Mutation of the membrane channel-lining residue Y5.38A,
designed to widen the access channel, caused a 30-fold decrease in residence time for MT2 (with similar ligand affinity), while the
corre-sponding mutation in MT1 caused a more-modest decrease in residence
time, consistent with the wider channel and a different conformation of Y5.38 in MT1. To constrict the channel, we mutated A4.56, a key residue
at the interface of helices IV and V in both receptors, into a bulkier methionine. This mutation markedly increased residence time for both receptors (Fig. 2g, h), reaching up to 20 h in MT2, which suggests that
this channel is important for ligand access in both receptors.
When we tested mutations designed to widen the ECL opening in both receptors, ligand residence time was reduced more than tenfold in MT2 mutants T191ECL2A and Q194ECL2A, and roughly fivefold with the
equivalent ECL2 mutations in MT1 (Fig. 2g, h). The MT2(Y2947.39A)
mutant showed an even greater decrease in ligand residence time (22-fold) relative to the wild type, whereas the equivalent MT1 mutant
showed a similar residence time to the wild type. These differences can be reconciled if ligand site access through the ECL entrance is more important in MT2 than in MT1, consistent with the crystal structures, in
which residue Y2947.39 adopts a different conformation in MT2, allowing
easier ligand egress through the ECL opening.
The elucidation of high-resolution structures of both melatonin receptor subtypes and published ligand structure–activity relationship (SAR) data14,15 allowed us to establish a model of receptor subtype
ligand selectivity. To this end, we used molecular docking of several available selective ligands to both receptors. Docking of the
moder-ately MT1-selective compound 5-hydroxyethoxy-N-acetyltryptamine
(5-HEAT)16 and the bitopic ligand CTL 01-05-B-A058 suggests that—
although an extension or substitution of the R1 position by a linear alkyl
chain can be accommodated by the membrane access channel in both MT1 and MT2 (Fig. 3a, c)—the narrower MT2 channel renders binding
of the extended portion of the bitopic ligands suboptimal owing to potential steric clashes. Accordingly, the H2085.46A mutation in MT
2
abolished the efficacy of CTL 01-05-B-A05 as a Gi agonist (Extended
Data Fig. 4d), probably by further restricting the channel and/or elimi-nating the hydrogen bond between H2085.46 and CTL 01-05-B-A05 that
was observed in docking to MT18. This mutation had a negligible effect
on monotopic ligand binding and function (Extended Data Tables 1, 4, 5), which suggests that a sufficiently wide membrane channel (as in MT1) is essential for accommodation of bitopic ligands.
The MT2-selective ligands IIK7 and DH97 (both of which are about
90-fold selective)17,18 adopt ‘tail up’ binding modes similar to that of
2-PMT, with their alkylamide tails (R2 position in Fig. 3b, c) interacting
with Q194ECL2. By contrast, in MT1 the longer alkylamide tails of these
ligands avoid this upward tail position owing to steric clashes, and can adopt only suboptimal ‘tail down’ conformations. Bulky substituents in the R3 position confer MT2 selectivity by using the larger hydrophobic
subpocket of the receptor (Fig. 3b, c). In summary, our analysis suggests that R1 substituents are important for MT
1 selectivity, while R2 and R3
mostly convey selectivity towards MT2 (Fig. 3c). The slightly larger
binding site in MT2 also helps to achieve selectivity, as reflected by the
larger number of compounds that are moderately selective for MT2
(Extended Data Fig. 5).
Subtype-selective compounds are desirable owing to the involvement of MT2 in type 2 diabetes, for which a number of single nucleotide
polymorphisms (SNPs) have been reported4,5. When we mapped these
sites onto our MT2 structure, we observed clustering of residues in
the vicinity of the ligand binding pocket and on the receptor surface, along the membrane interface of helices I and II and the intracellular G-protein and β-arrestin binding regions (Fig. 4). The exposed positions b
a
H1955.46
N1624.60
N2556.52
F192ECL2 Y2817.38
T178ECL2
L168ECL2
H2085.46
N1754.60
V2045.42
N2686.52 A2977.42
Y2987.43
F192ECL2 Y2947.38
T191ECL2 L181ECL2 F2646.48 Q194ECL2 Q181ECL2 Y2005.38 V1915.42 V2065.44 V1935.44 Y2857.43 IIK7 DH97 c HN N H O R1 R2 R3 Melatonin N H O HN O 5-HEAT O HN N H O HO CTL 01-05-B-A05 O NH O O O HN O O N NH O A2847.42
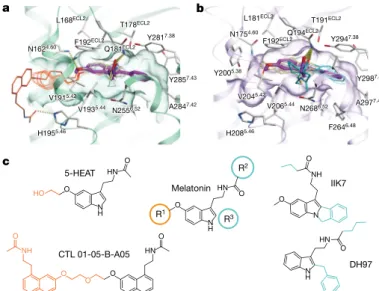
Fig. 3 | Selectivity determinants of ligands at MT1 and MT2. a, Docking of selective ligands into MT1 (green), with 2-PMT (purple)
from the crystal structure shown as reference. Ligands selective for MT1
(compounds 63, 64, 65a, and 65b)17 are shown in grey. Two representative
ligands, 5-HEAT16 and CTL 01-05-B-A058 are coloured pale yellow,
with their selectivity-conferring substituents (R1 position) shown in
orange. b, Docking of ligands into MT2 (violet), with 2-PMT (purple)
shown as reference. Non-selective (tasimelteon, TIK30117) and selective
(UCM101420, K18517, and 4P-PDOT17) ligands are shown in grey. Two
representative ligands, DH9718 and IIK717 are coloured pale yellow, with
selectivity-conferring substituents (R2 and R3 positions) shown in cyan.
Predicted hydrogen bonds are shown as dotted lines in a, b. c, Melatonin SAR, in which R1 substituents confer MT
1 selectivity (orange), and
substituents in R2 and R3 positions confer MT2 selectivity (cyan). See
Supplementary Table 1 for a list of all docked ligands.
VIII VI V I II III IV VII A74 R138 T201 G109 R316 V124 R154 Y141 A42 P95 A52 L60 Y308 P36 R231 D246 K243 M146 S123 R222 F250 I223 M120 L166
Fig. 4 | MT2 mutations implicated in type 2 diabetes. Mapping of
residues implicated in type 2 diabetes4,5 onto the MT
2 crystal structure.
of these residues could point to their involvement in interactions with intracellular and membrane partners. Other instances of SNPs asso-ciated with type 2 diabetes include P952.59L of the YPYP motif, which
is involved in receptor stability and function in MT18, and mutations
in known microswitches such as R1383.50H/L/C of the E/DRY motif19
and Y3087.53S of the NPXXY motif12. Although none of the analysed
SNPs is involved in direct interactions with melatonin, the M1203.32I/V
and V1243.36I variants are located in the hydrophobic subpocket of the
receptor, which could influence ligand binding and affect subsequent signalling pathways4,5.
The structural basis of melatonin receptor subtype selectivity revealed here has the potential to inspire a new generation of highly selective pharmacological tools that will help to further dissect the melatonin system. We also provide insights into differences in ligand entry between the two receptors by demonstrating the potential of MT2
to support extracellular ligand access to the binding pocket. This dif-ference in ligand entry can be exploited to facilitate melatonin recep-tor subtype selectivity, as the ECL route in MT2 could accommodate
more polar compounds compared to the membrane-buried channel. We therefore expect that our results will lead to new therapies involving these pleiotropic receptors, aimed at—but not limited to—the treat-ment of type 2 diabetes, cancer and sleep disorders.
Online content
Any methods, additional references, Nature Research reporting summaries, source data, statements of data availability and associated accession codes are available at https://doi.org/10.1038/s41586-019-1144-0.
Received: 28 July 2018; Accepted: 26 March 2019; Published online 24 April 2019.
1. Reppert, S. M., Weaver, D.R. & Ebisawa, T. Cloning and characterization of a mammalian melatonin receptor that mediates reproductive and circadian responses. Neuron 13, 1177–1185 (1994).
2. Reppert, S. M. et al. Molecular characterization of a second melatonin receptor expressed in human retina and brain: the Mel1b melatonin receptor. Proc. Natl
Acad. Sci. USA 92, 8734–8738 (1995).
3. Liu, J. et al. MT1 and MT2 melatonin receptors: a therapeutic perspective. Annu.
Rev. Pharmacol. Toxicol. 56, 361–383 (2016).
4. Bonnefond, A. et al. Rare MTNR1B variants impairing melatonin receptor 1B function contribute to type 2 diabetes. Nat. Genet. 44, 297–301 (2012). 5. Karamitri, A. et al. Type 2 diabetes-associated variants of the MT2 melatonin
receptor affect distinct modes of signaling. Sci. Signal. 11, eaan6622 (2018). 6. Kato, K. et al. Neurochemical properties of ramelteon (TAK-375), a selective
MT1/MT2 receptor agonist. Neuropharmacology 48, 301–310 (2005). 7. Ballesteros, J. A. & Weinstein, H. Integrated methods for the construction of
three-dimensional models and computational probing of structure-function relations in G protein-coupled receptors. Meth. Neurosci. 25, 366–428 (1995).
8. Stauch, B. et al. Structural basis of ligand recognition at the human MT1 melatonin receptor. Nature https://doi.org/10.1038/s41586-019-1141-3 (2019).
9. White, K. L. et al. Structural connection between activation microswitch and allosteric sodium site in GPCR signaling. Structure 26, 259–269.e5 (2018). 10. Roth, C. B., Hanson, M. A. & Stevens, R. C. Stabilization of the human
β2-adrenergic receptor TM4–TM3–TM5 helix interface by mutagenesis of
Glu1223.41, a critical residue in GPCR structure. J. Mol. Biol. 376, 1305–1319
(2008).
11. Chun, E. et al. Fusion partner toolchest for the stabilization and crystallization of G protein-coupled receptors. Structure 20, 967–976 (2012).
12. Audet, M. & Bouvier, M. Restructuring G-protein- coupled receptor activation.
Cell 151, 14–23 (2012).
13. Caffrey, M. & Cherezov, V. Crystallizing membrane proteins using lipidic mesophases. Nat. Protocols 4, 706–731 (2009).
14. Rivara, S., Mor, M., Bedini, A., Spadoni, G. & Tarzia, G. Melatonin receptor agonists: SAR and applications to the treatment of sleep-wake disorders.
Curr. Top. Med. Chem. 8, 954–968 (2008).
15. Bento, A. P. et al. The ChEMBL bioactivity database: an update. Nucleic Acids
Res. 42, D1083–D1090 (2014).
16. Nonno, R. et al. A new melatonin receptor ligand with mt1-agonist and MT2-antagonist properties. J. Pineal Res. 29, 234–240 (2000).
17. Zlotos, D. P., Jockers, R., Cecon, E., Rivara, S. & Witt-Enderby, P. A. MT1 and MT2 melatonin receptors: ligands, models, oligomers, and therapeutic potential.
J. Med. Chem. 57, 3161–3185 (2014).
18. Teh, M. T. & Sugden, D. Comparison of the structure-activity relationships of melatonin receptor agonists and antagonists: lengthening the N-acyl side-chain has differing effects on potency on Xenopus melanophores. Naunyn
Schmiedebergs Arch. Pharmacol. 358, 522–528 (1998).
19. Valentin-Hansen, L. et al. The arginine of the DRY motif in transmembrane segment III functions as a balancing micro-switch in the activation of the
β2-adrenergic receptor. J. Biol. Chem. 287, 31973–31982 (2012).
20. Spadoni, G. et al. Highly potent and selective MT2 melatonin receptor full agonists from conformational analysis of 1-benzyl-2-acylaminomethyl-tetrahydroquinolines. J. Med. Chem. 58, 7512–7525 (2015).
Acknowledgements We thank M. Chu, C. Hanson, K. Villers, and J. Velasquez for help with cloning and expression, T. Grant for XFEL data processing, and H. Shaye for technical support. This work was supported by the National Institutes of Health grants R35 GM127086 (V.C.), R21 DA042298 (W.L.), R01 GM124152 (W.L.), U24DK116195 (B.L.R.), R01MH112205 (B.L.R.), the NIMH Psychoactive Drug Screening Program and the Michael Hooker Distinguished Professorship to B.L.R. and F31-NS093917 (R.H.J.O.), the STC Program of the National Science Foundation (NSF) through BioXFEL (No. 1231306) (B.S., U.W., W.L., N.A.Z., V.C.), NSF ABI grant 1565180 (C.L, N.Z., U.W.), HFSP long-term fellowship LT000046/2014-L (L.C.J.), postdoctoral fellowship from the Swedish Research Council (L.C.J.) and EMBO ALTF 677-2014 (B.S.). Parts of this research were carried out at the LCLS, a National User Facility operated by Stanford University on behalf of the US Department of Energy and supported by the US Department of Energy Office of Science, Office of Basic Energy Sciences under Contract No. DE-AC02-76SF00515. This research benefited from the use of credits from the National Institutes of Health (NIH) Cloud Credits Model Pilot, a component of the NIH Big Data to Knowledge (BD2K) program.
Reviewer information Nature thanks Christian Siebold, Ieva Sutkeviciute, Jean-Pierre Vilardaga and the other anonymous reviewer(s) for their contribution to the peer review of this work.
Author contributions L.C.J., B.S., V.K., and V.C. conceived the project, analysed data, and wrote the paper with contributions from all authors. L.C.J. and B.S. designed, optimized, purified and characterized receptor constructs for structural studies and crystallized the receptor, prepared crystal samples and figures, solved and refined the structures, and assisted in generating mutant constructs for binding and functional analyses. J.D.M., X.-P.H., and S.T.S. performed radioligand binding and functional experiments, assisted in making mutant and wild-type constructs, and analysed binding and functional data. L.C.J., B.S., A.B., L.Z., W.L., and V.C. collected XFEL data. S.Z. and U.W. operated the LCP injector during XFEL data collection. S.H., L.Z., and W.L. assisted in XFEL sample preparation. A.B., C.G., C.L., and N.A.Z. processed XFEL data. L.C.J., G.W.H. and A.B. determined the structures. L.C.J. and G.W.H. performed the structure refinement and quality control. N.P., J.M.G., and V.K. designed mutants for radioligand and functional studies, and performed molecular docking and molecular dynamics simulations. R.H.J.O. and A.R.T. assisted with molecular biology and functional experiments. S.Y. synthesized the bitopic compound, analysed data, and edited the paper. R.C.S. contributed to study design and selection of chemical compounds for receptor stabilization and functional characterization, supervised protein expression, and edited the paper. B.L.R. supervised pharmacological experiments and edited the paper. V.K. supervised molecular docking and molecular dynamics calculations. V.C. coordinated and supervised the whole project.
Competing interests The authors declare no competing interests.
Additional information
Extended data is available for this paper at https://doi.org/10.1038/s41586-019-1144-0.
Supplementary information is available for this paper at https://doi.org/ 10.1038/s41586-019-1144-0.
Reprints and permissions information is available at http://www.nature.com/ reprints.
Correspondence and requests for materials should be addressed to B.L.R., V.K. or V.C.
MEthodS
No statistical methods were used to predetermine sample size. The experiments were not randomized and the investigators were not blinded to allocation during experiments and outcome assessment.
Design and expression of MT2 crystallized construct. The DNA sequence of
human MT2 receptor (UniProt21 identifier P49286) was synthesized by GenScript
with optimization for expression in insect cells. The crystallized construct (MT2-CC) has truncations of N-terminal residues 1–30 and C-terminal residues
341–362. The thermostabilized apocytochrome BRIL (UniProt P0ABE7) from
Escherichia coli with mutations M7W, H102I and R106L was fused to the trun-cated N terminus of MT2 with a six-residue linker (GDGARP). Another fusion
protein, rubredoxin (Rub, UniProt P00268), was fused in ICL3, replacing recep-tor residues 232–240. For construct optimization (to increase monodispersity, thermostability and crystallizability), the following point mutations were added: D862.50N9, L108ECL1F, F1293.41W10, N1373.49D, C1403.52L, W2646.48F, A3057.50P
and N3128.47D (see the accompanying paper8 for details). The MT2-CC coding
sequence was subcloned into a modified pFastBac1 (Invitrogen) vector, with a haemagglutinin (HA) signal sequence and a Flag tag on the N terminus and a PreScission protease cleavage site followed by a 10× His tag on the C terminus. The receptor was expressed in Spodoptera frugiperda cells (Sf9, purchased from ATCC, CRL-1711, authenticated by supplier using morphology and growth characteristics, certified mycoplasma-free), which were collected and stored as described in the accompanying paper8.
Purification of MT2-CC. Insect cell membranes were prepared by thawing
fro-zen cell pellets in a hypotonic buffer containing 10 mM HEPES (pH 7.5), 10 mM MgCl2, 20 mM KCl, and homemade protease inhibitor cocktail. Extensive washing
of the raw membranes was performed by repeated Dounce homogenization and centrifugation in hypotonic buffer (once), followed by high osmotic buffer contain-ing 1.0 M NaCl, 10 mM HEPES (pH 7.5), 10 mM MgCl2, 20 mM KCl, and
home-made protease inhibitor cocktail (two or three times), thereby separating soluble and membrane-associated proteins from integral membrane proteins. Stocks (100 mM) of 2-PMT (Tocris) and ramelteon (Apex Biosciences) were dissolved in DMSO. Washed membranes were resuspended into a buffer containing 50 μM 2-PMT or ramelteon, 2 mg ml–1 iodoacetamide, and homemade protease inhibitor
cocktail, and incubated at 4 °C for 30 min before solubilization. The membranes were then solubilized in 50 mM HEPES (pH 7.5), 150 mM NaCl, 1% (wt/vol)
n-dodecyl-β-d-maltopyranoside (DDM, Anatrace), 0.2% (wt/vol) cholesteryl hem-isuccinate (CHS, Sigma-Aldrich) at 4 °C for 3 h. The supernatant was isolated by centrifugation at 60,000g for 50 min, and incubated in 20 mM HEPES (pH 7.5), 800 mM NaCl with Talon (immobilized metal affinity chromatography IMAC) resin (Clontech) overnight at 4 °C. After binding, the resin was washed with twenty column volumes of wash buffer 1 (50 mM HEPES (pH 7.5), 50 μM 2-PMT or ramel-teon, 800 mM NaCl, 10% (vol/vol) glycerol, 0.1% (wt/vol) DDM, 0.02% (wt/vol) CHS, 10 mM imidazole), followed by ten column volumes of wash buffer 2 (50 mM HEPES (pH 7.5), 50 μM 2-PMT or ramelteon, 150 mM NaCl, 10% (vol/vol) glyc-erol, 0.05% (wt/vol) DDM, 0.01% (wt/vol) CHS, 50 mM imidazole). The protein was then eluted in minimal volumes of elution buffer (50 mM HEPES (pH 7.5), 50 μM 2-PMT or ramelteon, 150 mM NaCl, 10% (vol/vol) glycerol, 0.02% (wt/vol) DDM, 0.01% (wt/vol) CHS, 220 mM imidazole). PD MiniTrap G-25 columns (GE Healthcare) were used to remove imidazole. The protein was then treated over-night with His-tagged PreScission protease (GenScript) to cleave the C-terminal His-tag. PreScission protease and the cleaved C-terminal fragment were removed by binding to Talon IMAC resin for 1.5 h at 4 °C. The protein was collected as the TALON IMAC column flow-through. The ligand concentration was increased to 100 μM, and the protein was concentrated to 30–40 mg ml–1 with a 100-kDa
molecular mass cut-off Vivaspin centrifuge concentrator (Sartorius).
Protein stability assays. The stability of purified MT2-CC was analysed using
a microscale thermostability assay22 using Rotorgene (QIAGEN). In brief,
1–5 μg of protein was mixed with 1.5 μM 7-diethylamino-3-(4′ -maleimidylphe-nyl)-4-methylcoumarin (CPM) dye (2.5 mM stock in DMSO) in 25 mM HEPES pH 7.5, 150 mM NaCl, 0.02% DDM (wt/vol), 0.004% CHS (wt/vol), 10% glycerol (vol/vol), and indicated concentrations of compounds to a final volume of 100 μl. Samples were incubated for 15 min at 20 °C and then heated gradually from 25 °C to 95 °C at a rate of 2 °C min–1, monitoring CPM fluorescence (excitation 365 nm,
emission 460 nm). The melting temperature (Tm) was determined using the
deriva-tive of the resulting melting temperature curve after background subtraction using Prism 7.0 (GraphPad).
Crystallization. Purified MT2-CC in complex with 2-PMT or ramelteon was
reconstituted into LCP by mixing it with molten lipid using a mechanical syringe mixer13. The protein–LCP mixture contained 40% (wt/wt) receptor solution, 54%
(wt/wt) monoolein, and 6% (wt/wt) cholesterol. Crystallization trials were per-formed in 96-well glass sandwich plates (Marienfeld) using an NT8-LCP robot (Formulatrix) by dispensing 40 nl of protein-laden LCP and 800 nl of precipitant solution per well. Plates were incubated and imaged at 20 °C using an automatic
incubator/imager (RockImager 1000, Formulatrix). Initial crystal hits were iden-tified in a condition containing 100 mM HEPES, pH 6.8, 30% (vol/vol) PEG 400, 100 mM NH4CH3CO2. These crystals, approximately 30 × 30 × 70 μm3, were
collected using micromounts (MiTeGen) and flash-frozen in liquid nitrogen for data collection at a microfocus synchrotron source. After extensive optimization, the best crystals diffracted to about 3.0 Å resolution, but suffered from radiation damage, resulting in a 3.5 Å complete dataset. Additives had no effect on diffraction quality. Microcrystals for SFX data collection were prepared in gas-tight syringes (Hamilton) as previously described23. After optimization, diffraction-quality
crys-tals were obtained from 100 mM ADA pH 5.8–6.5, 24–28% (vol/vol) PEG 400, 10–200 mM NH4CH3CO2, 50 μM 2-PMT or ramelteon, by injecting 5 μl of protein-
laden LCP into 50 μl precipitant in syringes. Before loading the microcrystals into the LCP injector, excess precipitant was removed and 7.9 monoacylglycerol (MAG) lipid was added to the LCP to absorb any residual precipitant solution and to prevent crystalline phase formation upon rapid cooling when injecting LCP into vacuum24.
Crystallographic data collection. Data collection was performed at the
Coherent X-ray Imaging (CXI)25 end station of the Linac Coherent Light Source
(LCLS), which operated at a wavelength of 1.3 Å (9.83 keV) delivering individual X-ray pulses of 30 and 43 fs pulse duration and approximately 1011 photons
per pulse focused into a spot size of approximately 1.5 μm in diameter using a pair of Kirkpatrick–Baez mirrors. Microcrystals (Extended Data Fig. 1c) of MT2 (approximately 5 × 5 × 5 μm3) were delivered in the LCP medium using
an LCP microextrusion injector24 with 50-μm nozzle running at a flow rate
of approximately 300 nl min−1. Diffraction images were recorded at a rate of
7,200 patterns per minute (120 Hz) with the 2.3 Megapixel Cornell-SLAC Pixel Array Detector (CSPAD)26. Initial diffraction frames were corrected and
fil-tered using the software package Cheetah27. A crystal ‘hit’ was defined as an
image containing a minimum of 20 diffraction peaks with a signal-to-noise ratio above 4 and a number of pixels above 3. After further refinement of parame-ters (peak detection, prediction and integration), images were indexed using MOSFLM28, DirAx29, and XDS30 and integrated and merged into a final dataset
using CrystFEL v.0.6.2 software suite31. Integration radii of 3, 5, and 6 pixels
with per pattern resolution cut-offs 1.0 nm–1 above the conservative resolution
estimates for each crystal were applied (push-res option), otherwise default val-ues were used. The total numbers of collected images/hits/indexed images are as follows: 2,154,963/84,928/31,677 (MT2-CC–2-PMT), 476,863/59,071/28,130
(MT2-CC(H208A)–2-PMT), 293,060/22,267/20,704 (MT2-CC(N86D)–2-PMT),
727,004/60,005/28,834 (MT2-CC–ramelteon). As a resolution cutoff, the
crite-rion32 of CC∗>0.5 was used for all datasets (see Extended Data Table 2 for data statistics). The space group was determined to be P21, with two molecules per
asymmetric unit.
Structure determination. To solve the 2.8 Å resolution MT2-CC–2-PMT
struc-ture, a search model was generated as follows: the MT2 receptor sequence was
sent to the HHpred server33, and the output models were reduced by removing
all low-resolution (<3.0 Å) and NMR structures. The RCSB Protein Data Bank (PDB) files of the top ten hits were downloaded and prepared with Sculptor34.
The models were structurally superimposed, and the side chains were pruned, yielding the conserved receptor core model. The model that produced a successful molecular replacement solution with Phaser35 (TFZ score of 14.9 and LLG of 320)
was based on the C-C chemokine receptor 2 structure (PDB ID: 5T1A)36. This
solution containing two receptor molecules was fixed as a partial solution, and the search continued with rubredoxin (PDB ID: 1IRO), in which one molecule was placed in the asymmetric unit. The resulting three-component solution was subjected to several rounds of refining with phenix.refine37 and model building
with phenix.autobuild38 followed by manual refinement in Coot39. BRIL (PDB
ID: 1M6T) was then used independently as a search model for remaining fusion partners in the asymmetric unit. The second BRIL was manually modelled into the electron density; however, no density could be found for the second rubredoxin molecule, which, therefore, was not modelled in the final structure. This rubre-doxin fusion partner is likely to be disordered and does not participate in crystal contacts, however, there is space for it in the crystal lattice (Extended Data Fig. 1d). A zinc ion was modelled in rubredoxin as previously described40. Refinement and
model completion were performed by repetitive cycling between Refmac541 or
autoBUSTER v.2.10.242 and manual rebuilding in Coot39 using both 2mF o − DFc
and mFo − DFc maps. Ligand restraints for refinement of 2-PMT and ramelteon
coordinates were generated by Prodrg43. For the other three datasets, the MT2
-CC–2-PMT structure was used as a search model for molecular replacement, and the refinement procedure was repeated as described above. The Ramachandran plot obtained by MolProbity44 shows that, with the exception of Y92 from the
YPYP motif, all residues are in the favoured/allowed regions: 95.4/4.4% of residues (MT2-CC–2-PMT), 93/6.8% of residues (MT2-CC(H208A)-2-PMT), 94.8/5.0% of
residues (MT2-CC(N86D)-2-PMT), 95.3/4.5% of residues (MT2-CC–ramelteon).
Extended Data Table 2. Figures containing electron density and molecular struc-tures were generated using PyMol45.
Channel profile calculations. The channel diameter profile along its length was
calculated with CAVER analyst v.2.046 using default parameters. Further details
can be found in the accompanying paper8.
Molecular docking. MT2 receptor ligands obtained from the ChEMBL database15
were docked into the 2-PMT-bound crystal structures using an energy based dock-ing in ICM-Pro v3.8-647 as described in the accompanying paper8.
Molecular dynamics simulations. The experimental structure of MT2 was
prepared and subjected to molecular dynamics simulations as described in the accompanying paper8. The simulation periodic box had dimensions (x, y, z) of
75.5 Å, 75.5 Å, 105.4 Å, and contained lipids (129 POPC molecules), 10,281 water molecules, 26 sodium ions, and 36 chloride ions.
Radioligand binding assays. Equilibrium binding assays were performed and
ana-lysed as described in the accompanying paper8. HEK293T cells were obtained from
ATCC (CRL-11268, authenticated by supplier using morphology, growth charac-teristics and short tandem repeat profiling, certified mycoplasma-free). For kinetic studies, to initiate dissociation of [3H]melatonin, 10 μl of cold excess melatonin
(10 μM) was added per well at specific time points ranging from 2 min to 10 h, and immediately at time = 0 min plates were collected. Dissociation experiments were performed at 25 °C for MT1 and 37 °C for MT2 because of the slow kinetics
in MT2. For all assays, non-specific activity was defined by the addition of 5 μM
2-PMT. Ligand dissociation data were analysed using ‘Dissociation-One phase exponential decay’ to yield estimates of koff using GraphPad Prism 7.0.
MT2 Gi/o-mediated cAMP inhibition assay. MT2 Gi/o-mediated cAMP inhibition
assays were performed in HEK293T cells as described in the accompanying paper8.
Reporting summary. Further information on research design is available in
the Nature Research Reporting Summary linked to this paper.
Data availability
Structure factors and coordinates were deposited in the Protein Data Bank under the following accession codes: 6ME6 (MT2-CC–2-PMT), 6ME7
(MT2-CC(H208A)–2-PMT), 6ME8 (MT2-CC(N86D)–2-PMT), 6ME9 (MT2-CC–
ramelteon).
21. UniProt Consortium, T. UniProt: the universal protein knowledgebase. Nucleic
Acids Res. 46, 2699 (2018).
22. Alexandrov, A. I., Mileni, M., Chien, E. Y., Hanson, M. A. & Stevens, R. C. Microscale fluorescent thermal stability assay for membrane proteins. Structure 16, 351–359 (2008).
23. Liu, W. et al. Serial femtosecond crystallography of G protein-coupled receptors.
Science 342, 1521–1524 (2013).
24. Weierstall, U. et al. Lipidic cubic phase injector facilitates membrane protein serial femtosecond crystallography. Nat. Commun. 5, 3309 (2014).
25. Boutet, S. W. G. J. The Coherent X-ray Imaging (CXI) instrument at the Linac Coherent Light Source (LCLS). New J. Phys. 12, 035024 (2010).
26. Hart, P. et al. The CSPAD Megapixel X-ray Camera at LCLS. In X-ray Free-electron
Lasers: Beam Diagnostics, Beamline Instrumentation and Applications (eds.
S. P. Moeller, S. P. et al.) 85040C–85012 (2012).
27. Barty, A. et al. Cheetah: software for high-throughput reduction and analysis of serial femtosecond X-ray diffraction data. J. Appl. Crystallogr. 47, 1118–1131 (2014).
28. Battye, T. G., Kontogiannis, L., Johnson, O., Powell, H. R. & Leslie, A. G. iMOSFLM: a new graphical interface for diffraction-image processing with MOSFLM.
Acta Crystallogr. D 67, 271–281 (2011).
29. Duisenberg, A. J. M. Indexing in single-crystal diffractometry with an obstinate list of reflections. J. Appl. Crystallogr. 25, 92–96 (1992).
30. Kabsch, W. Xds. Acta Crystallogr. D 66, 125–132 (2010).
31. White, T. A. et al. Recent developments in CrystFEL. J. Appl. Crystallogr. 49, 680–689 (2016).
32. Karplus, P. A. & Diederichs, K. Linking crystallographic model and data quality.
Science 336, 1030–1033 (2012).
33. Zimmermann, L. et al. A completely reimplemented MPI bioinformatics toolkit with a new HHpred server at its core. J. Mol. Biol. 430, 2237–2243 (2018).
34. Bunkóczi, G. & Read, R. J. Improvement of molecular-replacement models with Sculptor. Acta Crystallogr. D 67, 303–312 (2011).
35. McCoy, A. J. et al. Phaser crystallographic software. J. Appl. Crystallogr. 40, 658–674 (2007).
36. Zheng, Y. et al. Structure of CC chemokine receptor 2 with orthosteric and allosteric antagonists. Nature 540, 458–461 (2016).
37. Afonine, P. V. et al. Towards automated crystallographic structure refinement with phenix.refine. Acta Crystallogr. D 68, 352–367 (2012).
38. Adams, P. D. et al. PHENIX: a comprehensive Python-based system for macromolecular structure solution. Acta Crystallogr. D 66, 213–221 (2010). 39. Emsley, P., Lohkamp, B., Scott, W. G. & Cowtan, K. Features and development of
Coot. Acta Crystallogr. D 66, 486–501 (2010).
40. Tan, Q. et al. Structure of the CCR5 chemokine receptor–HIV entry inhibitor maraviroc complex. Science 341, 1387–1390 (2013).
41. Murshudov, G. N., Vagin, A. A. & Dodson, E. J. Refinement of macromolecular structures by the maximum-likelihood method. Acta Crystallogr. D 53, 240–255 (1997).
42. BUSTER v. 2.10.2.
43. Schüttelkopf, A. W. & van Aalten, D. M. PRODRG: a tool for high-throughput crystallography of protein–ligand complexes. Acta Crystallogr. D 60, 1355–1363 (2004).
44. Chen, V. B. et al. MolProbity: all-atom structure validation for macromolecular crystallography. Acta Crystallogr. D 66, 12–21 (2010).
45. The PyMOL Molecular Graphics System. Version 2.0 Schrödinger, LLC. 46. Jurcik, A. et al. CAVER Analyst 2.0: analysis and visualization of channels and
tunnels in protein structures and molecular dynamics trajectories.
Bioinformatics 34, 3586–3588 (2018).
Extended Data Fig. 1 | Crystallization of MT2: crystals, crystal packing and electron density. a, b, Bright field (a) and cross-polarized images (b)
of representative MT2–2-PMT crystals optimized for synchrotron data
collection (representing three independent crystallization setups).
c, Cross-polarized image of representative MT2(N86D)–2-PMT
crystals used for XFEL data collection (representing three independent crystallization setups). See Extended Data Table 2 for data collection
statistics. d, e, Crystal packing (receptor, purple; BRIL, green; rubredoxin, blue). Space for missing rubredoxin in molecule B of the asymmetric unit is indicated with a red circle. Lattice rotated 90° is shown in e. f, Overlay of 2-PMT (purple) and ramelteon (blue) ligands of MT2. g–i, 2mFo – DFc
density (grey) contoured at 1σ of ramelteon (g), N862.50D mutation (h),
Extended Data Fig. 2 | Structural differences between MT1 and MT2. a, Overlay of MT1–2-PMT (green) and MT2–2-PMT (violet) structures
(Cα r.m.s.d = 0.6 Å). b, Comparison of MT1 (green) and MT2 (violet)
binding pockets. Overall, the binding pocket in MT2 is about 50 Å3
larger than in MT1. c, Comparison of 2-PMT ligand conformations in
MT1 (green) and MT2 (violet). Hydrogen bonds are shown as yellow
dashed lines. d, Overlay of MT1 and MT2, showing residues with different
conformations in the vicinity of the binding pocket. N4.60 makes a
hydrogen bond with Y5.38 in MT
Extended Data Fig. 3 | Molecular dynamics simulations. a, b, Distance
plots for interactions between residues in MT2 (N1754.60, atom ND2;
Q194ECL2, atom NE2; N2686.52, atom ND2), and closest oxygen atoms
of the ligand methoxy and acetyl groups, respectively, in complexes with melatonin (a) and 2-PMT (b) from three independent simulation
runs. c, Distance histograms for interactions of N1754.60 with methoxy
of melatonin (yellow) and 2-PMT (violet). d, Distance histograms for interactions of Q194ECL2 with alkylamide tail of melatonin (yellow) and
Extended Data Fig. 4 | Structural and functional differences between MT2–2-PMT and MT2(H208A5.46)–2-PMT. a, Overlay of
the MT2–2-PMT (purple) structure with that of MT2(H2085.46A)–2-PMT
(grey) reveals an inward shift of helix V of about 0.9 Å, due to the H2085.46A mutation (black arrow). b, Surface representation of
the H2085.46 and H2085.46A residues. Rotation of helix V renders the
binding pocket volume about 50 Å3 smaller for the H2085.46A structure
(binding site volume for MT2–2-PMT: 766 Å3 compared to 716 Å3 for
the MT2(H2085.46A)–2-PMT structure). c, Comparison of the channel
profiles (from the outside of the protein towards the ligand) for
MT2–2-PMT (purple) and MT2(H2085.46A)–2-PMT (grey) reveals a
narrowing of the MT2(H2085.46A)–2-PMT channel at a depth of around
6 Å as a consequence of the mutation and subsequent inward rotation of helix V. d, Functional data for wild-type and H2085.46A mutant MT2
expressed in HEK293T cells by using GloSensor to measure Gi/o-mediated
inhibition of cAMP. Data represent mean ± s.e.m. for n independent experiments as indicated in square brackets. %EMAX (maximum effect of a
drug) is relative to wild-type receptor (in columns), and %EMAX∗ is relative
Extended Data Fig. 5 | Selectivity analysis of melatonergic compounds. a, Binding affinities of ligands for MT1 (ChEMBL target identifier
CHEMBL1945) and MT2 (CHEMBL1946) were retrieved from the
ChEMBL database15 (v. 24) of experimental literature values. Of these
ligands, 525 have affinities reported for both receptor subtypes. For ligands with multiple reported affinity values for a given receptor, pKi values
were averaged. MT1-selective ligands are in the lower right quadrant;
MT2-selective ligands are in the upper left quadrant. Data points are
coloured by absolute pKi difference between subtypes (that is, selectivity).
b, Histogram of observed ligand selectivities. MT2 selective ligands are on
the left of the panel, MT1 selective ligands are on the right. c, Plot of the
docking score difference of select ligands that were docked between MT2
and MT1 versus their pKi difference (MT2 – MT1). Dashed lines indicate
pKi selectivity cutoff criteria (MT1: −1 and MT2: 4). Data points are
Extended data table 1 | Ligand affinity data for Mt2 mutants
Data were acquired with wild-type (WT) MT2 and mutants expressed in HEK293T cells by radioligand competition binding using [3H]melatonin to yield Kd or Ki affinity estimates. Data represent
Extended data table 2 | Mt2 Crystallographic data collection and refinement statistics
Extended data table 3 | Functional data (Gi/o GloSensor) for Mt2 crystal construct mutants
Data were acquired with wild-type MT2 and mutants expressed in HEK293T cells by using GloSensor to measure Gi/o-mediated cAMP inhibition via isoproterenol stimulation. Data represent
mean ± s.e.m. for n independent experiments as indicated in square brackets. %EMAX is relative to wild-type receptor (in columns), and %EMAX∗ is relative to melatonin (in rows). Mutant effects were
Extended data table 4 | Functional data (Gi/o GloSensor) for Mt2 mutants
Data were acquired with MT2 mutants by using GloSensor to measure Gi/o-mediated cAMP inhibition via isoproterenol stimulation. Data represent mean ± s.e.m. for n independent experiments as
indicated in square brackets. %EMAX is relative to wild-type receptor (in columns), and %EMAX∗ is relative to melatonin (in rows). Mutant effects were calculated by the change in relative activity, or
Extended data table 5 | thermostability data for Mt2 mutants
Melting temperature Tm determined using the CPM assay28 (mean ± s.d. for n = 3 independent experiments) for the crystallized construct (MT2-CC), and indicated mutants (in the MT2-CC
background), purified in the absence (apo) or presence (100 μM) of ligand (mlt, melatonin and 2-PMT, 2-phenylmelatonin). ND, not determined. W129F refers to MT2-CC but without the