INJURIES AND POSSIBLE DISORDERED EATING AMONG ELITE PRE-PROFESSIONAL BALLET AND CONTEMPORARY DANCERS
Rebecca Kay-yun Yau
A dissertation submitted to the faculty at the University of North Carolina at Chapel Hill in partial fulfillment of the requirements for the degree of Doctor of Philosophy in the Department of Epidemiology in the
Gillings School of Global Public Health.
Chapel Hill 2016
Approved by:
ABSTRACT
Rebecca Kay-yun Yau: Injuries and Possible Disordered Eating Among Elite Pre-professional Ballet and Contemporary Dancers
(Under the direction of Stephen W. Marshall)
Injuries and eating disorders (EDs) are two of the most common health-related issues among
ballet and contemporary dancers. Limited literature exists on injuries and EDs to pre-professional
dancers, and prior literature has been constrained by methodological shortcomings. This dissertation
examined injury incidence, injury predictors, possible disordered eating (PDE) prevalence, and PDE
predictors in an adolescent/young dance population. Injury incidence rate ratios (IRRs) and PDE
prevalence ratios (PRs) were estimated using negative binomial generalized estimating equations and log
binomial regression, respectively. Among 480 dancers, 1,014 injuries were sustained. Most injuries were
to the lower extremity and were overuse injuries. There were differences in upper extremity, lower
extremity, and traumatic injury rates by demographic subgroups. Among females, the best predictive
model for injury rates included history of depression (IRR: 1.76; 95%CI: 1.29, 2.39), age (16 to 17 IRR:
0.91; 95%CI: 0.73, 1.14 /18 to 19 IRR: 0.81; 95%CI: 0.62, 1.07 /21 or older IRR: 0.62; 95%CI: 0.40, 0.96
reference= 15 or younger), number prior injuries (1 injury IRR: 1.11; 95%CI: 0.88, 1.42 /2 injuries IRR:
0.98; 95% CI: 0.72, 1.32 /3 or more injuries IRR: 0.77; 95%CI: 0.91, 1.17 reference= 0 injuries). Among
identified among males. Strategies can be implemented to reduce and mitigate the consequences of
these injuries, if not the injuries themselves. Future studies could identify other predictors of PDE among
ACKNOWLEDGEMENTS
First and foremost, I want to thank my family, and especially my parents, John and Roxana, for
the love and support they’ve offered me for my entire life in everything that I’ve done in the classroom, on
the tennis courts, around the track, on the roads, and beyond.
This dissertation would not have been possible without my five committee members: Steve
Marshall, Yvonne Golightly, David Richardson, Cristin Runfola, and Anna Waller. Steve, my committee
chair and academic advisor my entire time at UNC has truly shaped my four years here in Chapel Hill for
the better. He has generously shared his time and knowledge during my time at UNC, and his keen
insights have been instrumental in shaping my understanding of epidemiology and injury prevention. He
took the time out of his hectic schedule to drive out to Winston-Salem on multiple occasions to meet with
key collaborators at UNCSA. His accent and humor are also always much appreciated.
As a physical therapist and former dancer (in addition to being an epidemiologist), Yvonne offered
very pointed and practical insights that helped shape this dissertation. She took the time to help me
refine the definition and terminology around overuse and traumatic injuries. Even before I formally asked
her to be part of my dissertation committee, she showed a genuine interest in this research I was doing.
David was my professor in EPID 718, and it became apparent to me while in his class that he is a
strong epidemiology methodologist who thinks critically and applies his knowledge to a variety of different
dissertation book with me as I was writing mine, which was helpful in thinking about specific issues that
should be discussed when talking about a pre-professional dance population. The pearls of wisdom that
she also verbally shared from her research experiences enhanced the work on my dissertation.
There are so many people at University of North Carolina School of the Arts that I need to thank.
I am eternally grateful for Ann Potter, former director of Student Health Services, for allowing me to base
my research at UNCSA. As providers at Student Health Services, Brooke Orr, Laura Santos, and David
Wilkenfeld all provided input that helped me develop ideas that laid the groundwork for this dissertation.
Nancy Green was the technological expert who helped me get access to the data that I needed, and also
generously gave her time and helped me work through minor roadblocks when I was having issues with
my data. I would also like to thank Dean Ward Caldwell and Dean Susan Jaffe for taking the time to meet
to better understand my dissertation research and asking astute questions that helped me better
understand the direction my dissertation needed to head towards. And finally, I am grateful that Jared
Redick graciously allowed me to observe one of his technique classes, where I got a small glimpse into
the demands that the dancers at UNCSA face in their training.
The connection to UNCSA would not have been possible without William Filer, Associate
Professor and Physician at the UNC Department of Physical Medicine and Rehabilitation. We first met in
July 2013 to discuss performing arts medicine and potential directions for research in the field, and what
began as a brainstorming session has ultimately transformed into my dissertation.
I really want to thank all the former and current UNC injury epidemiology students who have
offered feedback, support, and comic relief throughout my time at UNC: Apostolos Alexandridis, Katie
Harmon, Mackenzie Herzog, Jenny Jones, Zack Kerr, Becky Naumann, Jared Parrish, Catherine
Vladutiu, and Katie Wolff. A special thanks to Karen Roos, who helped me better understand how to
think about and classify overuse injuries.
A huge thanks to everyone based at the UNC Injury Prevention Research Center (IPRC), which
was where pretty much everything related to this dissertation happened. People at IPRC may or may not
have witnessed me talking angrily to the computer because it was not cooperating with me throughout the
dissertation process, so thanks for bearing with that. I really would like to thank Maryalice Nocera for
off of the dissertation when I needed a distraction. Many thanks also to Tonya Watkins, who humored the
numerous occasions where I had random questions for her.
I started the UNC Epidemiology program in Fall 2012, and it has been a great joy to share the
past few years with my friends in the cohort. The wonderful people in the Epidemiology Student Services
have also been key players in helping me progress during my time at UNC.
I have received so much love, prayers, and support these past few years from my Chapel Hill
Bible Church family. My life group has been a constant source of encouragement when I’ve needed it the
most. My weekly get-togethers with Julie McKiddie and her kids have taught me a lot about finding joy in
the simple things of life.
Most importantly of all, I thank God, who has blessed me with all the people who have made this
dissertation possible, and has given me my gifts, talents, and experiences necessary to complete this
TABLE OF CONTENTS
LIST OF TABLES……… xi
LIST OF FIGURES………. xii
LIST OF ABBREVIATIONS……… xiii
CHAPTER 1: INTRODUCTION………. 1
CHAPTER 2: REVIEW OF THE LITERATURE……….………. 3
2.1 Overview………... 3
2.1.1 Injury incidence………... 4
2.1.2 Distribution of Injuries………. 6
2.1.3 Overuse injuries……….. 7
2.2 Eating disorders………. 8
2.2.1 Prevalence………... 9
2.2.2 Screening Tools……….. 9
2.3 Significance………...14
CHAPTER 3: STATEMENT OF SPECIFIC AIMS……… 16
CHAPTER 4: METHODS………..18
4.1 Study population……….. 18
4.2 Study design………. 18
4.3 Data………18
4.4 Identification of study cohort……….. 19
4.5 Outcome variables………...20
4.5.1 Injury………... 20
4.5.2 Possible disordered eating……….. 20
4.6 Explanatory variables………..21
4.6.2 Mental health history……… 22
4.6.3 History of risk-taking behaviors……….. 23
4.6.4 Prior history of injuries………. 23
4.7 Person-time……….. 23
4.8 Data analysis……… 24
4.9 Variable selection for multivariable models………. 25
CHAPTER 5: INJURY RESULTS (PAPER 1)………...29
5.1 Background……….. 29
5.2 Methods……….30
5.2.1 Incident injuries………. 31
5.2.2 Time at risk……… 32
5.2.3 Predictors of injury……… 32
5.3 Data analysis……… 33
5.4 Results……….. 34
5.4.1 Injury counts……….. 34
5.4.2 Injury rates………. 35
5.4.3 Multivariable modeling………. 35
5.5 Discussion……….36
5.5.1 Multivariable modeling………. 37
5.5.2 Injury prevention strategies………. 39
CHAPTER 7: DISCUSSION………. 55
7.1 Summary of findings………55
7.2 Injuries………... 55
7.2.1 Interaction……….. 57
7.2.2 Concussions……….. 58
7.2.3 Injury duration……… 59
7.2.4 Interrater reliability of overuse and traumatic injuries………. 60
7.2.5 Prior history of injury as a predictor of injury……… 60
7.2.6 History of depression as a predictor of injury………... 61
7.3 Possible disordered eating………. 61
7.3.1 Female Athlete Triad……… 62
7.3.2 BMI……….. 62
7.3.3 School-based committees………... 64
7.3.4 Incident versus prevalent PDE………... 64
7.4 Strengths………...66
7.5 Limitations………. 67
7.6 Public health implications………... 69
7.7 Specific implications for UNCSA screening……….71
7.8 Future research……… 72
APPENDIX 1: PRIOR STUDIES OF DANCE-RELATED INJURIES……… 74
APPENDIX 2: SELECT PRIOR STUDIES UTILIZING THE EATING ATTITUDES TEST AND BULIMIC INVESTIGATORY TEST, EDINBURGH………... 80
APPENDIX 3: SAMPLE OF UNCSA HEALTH HISTORY FORM………. 86
APPENDIX 4: INJURY DURATION……… 87
APPENDIX 5: ADDITIVE AND MULTIPLICATIVE INTERACTION IN INJURY MODELS……… 88
APPENDIX 6: SCREENING-RELATED CALCULATIONS FOR POSSIBLE DISORDERED EATING…...90
LIST OF TABLES
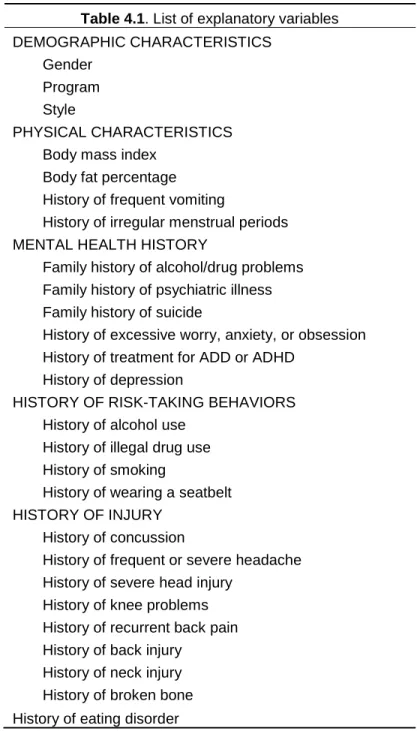
Table 4.1: List of explanatory variables………...26
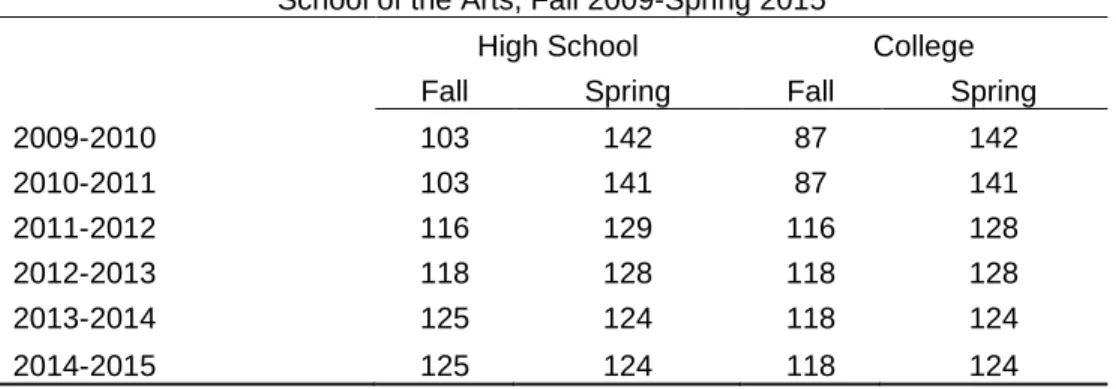
Table 4.2: Length of academic terms (in days),
University of North Carolina School of the Arts, Fall 2009-Spring 2015………. 27
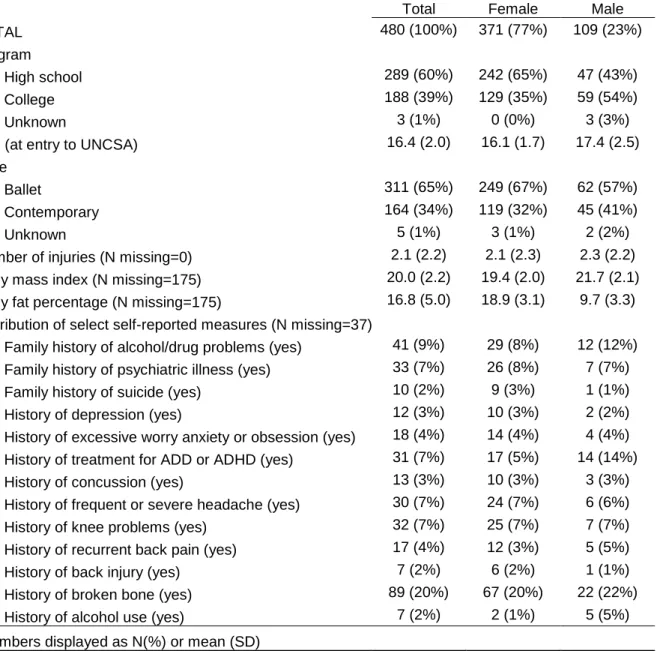
Table 5.1: Characteristics of dancers,
University of North Carolina School of the Arts, Fall 2009-Spring 2015………. 42
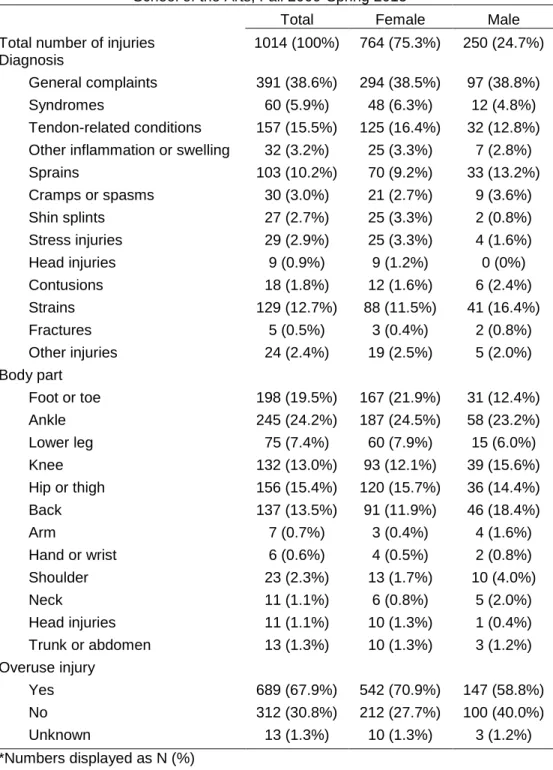
Table 5.2: Distribution of dance-related injuries,
University of North Carolina School of the Arts, Fall 2009-Spring 2015………. 43
Table 5.3: Injury rates and IRRs,
University of North Carolina School of the Arts, Fall 2009-Spring 2015……… 44
Table 5.4: Mean injury duration (in days) by body part,
University of North Carolina School of the Arts, Fall 2009-Spring 2015……… 45
Table 5.5: Mean injury duration (in days) by injury diagnosis group, University of North Carolina School of the Arts, Fall 2009-Spring 2015……….... 45
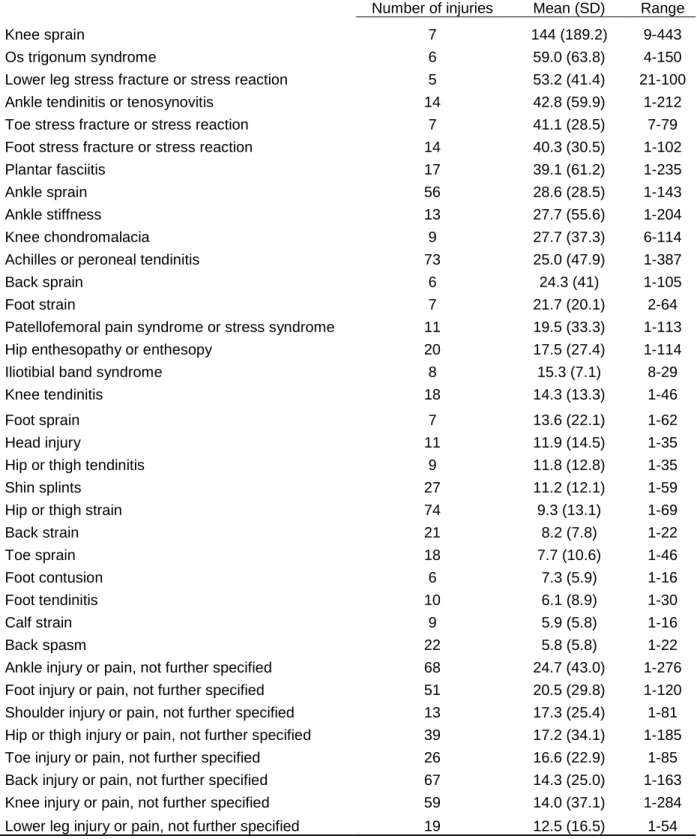
Table 5.6: Mean injury duration (in days) by specific injury diagnosis, University of North Carolina School of the Arts, Fall 2009-Spring 2015... 46
Table 6.1: Dancer characteristics, University of North Carolina School of the Arts, Fall 2009-Spring-2015... 53
Table 6.2: PRs of potential predictors of PDE among female dancers,
LIST OF FIGURES
Figure 4.1: Conceptual model of covariates and outcomes……… 28
Figure 5.1: Distribution of number of dance-related injuries by gender, UNCSA Fall 2009-Spring 2015……… 47
LIST OF ABBREVIATIONS
ADD Attention deficit disorder
ADHD Attention deficit hyperactivity disorder
AIC Akaike information criterion
AN Anorexia nervosa
BD Body density
BF% Body fat percentage
BITE Bulimic Investigatory Test Edinburgh
BMD Bone mineral density
BMI Body mass index
BN Bulimia nervosa
BSI Bone stress injury
CI Confidence interval
DE Disordered eating
DIS Dance Injury Study
DSM Diagnostic Statistical Manual for Mental Health
EAT Eating Attitudes Test
ED Eating disorder
EDNOS Eating disorder not otherwise specified
EHR Electronic health record
MM Millimeters
N/A Not applicable
NB Negative binomial
NPV Negative predictive value
OSFED Other specified and unspecified feeding or eating disorder
PCA Principal components analysis
PDE Possible disordered eating
PI Principal investigator
PPV Positive predictive value
PR Prevalence ratio
QICu Quasi-Akaike information criterion
RERI Relative excess risk for interaction
SCID Structured clinical interview for DSM
SHS Student Health Services
Triad Female athlete triad
UNCSA University of North Carolina School of the Arts
UK United Kingdom
US United States
CHAPTER 1: INTRODUCTION
Dancing is an art form that has been celebrated for centuries. There are many ways to classify
dances systematically; one possible method is by the intent of the dance, which can be to please those
who are participating in the actual dance, to please the gods, or to please other people. A dance can be
placed into the category of theatrical dancing when a prominent reason for the dance is to please other
people1. Ballet is one of the earliest forms of theatrical dance, and in its earliest form was brought from Italy to the French royal courts in the 1500s1,2. Prominent ballet dancers developed in the United States (US) in the 1700s and 1800s, but ballet did not become an established art form in the US until the 1900s1. It was also at this time that another form of theatrical dance developed in the US: contemporary dance.
Key differences between contemporary dance and ballet include the types of movement: ballet focused
on curved and symmetrical movements, while contemporary dancers often use angular asymmetric
movements. Furthermore, ballet is choreographed such that no effort appears to be put forth by the
dancers, whereas some choreographers in contemporary dance seek to emphasize this effort1. Irrespective of style, dancers undergo rigorous training. Professional dancers typically begin
dancing at a very young age. One study conducted at a liberal arts high school with pre-professional
dancers aged 14 to 18 years [mean (SD)=15.9 (1.0)] found that the student had a mean of 10.0 (SD=2.7)
19668 to over 600 programs in 20159,10. This increase in the number of programs suggests an increasing popularity of training to be a dancer. With this increase in number of dancers will also come an increase
in burden of health-related concerns for dancers. This dissertation examines two of these concerns:
CHAPTER 2: REVIEW OF THE LITERATURE
2.1 Overview
Two health-related issues associated with specialized athletic activity that are commonly
identified as areas of concern are injuries and disordered eating (DE)11,12. Sport-related injuries occur relatively frequently in physically active populations13–17. Sport-related injuries place a large burden on society. Over one-quarter of all emergency department visits are due to injuries in the US18. Among children 18 years or younger, 20% of all injury-related emergency department visits are sport-related19. Sport-related injury emergency department visits account for the highest proportion of injury-related
emergency department visits among those 5-14 and 15-24 years of age20. Sport-related injuries affect a much younger population than most other health-related issues. The median age of those visiting the
emergency department for sport-related injuries is less than 24 years of age13, which is younger than the average age of people affected by chronic conditions such as cancer21, diabetes22, or heart disease23. Effects of injuries at a young age are both physical and mental24, and these effects can persist for years or appear decades later15,25,26.
Eating disorders (EDs) are also a common issue in active populations. Elite athletes have a higher
prevalence of EDs than the general population27. Athletes may be at increased risk for developing EDs because of societal pressures to meet an ideal body shape, a need to minimize body fat for performance
In dance, injuries and EDs are also of high concern11. Among female athletes, including dancers, the Female Athlete Triad (Triad) is an important health consideration. The Triad results from the interplay
of three factors: low energy availability (where caloric intake is lower than necessary based on caloric
expenditure), menstrual dysfunction (e.g., amenorrhea), and low bone mineral density (BMD). Low
energy availability has physiological implications: the body begins to shunt energy away from vital body
functions including cellular maintenance, growth, and thermoregulation. Low BMD can result in
osteoporosis, a condition leading to weak bones which increases the risk of sustaining a fracture32. A recent review article investigated the prevalence of each of the three components of the Triad both
separately and combined, and used DE as a proxy for low energy availability. Athletes in lean sports had
a higher prevalence of all three Triad factors simultaneously compared with athletes in non-lean sports.
Similarly, athletes in lean sports had a higher prevalence of two of the three Triad factors simultaneously.
When investigating each of the three components separately, lean sport athletes had a higher prevalence
of both low BMD and menstrual dysfunction, but the prevalence of DE was similar between lean and
non-lean sport athletes33. One study investigating the effect of risk factors associated with the Triad, both individually and simultaneously, on the risk of developing either a bone stress injury (BSI; i.e., a stress
reaction or stress fracture) found a positive correlation between number of risk factors associated with the
Triad present and risk of developing a BSI. Specifically, 15-21% developed a BSI with one Triad-related
component present, 21-30% developed a BSI with two Triad-related components present, and 29-50%
developed a BSI when three Triad-related components were present34. The Triad is also related to EDs, as some EDs involved restrictive caloric consumption, which can lead to low energy availability32. Despite the fact the Triad is applicable only to females, experts have recently suggested that low energy
availability can also negatively affect men35. Nonetheless, the Triad remains a key concept when considering both injuries and EDs among dancers.
2.1.1 Injury incidence
Injuries occur frequently in ballet and contemporary dancers. Prior studies investigating injury
incidence have used various recall periods and definitions of injury (Appendix 1), but many studies have
interview, and all but one study defined an injury as any event where the dancer either had to modify or
stop dance activity for at least one session (i.e., practice, rehearsal, or performance). One study did not
provide any definition of injury. Another study followed professional ballet dancers for nineteen weeks.
Injuries were reported based on clinical assessment by a physiotherapist; the injury incidence proportion
was 75% over the course of follow-up40. Another study investigated injuries among pre-professional ballet dancers at a boarding school for five academic years (one academic year was nine months in
duration). An injury was defined as any incident where treatment was given by a physical therapist.
Injury incidence proportion for any given academic year ranged from 32-51%. Over the five years of the
study, 42% of dancers experienced at least one injury41. A similar study investigated injuries among dancers at a ballet school for seven academic years, where in injury was defined as any incident where
orthopedic care was received. While injury incidence was not calculated for any single academic year,
44% of dancers experienced at least one injury over the course of the study42.
Previous studies focusing exclusively on ballet or contemporary dancers have used a variety of
denominator measures in calculating injury rates (Appendix 1). One denominator measure used by four
studies was the number of dancers, which yields an average number of injuries per dancer. All four
studies focused on ballet dancers and defined an injury as an incident reported or assessed by a physical
therapist. Two of the studies focused on pre-professional dancers and the other two focused on
professional dancers. Furthermore, these studies all utilized a cohort design, since dancers were
by gender, and generally females had a lower rate than males42,43,45,46. One study among professional ballet dancers that explored injury rate by setting found that for females, the injury rate in class, rehearsal,
and performance was 4.94, 2.43, and 4.45 per 1,000 dance-hours, respectively. The corresponding rates
for males were 7.54, 2.99, and 5.19, respectively43. However, a study among professional modern dancers that also explored injury rate by setting found that females had a higher injury rate than males.
This study, also calculated injury rate based on the setting (class and rehearsal). For females, the injury
rate in class and rehearsal was 0.75 and 0.58 per 1,000 hours, respectively. The corresponding rates for
males were 0.40 and 0.52, respectively36. Injury incidence was also found to increase with age at one ballet school42. Injury rates based on reporting method vary: one prospective cohort study based in a high school dance program of both ballet and modern dancers found that self-reported injury rates (4.7
per 1,000 hours) were higher than injury rates calculated based on injuries reported to and treated by a
physical therapist (2.9 per 1,000 hours)3.
Only two studies in the literature used an alternate measure of athlete-exposure for calculating
incidence rate. One of the studies defined an athlete-exposure as one dancer participating in one
practice, rehearsal, or performance. This study was based at one ballet boarding school and used five
academic years of data. There were 1.09 injuries per 1,000 athlete-exposures, or 0.77 injuries per 1,000
hours of dance41. The other study did not provide a definition for an athlete-exposure, and was based at a ballet school using six months of data. There were 3.52 injuries per 1,000 athlete-exposures, or 2.40
injuries per 1,000 hours of dance. These rates were also calculated by gender, with males having a
higher injury rate than females46. 2.1.2 Distribution of Injuries
Much of the movement in dance involves the legs; thus, it is not surprising that a majority of
injuries to dancers are in the lower extremity (Appendix 1). Lower extremity injuries account for between
79%-91% of all injuries to dancers, while upper extremity injuries account for 2%-14% of all
Female and male dancers execute different movements while dancing. In ballet, only females
dance en pointe, where the dancer is in full equinus position on the foot while in full ankle plantar
flexion45,48,49. Only males perform lifting movements and execute high jumps in ballet45,49. Performance of different movements may account for part of the differential distribution in body location of injury. In
contemporary dance, there are more similarities in the movements performed by females and males than
ballet. For example, both females and males perform lifts in contemporary dance, while only males
perform lifts in ballet50. 2.1.3 Overuse injuries
Overuse injuries are the predominant type of injury in dancers (Appendix 1). Overuse injuries can
be defined as injury due to repetitive microtrauma over time to the musculoskeletal system, while
traumatic injuries can be defined as injury due to excessive stress on the musculoskeletal system
associated with one specific event49. Most of the previous studies focused on ballet and contemporary dancers have found that a majority of injuries (57%-78%) resulted from overuse, as opposed to traumatic
causes36,40,42–45. Five of these studies investigated ballet dancers (three professional, one
pre-professional, one with students at a ballet school) and all defined injury as an incident where care from a
healthcare professional (e.g., physical therapist) was necessary. One study investigated professional
contemporary dancers, and used self-reported injury information from the past year. However, one study
found that 44% of injuries sustained by ballet dancers were due to overuse39. The study population consisted of dancers participating in a dance festival in Brazil. Although various dance styles (not limited
to ballet and contemporary dance) were represented at this festival, select results for the study were
overuse injuries may differ by anatomic location on the body. Injuries to the lower extremity and back
were mostly due to overuse, while injuries to the upper extremity and head were mostly due to traumatic
causes42,45. The proportion of injuries due to overuse appeared to be similar among females and males42,43. Typical traumatic injuries include sprains, strains, and fractures 52,53. It is currently unknown whether the distribution of these traumatic injury diagnoses differs by anatomic location on the body.
2.2 Eating disorders
The impact of eating disorders (EDs) is increasing. Disability-adjusted life years (DALYs), a
composite measure of years of life lost due to premature mortality and years lived with disability, due to
EDs increased globally from 1.3 million in 1990 to 2.2 million in 2010. This increase is not solely due to
population growth, as EDs comprised 25 DALYs per 100,000 population in 1990 and increased to 31
DALYs per 100,000 population in 201054. EDs affect both physical and mental health. Those diagnosed with EDs are at increased risk of having comorbid conditions with disorders such as mood disorders (e.g.,
depression), impulse-control disorders, and substance use disorders55. EDs are costly to society: not only are there direct monetary costs related to treatment, a substantial amount of time is consumed in the
month prior to admission in a treatment program. One study found that the average amount of time in the
month prior to admission spent on ED-related issues was 91 hours, 72 hours, and 88 hours for mothers,
fathers, and partners, respectively. The most substantial time costs resulted from time spent providing
emotional support and care56,57.
EDs are formally diagnosed using the Diagnostic Statistical Manual for Mental Health (DSM).
The DSM was first published in 1952 by the American Psychiatric Association as a way of systematically
classifying mental disorders that loosely parallels with the classification scheme in the International
Classification of Diseases (ICD)58. The DSM-III was published in 1980, and was the first edition of the DSM to include specific diagnostic criteria for EDs. The Structured Clinical Interview for DSM (SCID) was
also first developed in the revision for the DSM-III (DSM-III-R) which was published in 1987, and is
utilized to diagnose EDs. In the DSM-III-R, there are three broad diagnoses for EDs: anorexia nervosa
(AN), bulimia nervosa (BN), and eating disorder not otherwise specified (EDNOS). The DSM-IV was
published in 1994; the main differences for ED diagnoses between DSM-III-R and DSM-IV is that AN is
and BN are mutually exclusive diagnoses60. The DSM-5 was published in 201361. The key changes from DSM-IV to DSM-5 were that 1) amenorrhea is no longer a criterion for being diagnosed with AN, 2) BN is
no longer divided into subtypes, and 3) there is a new category for binge-eating disorder, which was
previously included in the EDNOS category of the DSM-IV62. Furthermore, the EDNOS has been renamed to “other specified and unspecified feeding or eating disorder” (OSFED)63
.
2.2.1 Prevalence
EDs disproportionately affect female dancers. In the general population, the lifetime prevalence
of EDs using DSM-5 criteria is estimated to be 4% for AN, approximately 2% for bulimia nervosa (BN),
<1%-3% for binge-eating disorder (BED), and at least 2% for OSFED64. A meta-analysis of 33 studies published between 1966 and 2013 found that prevalence of having an ED was 12.0% among all dancers,
and 16.0% specifically for ballet dancers. For ballet dancers, the prevalence of AN, BN, and EDNOS was
4%, 2%, and 14.9%, respectively65. Among professional ballet dancers, lifetime prevalence of having an ED ranged from 31% to 83%66,67. EDs are more common in females than males, both in the general population and among dancers11,68–70.
Dancers face pressures that increase the likelihood of developing an ED. In addition to having
ED-related psychopathological characteristics (e.g., body dissatisfaction) that are elevated67, environmental factors also likely contribute to the probability of developing an ED71,72. Dancers face pressures to maintain lean bodies and low body weights from people including artistic directors, mentors,
and male partners (for female ballet dancers)73,74. The perception also exists that maintaining a low body weight is paramount for aesthetic reasons in classical ballet73–76.
Likert scale. For each item, the most extreme response in the “anorexic” direction was given three points,
and the immediately adjacent responses were assigned two and one point, respectively. The three
responses in the “non-anorexic” direction were collapsed into one category and given a score of zero.
The initial version of the EAT contained 35 items and was administered to 32 participants being treated
for AN (based on fulfilling the six Feighner criteria80) and 34 university students who had no history of psychiatric illness (i.e., controls). For 23 of the 35 items in this initial version, participants with AN scored
significantly higher than controls, and these items were therefore considered “meaningful”. The total
score from these 23 items were correlated with group membership (r=0.72, p<0.0001). The second
version of EAT included the 23 items from the initial version plus 17 new items. This second version was
administered to a separate sample of 33 participants being treated for AN and 59 controls. The total
score on the second version of the EAT was correlated with group membership (r=0.87, p<0.0001). This
second version is the final version that is presently known as the EAT-40. The mean (standard deviation
[SD]) EAT-40 score for participants with AN and controls was 58.9 (13.3) and 15.6 (9.3), respectively. To
minimize false negatives for AN, Garner and colleagues suggest using a minimum cutoff score of 30, as
all 33 participants with AN scored 30 or higher on the EAT-40. There was high internal consistency for
the EAT-40 (α=0.79 for participants with AN, and α=0.94 for the combined sample of participants with AN
and controls). Using varimax rotation, items on the EAT-40 were grouped into seven factors: food
preoccupation, body image for thinness, vomiting and laxative abuse, dieting, slow eating, clandestine
eating, and perceived social pressure to gain weight81. These factors were not formally used as subscales in the EAT-40.
A subsequent version of the EAT that had 26 items was developed82. The EAT-40 was administered to 160 females with AN (based on the Feighner 1972 criteria) and 140 female university
students (i.e., controls). Using a scree test, it was determined that there were three factors that
accounted for 40% of the variance in responses. Using an oblique rotation, it was determined that 26
items had factor loadings of 0.40 or more. The remaining 14 items were removed, and the EAT-26 was
finalized with three factors. Garner and colleagues indicated a minimum cutoff score of 20 on the EAT-26
was equivalent to a cutoff score of 30 on the EAT-40. The total EAT-26 score was highly correlated with
mean (SD) EAT-40 score for participants with AN and controls was 52.9 (23.0) and 15.4 (11.0),
respectively. The corresponding EAT-26 scores were 36.1 (17.0) and 9.9 (9.2), respectively. Other
versions of the EAT with different numbers of items and translations have also been created.
The EAT’s psychometric properties have been explored in five previous studies (Appendix 2).
Two studies focused exclusively on the EAT-4083,84, and the remaining three studies included the EAT-26. One study sought to determine the validity of using cutoff scores for the EAT-26 to identify participants
with EDs (AN, BN, or EDNOS). 30 students had diagnosed EDs and 99 students did not have EDs.
Using a cutoff score of > 20, the 26 had six false positives and seven false negatives. For the
EAT-26, the sensitivity, specificity, positive predictive value, and negative predictive value were 0.77, 0.94,
0.79, and 0.94, respectively60. Another study performed a confirmatory factor analysis to examine construct validity and internal consistency reliability of the EAT-26. The EAT-26 had poor model fit, and it
was determined that the four-factor EAT-16 had the best fit85. A third study explored the factor structure of the EAT-26. An alternate scoring method was used where the responses of the non-anorexic side of
the scale were not collapsed, so each item could have a minimum score of one and maximum score of six
(as opposed to possible values of zero to three, as suggested by the developers of the EAT). Using the
Comparative Fit Index and Root Mean Square Error of Approximation, it was determined that a the
three-factor structure of EAT-26 fit poorly to the data, and the four-three-factor 16-item structure suggested by Ocker
and colleagues85 was a better fit86.
A few studies have used the EAT simultaneously in dancing and non-dancing populations to
screen for AN and other EDs (Appendix 2). Dancers generally had a higher mean EAT score or a greater
score for females and males was 19.00 (14.59) and 10.00 (3.81), respectively. Eight female dancers
(21.6%) and no male dancers scored >3090. The one study that used the EAT-26 found the mean score among dancers was 13.55 (8.7), and did not differ significantly from non-dancers. Among the dancers,
16% scored >20 on the EAT-26. 15 dancers (31%) met the criteria for ever having AN under the DSM-III,
13 dancers (26%) met the criteria for ever having BN under the DSM-III, and 6 dancers (12%) met the
criteria for BN under the DSM-III-R66.
One study among dancers utilized the EAT-26 as a measure of DE attitudes and behaviors
(Appendix 2). The DIS found that the overall mean EAT-26 score was 14.2, and females had higher
scores than males (mean=15.4 and 5.3, respectively, p=0.01). Mean EAT-26 score did not significantly
differ between ballet and contemporary dancers (16.2 and 13.8, respectively), nor did the scores differ by
age (mean=11.8 and 16.5 for students aged 12-15 years and 16-18 years, respectively). 17% of students
aged 12-15 scored >20, while 31% of students aged 16-18 scored >2051. 2.2.2.2 Bulimic Investigatory Test Edinburgh
The BITE was originally developed to identify people who are binge-eaters. The instrument
contains 40 questions: seven related to dieting behavior, 27 related to symptoms and behaviors
associated with binge eating, and six related to specific information on the most significant behavior’s
frequency. The BITE was first pilot tested with 15 female binge eaters who were in different stages of
treatment and 40 control subjects (13 males, 27 females). Based on scores from the 27 questions on
symptoms and behaviors associated with binge eating, participants were divided into two groups, with a
cutoff score of 20. The group with high scores was comprised of 14 binge eaters and two control
subjects. Using chi-square tests, individual questions of the BITE were analyzed to determine whether
the question significantly predicted group membership. Based on this pilot test, the BITE was subdivided
into two subscales: The Symptom Subscale and Severity Subscale. The Symptom Subscale contains 30
questions: all 27 questions related to binge eating and three of the questions related to dieting behavior.
The Symptom Subscale questions can be answered either “Yes” or “No”, and has a maximum possible
score of 30. For all but five of the questions, a “Yes” response is given one point; the remaining five
questions are given one point for a “No” response. A score of 20 or higher on the Symptom Subscale
Severity Subscale is comprised of six questions related to the frequency of the most significant behavior,
and has a maximum possible score of 39. A score of five or higher on the Severity Subscale is
considered clinically significant. Furthermore, a score of 25 or higher when combining both subscales is
considered suggestive of severely DE91.
After the BITE was pilot tested, a second study was performed among 32 females who met the
DSM-III criteria for BN (but had not yet entered treatment) and 32 controls. Among participants with BN,
all scored above 25 on the BITE [mean (SD)=36.19 (4.47)], all scored above 20 on the Symptom
Subscale [mean(SD)=26.03 (2.25)], and all but two participants scored at least 5 on the Severity
Subscale [mean(SD)=10.16 (3.63)]. None of the controls scored above the cutoff scores for either the
Symptom Subscale [mean (SD)=2.96 (2.94)] or the Severity Subscale [mean (SD) = 0.44 (0.29)]. There
were statistically significant differences in total BITE score (p<0.001), Symptom Subscale score (p<0.05),
and Severity Subscale score (p<0.05) when comparing participants with BN to controls. Reliability of the
Symptom Subscale and Severity subscale was 0.96 and 0.62, respectively. The EAT-40 was also
administered to participants, and total EAT-40 scores were significantly correlated with BITE scores
(r=0.697, p<0.0001)91.
The test-retest reliability of the BITE was assessed with 10 females who met the DSM-III criteria
for BN and 30 female controls. The BITE was administered two times 15 weeks apart to participants with
BN and at least one week apart for controls. The mean (SD) score on the first and second administration
for participants with BN was 34.4 (3.13) and 31.8 (5.39), respectively; the correlation between the scores
was 0.68 (p<0.0001). The corresponding scores for controls was 3.33 (2.57) and 3.22 (2.27),
The BITE has been used to screen for EDs in one previously published study (Appendix 2). The
BITE was administered to women in a professional ballet company. None of the women had any ED at
the time of the study, but three of 19 women (16%) had a lifetime history of AN. Two of these three
dancers had elevated BITE scores of 16 and 24, respectively93.
2.2.2.3 Eating Attitudes Test and Bulimic Investigatory Test Edinburgh in combination
A small number of studies have used both the EAT and BITE simultaneously to investigate EDs
among dancers (Appendix 2). One study investigating dancers and non-dancers found that the mean
(SD) EAT-26 score was different when comparing dancers to non-dancers [17.2 (10.1) and 11.2 (8.4),
respectively, p<0.001]. There were 59 dancers (9.6%) who scored >20 on the EAT-26. The total BITE
score differed between dancers and non-dancers [mean (SD) = 14.3 (7.3) and 9.7 (6.1), respectively;
p<0.001]. There were 239 dancers (39.0%) who had a positive screen based on the BITE; 27 of these
dancers also scored > 20 on the EAT-26. The estimated prevalence of AN, BN, and EDNOS among
dancers was 0.7%, 2.5%, and 4.8%, respectively94. A subsequent study was conducted and focused on the dancers, and the EAT-26 and BITE were re-administered. EAT-26 scores decreased from 17.2 (10.0)
to 14.8 (9.2) from baseline to follow-up (p<0.001). Total BITE scores increased from 14.1 (7.2) to 15.3
(8.1) (p<0.001). Among dancers without any ED at baseline (n=204), 35 developed an ED. Multivariable
Poisson regression indicated that a one-unit increase in BITE score increased the risk of incident ED by
8% (95% CI = 1%, 14%), while EAT-26 score was not associated with developing an incident ED95. 2.3 Significance
Epidemiologic studies of injuries have utilized a variety of study designs including case series,
prospective cohort studies, retrospective cohort studies, and cross-sectional studies. Studies of athletes
have made extensive use of prospective cohort design. Advantages of this design for studies of athletes
include being able to create cohorts from administrative or academic records, the relatively short period of
follow-up needed to register injuries (i.e., months, not the decades required for studies on chronic
conditions), and the fact that the predictive profile is established before the injuries occur96. Although prospective cohort studies are typically used to study incident outcomes, they can also be used to study
studies with a series of defined start and end times. Thus, a prospective cohort study allows for the
investigation of both incidence of injuries and prevalence of PDE.
Prior studies on injuries among dancers have been limited by various methodological issues, and
this dissertation addressed two of the key limitations in prior research. The first issue relates to small
sample size: previous studies have enrolled between 22 -476 participants (mean=156, median=108).
Small sample size increases the likelihood that random variation played a role in the study results. This
dissertation overcame this limitation by investigating over 480 participants across six academic years.
Another issue with prior studies was study design. Two prior studies utilized a case series design47,53, which precluded the calculation of measures of occurrence such as incidence or prevalence. This study
utilized a prospective cohort design, allowing for the calculation of measures of occurrence. Furthermore,
a recent review article97 found that only five studies have been conducted among pre-professional ballet dancers, and this study will add to the current literature base among both ballet and contemporary
pre-professional dancers.
While many studies investigating either injuries or EDs have studied ballet dancers, to date few
studies have investigated contemporary dancers. Three of these studies investigated populations
comprised of both ballet and contemporary dancers51,52,98. The remaining two studies investigated either professional dancers36 or female dance majors and minors99. Furthermore, prior studies investigating either EDs or DE patterns among dancers have mostly focused on females. Only three previous studies
have investigated EDs or DE patterns among both males and females70,90,100; none of these studies were conducted in a population based in the US. Therefore, this study advanced the field both
CHAPTER 3: STATEMENT OF SPECIFIC AIMS
This dissertation addresses four specific aims.
Specific Aim 1 (Injury incidence): Quantify incidence of musculoskeletal injuries in an
adolescent/young adult dance population. Differences exist in types of movement used across dance styles and by gender (e.g., women lift other dancers in contemporary dance but usually not in ballet50). Previous studies have shown a difference in injury location when comparing across dance styles50,98. Direct comparisons between middle school and high school/university-aged dancers have not
demonstrated any difference in injury incidence42. Therefore, dance style (ballet and contemporary), gender, and age (high school and college) are of interest as predictors of musculoskeletal injury
incidence.
Hypothesis 1.1: Ballet dancers had an increased incidence of lower extremity and decreased incidence of upper extremity injuries compared to contemporary dancers.
Hypothesis 1.2: Male dancers had more upper extremity injuries than female dancers. Hypothesis 1.3: There was no difference in lower extremity injury incidence by gender. Hypothesis 1.4: There was no difference in injury distribution when comparing high school dancers to college dancers.
Specific Aim 2 (Injury predictors): Identify prospective predictors of sustaining musculoskeletal injuries in an adolescent/young adult dance population. The Triad is a syndrome where low energy availability, amenorrhea, and osteoporosis are present in a female. Presence of at least one condition
gives an increased likelihood of observing the other conditions as well101. Cigarette smoking has been shown to be associated with increased incidence of lower extremity injury102. A prior history of injury has been shown to be a risk factor of subsequent injury in a variety of sports settings103–105. Overuse injuries are more common in dance than traumatic injuries42,43, and differences exist in types of movement used across dance types and by gender (e.g., women lift other dancers in contemporary dance but usually not
Hypothesis 2.1: Low body mass index (BMI), prior history of injury, having PDE, being a current smoker, and amenorrhea (in females) were predictors of musculoskeletal injuries.
Hypothesis 2.2: Predictors of musculoskeletal injury differed by gender.
Specific Aim 3 (PDE prevalence): Measure prevalence of PDE [either: a) having a positive screen on the EAT-26 or BITE or b) being institutionally monitored] in an adolescent/young adult dance population. Ballet dancers have a certain body type/aesthetic that is considered ideal, while
contemporary dancers faced less with this type of expectation106. In the general population, females have a markedly higher prevalence of EDs than men. Younger dancers face different pressures and hold
different perceptions of body image than older dancers100.
Hypothesis 3.1: Ballet dancers had a higher prevalence of PDE than contemporary dancers. Hypothesis 3.2: Females had a higher prevalence of PDE than males.
Hypothesis 3.3: High school dancers had a higher prevalence of PDE than college students. Specific Aim 4 (PDE predictors): Identify cross-sectional predictors of having PDE in an adolescent/young adult female dance population. By definition, AN, has its severity classified primarily based on BMI107. Furthermore, the Triad is a syndrome where low energy availability, amenorrhea, and osteoporosis are present in a female. Presence of at least one condition gives an
increased likelihood of observing the other conditions as well101. Finally, cigarette smoking has been shown to be used as a weight control strategy 108.
CHAPTER 4: METHODS
Institutional Review Board approval for this study was obtained from the University of North
Carolina at Chapel Hill (IRB #14-1044) and Winston-Salem State University (IRB # 2986-15-0030).
4.1 Study population
The study population was comprised of dancers who began enrollment at the University of North
Carolina School of the Arts (UNCSA) School of Dance during or after Fall semester 2009 and were
followed up through the end of their studies at UNCSA or the end of Spring semester 2015, whichever
came first. The UNCSA dance program trains both high school and college students in either ballet or
contemporary dance. The dance style that a dancer was focusing on at entry to UNCSA was considered
the dance style for the entire duration of the study period. The small number of students (n=13) who were
enrolled in both high school and college programs during the follow-up study were counted as two
separate, independent participants in this study.
4.2 Study design
This study was a cohort study that followed UNCSA high school and college dancers. The two
outcomes of interest were musculoskeletal injury rates and prevalence of PDE. EDs are conditions that
typically have a more gradual onset, and early stages of EDs and PDE are difficult to identify. Therefore,
incidence is difficult to calculate, and prevalence in a previously unscreened population is more clinically
relevant, as the exact moment of incidence is challenging to pinpoint.
4.3 Data
All data were obtained through the UNCSA Student Health Services (SHS). UNCSA SHS is the
sole location on-campus where all students receive clinical care; clinical records from off-campus
locations were not obtained for this study. However, off-campus locations were assumed to account for
essentially zero treatment for injuries and EDs. UNCSA SHS consists of a multidisciplinary team
consisting of a physician, nurse practitioner, physician’s assistant, nutritional services, counseling,
data to the principal investigator (PI; BITE scores, EAT-26 scores, skinfold caliper measures, height, and
weight). The remaining information was manually abstracted from Medicat (Atlanta, GA), the electronic
health record (EHR) system used by UNCSA. Medicat was the EHR system used by UNCSA starting Fall
2009. Data obtained and abstracted were linked initially through student identification (ID) number.
When student ID number was unavailable, data linkage was performed through any relevant information
that was available (a combination of first name, last name, date of birth, age, and semester(s) of
enrollment at UNCSA).
4.4 Identification of study cohort
UNCSA dancers were identified through two UNCSA rosters. The first roster was generated from
Medicat by UNCSA SHS for dancers who had a record in Medicat through October 15, 2014. Only
information for students in the School of Dance were included in the roster; information from students of
other UNCSA schools (i.e., schools of Design & Production, Drama, Filmmaking, Music, and Visual Arts)
were not included. This roster from Medicat included dancers who began enrollment prior to Fall 2009
and dancers who attended UNCSA exclusively for summer intensives; these dancers were excluded from
the present study. This roster also captured all dancers enrolled through Spring 2015, as all dancers
enrolled at UNCSA in Spring 2015 were also enrolled in Fall 2014 (written correspondence with Director
of UNCSA Student Health Services, February 2015). Medicat only captures the current UNCSA school in
which the student is enrolled. The first roster did not include any dancers who left the UNCSA School of
Dance for another UNCSA school, resulting in potential under-ascertainment of the eligible study cohort.
Therefore, a second roster was obtained from UNCSA SHS to supplement the first roster. This
when these dancers were in a UNCSA school other than the School of Dance were excluded from this
study.
4.5 Outcome variables
The clinical outcomes for the cohort were abstracted from the records in Medicat. The Medicat
system was queried using last name.
4.5.1 Injury
Musculoskeletal injury, one of the two main outcomes of interest, was defined as any event where
a dancer was seen at the UNCSA SHS and the dancer needed to modify or curtail their dancing activity
for at least one day due to the injury. Injuries were characterized in a number of ways: body part (e.g.,
ankle, back, knee), diagnosis (e.g., strain, sprain, tendinitis), and type (traumatic vs. overuse).
An injury was classified as a traumatic injury by the PI if there was one clear event that caused
the injury. All other injuries were classified as overuse injuries. For injuries where it was unclear if it was
a traumatic or overuse injury, consensus was reached through discussions between the PI and a clinician
certified in both athletic training and physical therapy. Subsequently, a validation study using 5% of the
sample was performed to asses for intra-rater reliability of the classification of injury type; the PI and a
physical therapist/musculoskeletal injury epidemiologist independently reviewed 51 records and classified
injury types as traumatic, overuse, or unable to determine.
The start date of an injury was defined as the first day a dancer was seen at the UNCSA SHS,
regardless of whether or not dance activity was modified after the initial visit. The end date of an injury
was defined as either: a) the first day one of the medical providers noted that the dancer could either
perform dance activity to tolerance or was cleared for dance activity (whichever came first) or b) the last
day a dancer was seen at UNCSA SHS for the injury (i.e., if there was no indication anywhere that the
dancer could either perform dance activity to tolerance or was cleared for dance activity).
4.5.2 Possible disordered eating
The presence of PDE, was defined as either a) the dancer being monitored by UNCSA SHS or b)
a positive screen for DE on either the EAT-26 or BITE. The EAT-26 and the BITE were administered
UNCSA SHS monitored students in multiple ways. At the beginning of the present study in Fall
2009, an Eating Issues Committee (EIC) was in place. The EIC was previously formed to address
nutrition-related concerns of UNCSA, and “safeguard[s] the physical and psychological welfare of
individual students suffering from eating related disorders” (written correspondence with Director of
UNCSA Student Health Services, February 2015). The EIC met monthly, and emergency meetings were
convened as necessary. The EIC’s permanent members included the Health Services Director,
physician, registered dietitian, counselor, and athletic trainer (all members of the UNCSA SHS clinical
team). Based on clinicians’ notes seen in Medicat, the last known meeting of the EIC was in October
2012. The EIC was replaced by another committee in 2013 that met more frequently about a variety of
health concerns (not limited to eating issues; personal correspondence with UNCSA athletic trainer). For
the entire duration of the present study (i.e., from Fall 2009 through Spring 2015), UNCSA SHS also
monitored certain students’ weight by weighing them every time they visited SHS and/or weighing them
blindly (i.e., the dancer did not know what their weight was after being weighed). A note was present in
the EHR if a student was monitored by the EIC and/or being weighed regularly.
A dancer had a positive screen for DE on either the EAT-26 or BITE if he or she scored at least
10 on either instrument at least once. Traditionally, a cutoff score of 20 is used for positive screen for DE
on the EAT-26 and the BITE. However, for the purposes of this study, a lower cutoff score of 10 was
used because: a) all students who scored at least 10 on either the EAT-26 or the BITE were referred to
the UNCSA dietitian for an appointment to discuss their eating habits and b) prior research shows that
One source of data was the health history form, a document that every UNCSA student completed prior
to enrollment at UNCSA (Appendix 3). Health history forms were scanned into the EHR database by
UNCSA as part of standard operating procedures, and data were manually entered by the PI into
Microsoft Excel. Data were entered based on the responses that students provided. However, for the
question of whether or not a student wears a seatbelt, there was one student whose response was
recoded from “no” to “yes”. Specifically, this student indicated on the form “no” for two consecutive items
(whether or not they regularly exercised and whether or not they wore a seatbelt). Given that the
population being studied comprises of elite pre-professional dancers, it was assumed that all participants
regularly exercised, and thus we assumed the dancer (n=1) who answered “no” for both regularly
exercising and wearing a seatbelt did not carefully review the form and marked “no” for not wearing a
seatbelt in error. Furthermore, this dancer selected “no” for every single item on the health history form.
4.6.1 Physical characteristics
Physical characteristics included anthropometric measures, history of frequent vomiting, and
HIMP. Anthropometric measures to calculate BMI and body fat percentage (BF%) were collected by
UNCSA SHS staff when a dancer began enrollment at UNCSA. BMI was calculated as:
BMI= weight (in kilograms)/height (in meters)2
Body fat percentage (BF%) was calculated from the Sloan body density (BD) equations by gender and
Siri BF% equation111,112, where:
BDFemale=1.0764 – [0.00081 * iliac crest skinfold] – [(0.00088 * tricep skinfold] BDMale= 1.1043 – [0.001327 * thigh skinfold] – [0.00131 * subscapular skinfold] BF% = (495/BD) – 450, and all skinfold measurements were measured in millimeters
Prior studies investigating the association between anthropometric measures and injuries have
yielded mixed results113–116, while by definition low BMI serves as one criterion for being diagnosed with certain types of EDs107. BMI and BF% were routinely calculated and recorded from Fall 2009-Spring 2013. Beginning in Fall 2013, routine collection of BMI and BF% at UNCSA ended.
4.6.2 Mental health history
Mental health history included measures on both personal mental health history and family history
worry, anxiety, or obsession; and treatment for attention deficit disorder (ADD) or attention deficit
hyperactivity disorder (ADHD). Family history of mental health disorders included history of alcohol or
drug problems, psychiatric illness, and suicide. Prior research has shown that elite athletes who are
injured are more likely to experience psychological consequences, including depression117,118; however, limited literature exists on whether athletes with worse mental health measures are more likely to sustain
injuries. Furthermore, those diagnosed with EDs are at increased risk of having comorbid conditions with
disorders including mood disorders (e.g., depression), impulse-control disorders, and substance use
disorders55. Additionally, a family history of mental health disorders can be used as a proxy for mental health disorders of a given individual, as those with a family history of mental health disorders are more
likely themselves to develop mental health disorders119–121. 4.6.3 History of risk-taking behaviors
History of risk-taking behaviors included history of alcohol use, illegal drug use, smoking, and not
wearing a seatbelt. Multiple studies have been conducted investigating the association between
risk-taking behaviors and physical activity-related injuries with inconsistent results122,123. Risk-taking behaviors have been shown to be associated with abnormal eating patterns indicative of PDE or an
ED124,125.
4.6.4 Prior history of injuries
Prior history of injuries included history of knee problems, recurrent back pain, neck injury, back
injury, and broken bones. For Specific Aim 2 (injury predictors), prior history of injury while enrolled at
UNCSA was also considered. Across different types of injuries, the single factor most strongly associated
observed was determined based on the last date that a student had an entry in Medicat. For all students,
it was assumed that the student was enrolled at UNCSA for the entire duration of the last academic term,
since it was not possible to obtain a student’s exact withdrawal date from UNCSA for the students who
did not graduate.
4.8 Data analysis
All data analyses were performed with SAS 9.3 (Cary, NC). All results were considered
statistically significant at p<0.05. To address Specific Aims 1 (injury incidence) and 2 (injury predictors),
Poisson and negative binomial (NB) regression were used to generate incidence rates and incidence rate
ratios (IRRs). Robust standard errors with an exchangeable working correlation matrix were generated
using generalized estimating equations (GEE). Quasi-Akaike information criterion (QICu) scores (with an
additional penalty for the number of parameters in each model) were used to determine if Poisson models
or NB models were the best fit. Multivariable regression was used to generate IRRs for the outcome of
injury for Aim 2 (injury predictors) for all dancers. An a priori decision was made to stratify all models by
gender because the dancing activities performed in ballet vary by gender. Evaluation of the model with
interaction terms compared with models without interaction terms was used to assess departures from
perfect multiplicativity of joint effects. Specifically, QICu scores and Wald tests for the interaction term
were used. Interaction tables were used to calculate relative excess risk of interaction (RERI) to assess
deviation from perfect additivity of joint effects131,132.
For Specific Aim 2 (injury predictors), to account for possible variations in injury rate by time, two
variables were parameterized as time-varying covariates: age and history of injury while at UNCSA. Each
dancer had one observation per semester enrolled at UNCSA. For example, if a dancer was enrolled for
three semesters, there were three observations for this dancer. Age was defined as age at the beginning
of the semester. History of injury was conceptualized in two ways: 1) as a dichotomous variable
indicating whether or not a student was injured during their previous semester at UNCSA and 2) as
variable accounting for cumulative number of injuries for all prior semesters at UNCSA.
To address Specific Aim 4 (predictors of PDE), log binomial regression was used to generate
prevalence ratios (PRs). Multivariable models were built only for women, since men have a low
predictors of PDE. Multivariable log binomial regression was used for the outcome of screening positive
for ED symptoms for Specific Aim 4 among females only. Log binomial modeling was used to estimate
prevalence ratios (PRs) and 95% CIs. Interaction terms were used to determine if model results should
be stratified by dance type (ballet/contemporary) or program (high school/college). Likelihood ratio tests
were used to evaluate the models with interaction terms compared with models without interaction terms
to assess for departures from perfect multiplicativity of joint effects. Bivariate analysis using a chi-square
test was conducted among males only to determine if any predictors PDE exist in this population.
For all specific aims, exploratory analyses were conducted to determine whether the continuous
measures of BF% and BMI were best specified as categorical or continuous measures in models. For all
categorical measures, dummy variable coding was used in the modeling.
4.9 Variable selection for multivariable models
A potential conceptual model for the relationship of covariates and the two outcomes of injury and
PDE is shown in Figure 4.1. General domains of variables (excluding the two outcome measures)
included: physical characteristics, history of injury, history of ED, mental health history, and health risk
behaviors. For categorical variables, a variable was eligible for inclusion in multivariable models if: 1) the
univariate distribution had at least five observations in each category for the gender being modeled and 2)
the crude model resulted in an estimate with p<0.25. If any general domain did not have a variable with
p<0.25 in crude modeling, then the variable in the domain with the smallest p-value was eligible for
inclusion. Model building then proceeded in a forward stepwise procedure by domain. The best
multivariable model was selected in part using statistical criteria, based on the concept that the preferred
Table 4.1. List of explanatory variables DEMOGRAPHIC CHARACTERISTICS
Gender Program Style
PHYSICAL CHARACTERISTICS Body mass index
Body fat percentage
History of frequent vomiting
History of irregular menstrual periods MENTAL HEALTH HISTORY
Family history of alcohol/drug problems Family history of psychiatric illness Family history of suicide
History of excessive worry, anxiety, or obsession History of treatment for ADD or ADHD
History of depression
HISTORY OF RISK-TAKING BEHAVIORS History of alcohol use
History of illegal drug use History of smoking
History of wearing a seatbelt HISTORY OF INJURY
History of concussion
History of frequent or severe headache History of severe head injury
History of knee problems History of recurrent back pain History of back injury
Table 4.2. Length of academic terms (in days), University of North Carolina School of the Arts, Fall 2009-Spring 2015
High School College
Fall Spring Fall Spring
2009-2010 103 142 87 142
2010-2011 103 141 87 141
2011-2012 116 129 116 128
2012-2013 118 128 118 128
2013-2014 125 124 118 124
Figure 4.1:
Conceptual model of covariates and outcomes
Physical characteristics
BMI
Skinfold
Menstrual history (females only)
History of Injury
PDE
EAT-26
BITE
Eating Issues Committee
Mental health
(self-report)
Family history
Self-history
Injury at UNCSA
One encounter at UNCSA SHS, at least
one day of modified activity
History of ED
(self-report)
Health risk
behaviors
(self-report)
Seatbelt use
Alcohol use
Illegal drug use
Smoking
CHAPTER 5: INJURY RESULTS (PAPER 1)
5.1 Background
Injuries from specialized athletic activities place a high burden on society. Injuries occur relatively
frequently in the general population133,134, but are especially common in physically active populations, such as athletes13–17. Over one-quarter of all emergency department visits are due to injuries in the United States (US)18. Among children 18 years or younger in the US, lifetime costs (both medical costs and work loss costs) associated with being treated at an emergency department for an injury in 2010 was $49.9
billion135. Furthermore, among those 18 years or younger, 20% of all injury-related emergency department visits are sport-related19. Sport-related injury emergency department visits account for the highest proportion of injury-related emergency department visits among those 5-14 and 15-24 years of
age20. In addition to economic costs, effects of injuries at a young age are both physical and mental24, and these effects can persist for years or appear decades later15,25,26.
One form of specialized and creative athletic activity is dancing, and injuries occur frequently in
ballet and contemporary dancers36,39. Previous studies focusing exclusively on ballet or contemporary dancers have found an injury incidence ranging from 0.62 to 4.7 per 1,000 hours of dance3,36,41–43,45. Among elite adolescent athletes, one review article found that injury incidence ranged from 1.6 (female
ballet and contemporary dancers52,98. The remaining two studies focusing on contemporary dancers investigated either professional dancers36 or female dance majors and minors99. None of these prior studies involved pre-professional male dancers studying either ballet or contemporary dance.
Furthermore, only three studies focus on pre-professional dancers3,41,44. Two of these studies were based in the US: one was limited by small sample size (n=39)3 and the other focused exclusively on ballet dancers41. The remaining study was based in the United Kingdom44. A better understanding of the injury incidence and predictors of injury in dancers is important because it is one of the most salient health
problems relevant to dancers11.
Therefore, the goal of this study was to 1) provide a descriptive epidemiology of the incidence of
musculoskeletal injuries in an adolescent/young adult dance population and 2) identify parsimonious
regression models that could be potentially used to predict injury incidence. In particular, we were
interested in comparing ballet to contemporary dancers, female to male dancers, and high school dancers
to collegiate dancers. Based on prior literature42,50,98, we hypothesize that 1) ballet dancers will have an increased incidence of lower extremity and decreased incidence of upper extremity injuries compared to
contemporary dancers, 2) male dancers will have more upper extremity injuries than female dancers, 3)
there will be no difference in lower extremity injury incidence by gender, and 4) there will be no difference
in injury distribution when comparing high school dancers to college dancers. We also hypothesized that
predictors for dance injury differ by gender, and therefore built parsimonious predictive models separately
for males and females.
5.2 Methods
We selected the University of North Carolina School of the Arts (UNCSA) School of Dance as our
study population because it provides instruction to a diverse group of dance students that includes all the
key demographics listed above. Additionally, UNCSA provides on-site health care services to its dancer
students and records all health care encounters using a centralized electronic healthcare record. The
closed nature and near-complete follow-up of this population facilitate the historical reconstruction of a
prospective cohort study with clinically-verified incident injuries as the endpoint of interest.
We conducted a historical cohort study with incident injury as the outcome of interest. The study