WEB APPLICATION PERFORMANCE PREDICTION
H. Karlapudi and J. MartinDepartment of Computer Science Clemson University Clemson, SC 29634-0974
Email: hkarlap, [email protected]
ABSTRACT
In this paper, we propose and validate a web application performance prediction tool that predicts the performance of web applications between specified end-points. The model, which considers only the impact of the network on the application, is driven by easily obtainable network characteristics. Our research suggests that it is possible to reliably predict the average response time of a simple web application with an error of less than 15%. The model uses easily obtainable network performance measures and unlike other models, works well in both drop-tail and RED environments.
KEYWORDS
Network performance, analytic modeling, application response time
1. Introduction
The management of service quality is fundamental to computer networks. As IP networks become further ingrained in corporate WANs, robust network management practices that include service level agreement (SLA) monitoring is vital. Performance prediction based on either current or anticipated network conditions is an important component of network configuration and workload management. Accurately predicting application performance based on measured network statistics allows the organization to avoid costly over provisioning to meet service level agreements. Performance prediction will be a crucial part of future networking environments that support admission control, dynamic provisioning and SLA definitions and negotiation. A challenge in network management is translating low level performance measures into meaningful quantifications of utility. Because web applications continue to dominate both the Internet and corporate networks, being able to predict web application performance is a step towards bridging the gap between network level statistics and end-user perceived quality.
In this paper, we present a stochastic web application performance prediction model. This model is given the amount of data to be transferred along with a set of measured network statistics and it returns a predicted response time. Response time is an essential metric for
service providers to validate network provisioning and for end-users to monitor the relative health of a network connection. The performance of a web application depends on many factors including the network, the systems, the application and most importantly the end-user. Our research focuses on the impact of network dynamics on the performance of web applications. Network dynamics are determined by provisioned resources over the path and by the traffic load in the network and are typically characterized by loss rate and round trip time (RTT). Researchers have proposed a number of analytic models to characterize TCP performance in terms of observed network characteristics [1,2,3,4,5]. Our work is based on the premise that TCP performance characterization is highly sensitive to packet loss dynamics and that the analytic models developed thus far do not accurately capture the nature of TCP packet loss over a realistic range of network dynamics. Our research is also motivated by the need to develop application level models rather than models of steady-state TCP throughput.
We based our model on three analytic TCP throughput prediction models proposed in [2] (hereby referred to as the Amherst model), [4] (referred to as the Guerin model) and [6] (referred to as the Cardwell model). The Amherst and the Guerin models predict steady-state TCP throughput and are applicable only to bulk transfer TCP flows. The Cardwell model also predicts steady-state throughput but also includes the start-up effects of TCP. Based on our experiments we observed that each model is best suited to specific environments. The Amherst and the Cardwell models are more applicable for networks using drop-tail queuing while the Guerin model is applicable to environments using random early drop (RED) queuing. The prediction error of each model increases in environments that violate assumptions that have been made. The models are most sensitive to assumptions that were made about packet loss. Although each model represents a significant contribution, none accurately models the wide range of loss dynamics that can exist in a TCP/IP network.
The starting point was the proposed changes to the Guerin model to support correlated loss that were described in [3]. We refer to this model as the Correlated model. The contribution of our work is as follows: 1) We
validate the Correlated model in a network test-bed environment using both invasive and non-invasive techniques for estimation of network characteristics. 2)We extend the Correlated model to include the start-up effects of TCP. We based these changes on [6]. 3) We formulate the model to produce a web response time (WRT) prediction rather than a throughput prediction. We refer to this enhanced model as the Web Response Time prediction model which is formalized by Equation 1.
WRT = f(first packet loss rate, correlated loss rate, RTT, amount of data transferred) 1
The remainder of this paper is organized as follows. In Section 2 we discuss the network test-bed used for our experiments and the network configuration. In Section 3, we discuss the drawbacks of the Amherst and the Guerin throughput prediction models. In Section 4 we describe and validate the Correlated model. In Section 5 we describe our Web Response Time prediction model and present a detailed analysis of our experimental results. Finally in Section 6 we identify the limitations of our work and suggest enhancements for the Web Response Time prediction model.
2. Network setup and Configuration
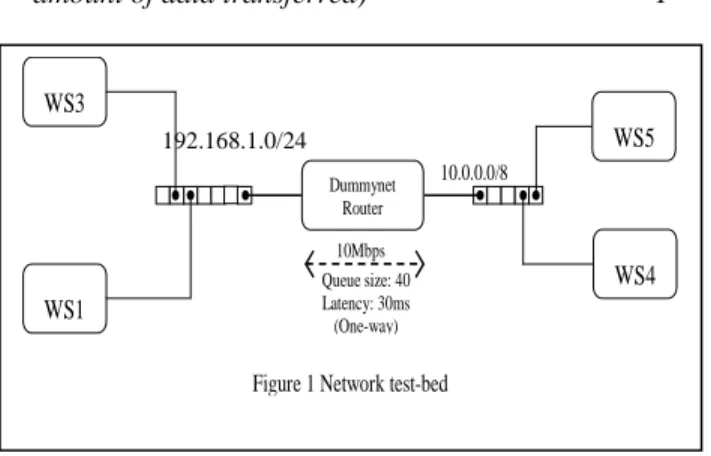
The network test-bed used for our work is shown in Figure 1. The setup consists of two private networks: the 10.0.0.0/8 network and 192.168.1.0/24 network connected through a router. The router is a Dell Optiplex GX260 with 512MB of RAM and is equipped with a single Pentium 4 processor running at 2.4GHz. It runs FreeBSD 4.8 and uses dummynet[7] for emulation of WAN characteristics. The 192.168.1.0/24 network includes three workstations: WS1 (192.168.1.2), WS2 (192.168.1.3) and WS3 (192.168.1.5). The 10.0.0.0/8 network includes two workstations: WS4(10.0.0.3) and WS5(10.0.0.5). WS1 and WS4 are Dell Optiplex GX260 with 1GB of RAM. They are equipped with a single Pentium 4 processor running at 2.4GHz. They run Redhat8.0 with kernel version 2.4.18-14. WS5 has a dual Xeon processor running at 2.4 GHz. It’s a Dell Precision 450 with 2GB RAM. WS3 has the same configuration as that of WS5 but with 1GB RAM. Both the workstations run Redhat 8.0 with kernel version 2.4.18-14(smp).We define the downstream direction from the 10.0.0.0/8
network towards the 192.168.1.0/24 network and upstream direction from 192.168.1.0/24 to the 10.0.0.0/8 network. We used SURGE (Scalable URL Reference Generator) [8] to generate background traffic. We locate the SURGE client on WS3 and the web-server is located on WS5. Apache version 2.0.40 is used as the web-server. SURGE uses the number of emulated web users, referred to as user equivalents, as a measure of workload intensity. By varying the number of user equivalents a wide range of network dynamics could be achieved. We have a configurable number of upstream TCP connections generated by a client-server application. This traffic is used to control the level of bursty network dynamics by inducing ACK compression [9]. In addition to the background traffic, a set of additional TCP connections is used for TCP flow level analysis. This traffic is generated by a simple client-server application. The client is located at WS1 and the server is located at WS4. The majority of SURGE traffic and the analysis traffic flows in the downstream direction.
All the experiments were conducted using a bottleneck bandwidth of 10Mbps and a round trip delay of 60msec. The TCP socket buffer sizes were set to 64Kbytes. We tested our model with drop-tail and RED queuing. For drop-tail, the queue size was fixed at 40 packets. RED is characterized by four variables: min_th , max_th, max_p and w_q [10] . For our experiments max_p was set to 0.1, w_q was set to 0.002, min_th is set to 0.2 times the total buffer size and max_th is set to 0.8 times the total buffer size. These settings were based on the recommendations made by Floyd in [11].
We conducted four sets of experiments in an effort to evaluate our models over a broad range of network dynamics. Set I and Set II include experiments for the analysis of bulk transfer TCP flows, whose size varied between 2MB and 8MB, and Set III and Set IV experiments are used for the analysis of short-lived TCP flows whose size varied between 5KB and 100KB. In Set II and Set IV experiments we had additional upstream traffic.
We used tcpdump[12] to collect network traces at WS1, WS4 and at the 10.0.0.1 interface of the router. We did a flow level analysis of the trace files obtained from the set of TCP connections that were under observation ( i.e., the analysis traffic between WS4 and WS1) to obtain the actual values of various network characteristics such as loss rate, round trip time (RTT), response time, throughput and link utilization. Our analysis also required non-invasive network measures including a ping monitor and an UDP correlated loss monitor both of which operated between nodes WS4 and WS1.
3. Analysis of existing models
In [13] it is shown that TCP loss events are not independent in nature even in a lightly congested network. Measurement studies confirm that packet loss over the internet is correlated over time-scales between 200-1000ms [13, 14, 15]. It is well-known that correlated 10.0.0.0/8
WS4 WS5
Figure 1 Network test-bed
WS3
WS1
10Mbps Queue size: 40 Latency: 30ms (One-way) Dummynet Router
packet loss has a significant impact on the performance of TCP [14]. The objective of this section is to motivate the need for a TCP model that accurately considers packet loss dynamics.
3.1 The Amherst Model
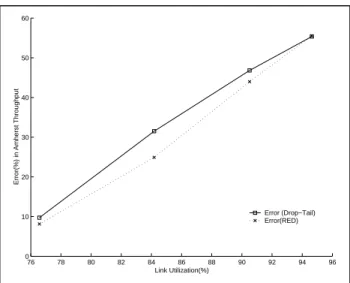
It has been observed from other performance studies [16] that the Amherst model leads to under-estimation of TCP throughput for drop-tail and RED buffer management policies over a range of network conditions. In our analysis, which is fully described in [17], we found that the error in the Amherst throughput prediction is due to two reasons: first, it assumes extreme burstiness over a single RTT which may not be applicable in all environments. Second, it does not accurately account for the burstiness in packet loss that spans over multiple RTTs. We found that the error in the Amherst model increases with the level of correlated packet loss.This is because the Amherst model only takes correlation over one RTT into account. Networks using drop-tail queuing and in some circumstances RED queuing are prone to correlated packet loss where the probability of packet loss is higher for some amount of time following a first loss event. This higher packet loss rate state might persist for a period greater than an RTT. In such a situation, the first loss probability that is used by the Amherst model is too high as the first loss event count is incremented multiple times for bursts of loss that cross TCP RTT boundaries. Hence the error in throughput estimation increases at higher levels of correlation. This can be observed from Figure 2 that shows the error in the Amherst model throughput estimation for both drop-tail and RED configurations in our Set II experiments. Although we don’t show it, the level of correlated loss increases linearly with link utilization. These results are based on input parameters obtained from flow based analysis of the TCP connections under observation.
3.2 The Guerin Model
Figure 2 Error in Amherst throughput estimates
In Figure 3 we show the error in the Guerin model throughput estimates for Set II experiments. Guerin model is not applicable to drop-tail queuing because of its random loss assumption. From our experiments we observed that the Guerin model throughput estimates were accurate for RED queuing at low levels of correlation in packet loss. However, in other situations the Guerin model over-estimates TCP throughput. As the level of packet loss correlation increased the error also increased. This error is because the Guerin model assumes loss is random and uncorrelated.
Figure 3 Error in Guerin throughput estimates
4. The Correlated Model
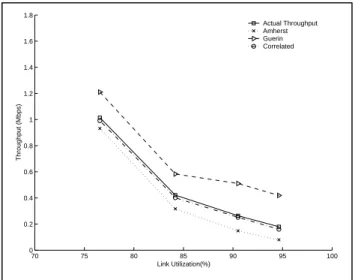
The Correlated model proposed in [3] is driven by three parameters: p(loss rate when the network is not congested), p’ (loss rate applicable when the network enters a congested state) and RTT. The parameters can be estimated invasively or non-invasively. For some of our analysis we estimated p and p’ from a flow level analysis of tcpdump traces. The frequency of first packet loss and consecutive packet loss can be obtained in a manner that accurately reflects the effects of actual loss events on the connection. In Figures 4 and 5, we compare the predicted throughput of the Amherst model, the Guerin model and the Correlated model with the actual throughput. All these models including the Correlated model were run using parameters obtained invasively.
Figure 4 Throughput analysis (drop-tail,Set II)
76 78 80 82 84 86 88 90 92 94 96
0 10 20 30 40 50 60
Error(%) in Amherst Throughput
Link Utilization(%)
Error (Drop−Tail) Error(RED)
70 75 80 85 90 95 100
0 50 100 150 200 250
Error(%) in Guerin Throughput
Link Utilization(%) Error (Drop−Tail)
Error(RED)
70 75 80 85 90 95 100
0 0.2 0.4 0.6 0.8 1 1.2 1.4 1.6 1.8
Throughput (Mbps)
Link Utilization(%)
Actual Throughput Amherst Guerin Correlated
Figure 5 Throughput analysis (RED,Set II) From the figures we observe that the Correlated model predictions are more accurate compared to that of the Amherst and the Guerin models. In these experiments the level of packet loss correlation in the network varied from 20% to 80% in case of drop-tail queuing and from 5% to 30% in case of RED queuing. The level of correlation increased as the link utilization increased. The figures illustrate that the Guerin model exhibits a prediction error that ranges from 20% to 50% at low levels of correlation and for RED queuing. This error increases to more than 100% as the link utilization increases. The Amherst model, in general, under-estimated throughput in both the cases. The error ranged from 10% to 50%. The Correlated model could predict throughput with 95% precision in case of RED and drop-tail queuing under various network dynamics.
This model can also be driven by parameters obtained non-invasively. RTT is obtained non-invasively using standard Ping. Our experiments show that a ping RTT is very similar to the RTT observed by TCP. We developed a client-server UDP application that is used to estimate p and p’ non-invasively. The client sends a burst of packets to the server and the server observes the number of bursts with loss and the frequency of bursts with consecutive losses. This tool implements the ‘three counter technique’ to compute correlated packet loss [3]. For every probe packet successfully sent, the success counter is incremented by 1. The pdropped counter is incremented by 1 for each loss event. For n successive packets lost the p_dropped counter is incremented by n-1. From the values of these three counters we compute the values of p and p’ as follows. The application estimates
the values of p and p’ in the downstream direction. For the experiments reported in this paper, the client is configured to send a burst of 4 packets every two seconds. There was no delay between the packets sent in a single burst, they were sent back-to-back. The error associated
with the Correlated model increased to 15% when computed using non-invasive parameters.
5. Web Response Time prediction Model
The majority of web transfers over the Internet are short-lived and so it is possible that the application finishes sending data before reaching steady state. In such a scenario the application response time is dominated by the latency of the slow-start phase of TCP. The Cardwell model extends the Amherst model to include the start-up effects of TCP. The model has four components; latency of connection establishment, latency of initial slow-start, latency of the first loss event and latency during steady-state transfer. Our objective is to extend the Correlated model to include the start-up effects of TCP. We refer to this model as the Web Response Time (WRT) prediction model. As TCP sends single packets during the connection-establishment phase, packet loss correlation does not come into play. Hence we use Cardwell’s equation with no changes to compute the latency of connection establishment . To compute the expected value of latency during initial slow start, we need to compute the number of rounds during slow start. This value multiplied by the RTT gives the latency during slow start. Let d be the total amount of data that needs to be sent by the application. Then E[dss], the number of data segments expected to be sent in the initial slow start phase is given by Equation 2
where p is the average packet loss rate. The expected value of window size, E[Wss], at the end of slow start is given by Equation3.
E[Wss] = (E[dss] ( – 1) + w1)/w1 3
where is the increase in congestion window in each round. = (1+1/b) , where b is the number of segments acknowledged per ACK. From Equations 2 and 3 we can derive the number of rounds r1 in slow start phase .
r1 = log
E[Wss]
Now expected latency during slow start phase E[Tss] is given by Equation 4. As we have already seen
E[start] = RTT*r1 4
packet losses are indicated through a triple duplicate ACK or through a retransmission time-out. Expected value of latency due to packet loss, E[loss], is given by equation 5.
E[loss] ={[PTO(w) E[ZTO] + (1 - PTO(w)) RTT]} (1-(1-p)d) 5
Where PTO(w) is the probability of a retransmission timeout, E[ZTO] is the expected cost of a retransmission timeout. We assume that the probability of triple duplicate loss is 1-PTO(w). The latency of a triple duplicate ACK is equivalent to an RTT. In Equation 5, (1-(1-p)d) is the probability that a slow start phase ends in a packet loss. The values of E[ZTO] and PTO(w) are derived in [3]. These two values account for the
70 75 80 85 90 95 100
0 0.2 0.4 0.6 0.8 1 1.2 1.4 1.6 1.8
Throughput (Mbps)
Link Utilization(%)
Actual Throughput Amherst Guerin Correlated
E[dss] =
d-1
k=0
pk(1-p)k
+ (1-p)dd 2
pdropped success p =
p’ = p_dropped pdropped + p_dropped
correlation in packet loss during the start-up phase. The time required to transfer the rest of the data is obtained by dividing the amount of remaining data by the throughput we obtain from the Correlated model. The amount of remaining data is given by d-E[dss]. Therefore we have Equation 6 where
E[rem] = d-E[dss]/C(p,p’,RTT) 6
E[rem] is the time required to transfer remaining data, C(p,p’,RTT) is the throughput of a flow, predicted by the Correlated model, whose loss is p, correlated loss rate is p’ and round trip time is RTT. Now the latency of a flow is given by Equation 7
WRT = Connection establishment latency +E[start] + E[loss] + E[rem] 7
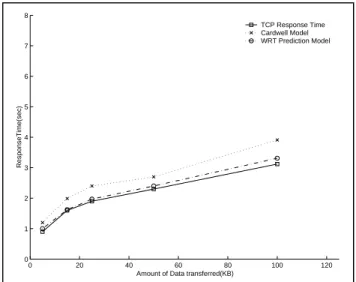
In Figures 6 and 7 we compare the throughput estimates of the WRT prediction model with that of the Cardwell model These figures are plotted when the link-utilization is around 85% and the level of correlation in the network varied from 5% to 25%.
Figure 6 Response time estimates (drop-tail, Set IV) Figure 7 illustrates that the error in response time estimates of the Cardwell model is highest for experiments using RED queuing with upstream traffic (Set IV) because the Cardwell model does not consider randomness associated with packet loss. As the level of correlation increases, the error in both the models increases. The Cardwell model error in the experiments without upstream traffic (set III) varied between 3% and 17% and the error in Set IV experiments varied between 10% and 25% as shown in figures 1 and 2. However, the Web Response Time prediction model error was much lower and it ranged from 1% to 5% for both drop-tail and RED queuing.
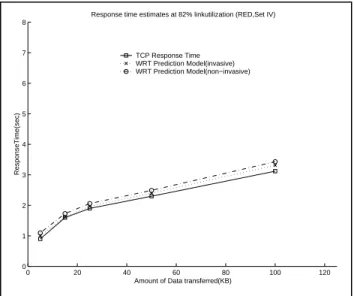
Figure 7 Response time estimates (drop-tail, Set IV) In Figures 8 and 9, we compare the response time estimates of invasive and non–invasive statistics. It can be observed that the error associated with the Web Response Time prediction model is less than 15% when using non-invasive parameters.
Figure 8 Response time estimates (drop-tail, Set IV)
6. Conclusions and Future Work
In this paper, we have shown that the accuracy of previously proposed stochastic models of steady-state TCP throughput deteriorates as the level of correlated loss increases. We proposed and evaluated a new model that incorporates a correlated loss model. Our results show that it is possible to predict average response times with an error less than 15% using non-invasive performance measures. Previous models were limited to specific environments and exhibited much larger errors in prediction when applied to an environment where model assumptions did not hold.
0 20 40 60 80 100 120
0 1 2 3 4 5 6 7 8
ResponseTime(sec)
Amount of Data transferred(KB)
TCP Response Time Cardwell Model WRT Prediction Model
0 20 40 60 80 100 120
0 1 2 3 4 5 6 7 8
ResponseTime(sec)
Amount of Data transferred(KB)
TCP Response Time Cardwell Model WRT Prediction Model
0 20 40 60 80 100 120
0 1 2 3 4 5 6 7 8
ResponseTime(sec)
Amount of Data transferred(KB)
Response time estimates at 89% linkutilization (drop−tail,Set IV) TCP Response Time WRT Prediction Model(invasive) WRT Prediction Model(non−invasive)
Figure 9 Response time estimates (RED, Set IV) The most significant limitation of our work is that all the hosts used in our experiments were Linux machines which implement TCP New Reno rather than Reno. Because of this and the fact that Linux caches TCP RTT and ssthresh values, it is likely that a Linux TCP stack suffers few retransmission timeouts than that predicted by our model. These implementation details can lead to higher actual TCP throughput values (i.e., higher than the throughput predicted by our model). In our analysis however, we have observed that the Guerin model over-estimates throughput. Hence we conjecture that the impact of these implementation issues might not be significant. However, we need to explore this further.
Our validation of the Web Response Time prediction model was limited to a single bottleneck router. We plan to further test the model and the UDP correlated loss-monitoring tool over Internet paths where multiple bottleneck links could exist. The issue is to see if the monitoring tool captures the burstiness in packet loss that occurs at multiple routers in the path. We conjecture that a more complex model is required that could adapt to congestion epochs that last several milliseconds to hundreds of milliseconds. Finally, our Web Response Time prediction model assesses only the impact of the network on the performance of a web application. We plan to incorporate the impact of server delays on application performance into the model
.
References
1. B. Sikdar, S. Kalyanaraman and K. S. Vastola, “An
Integrated Model for the Latency and Steady-State
Throughput of TCP Connections”, Performance
Evaluation, vol. 46, no. 2-3, pp. 139-154, September 2001.
2. J. Padhye, V. Firoiu, D. Towsley and J. Kurose, “Modeling
TCP throughput: A simple model and its empirical validation”, in SIGCOMM ’98, September 1998.
3. M. Goyal, R. Guerin, and R. Rajan, “Predicting TCP
throughput from non-invasive data”, University of
Pennsylvania, Tech Report, 2001. Available at:
http://www.ee.upenn.edu/~guerin/publications/TCP_model. pdf.
4. M. Goyal, R. Guerin and R. Rajan, “Predicting TCP
throughput from non-invasive network sampling”, IEEE Infocom 2002.
5. M. Mathis, J. Semke and J. Mahdavi, “The Macroscopic
Behavior of TCP Congestion Avoidance Algorithm”, in Computer Communications Review, vol. 27, number 3, July 1997.
6. N.Cardwell, S.Savage and T.Anderson , “Modeling TCP
Latency,” in Proceedings of IEEE INFOCOM, Tel Aviv, Israel, March 2000.
7. L. Rizzo, “Dummynet: a simple approach to the evaluation
of network protocols,” ACM Computer Communication Review, vol. 27, no. 1 , January 1997.
8. P. Barford and M. Crovella, “Generating representative
Web workloads for network and server performance evaluation”, in Proceedings of Performance ’98 / ACM SIGMETRICS ’98, Madison, WI , pp. 151-160, July 1998.
9. L.Zhang, S.Schenker, D.Clark, “Some observations on the
dynamics of a congestion-control algorithm”, ACM SIGCOMM Computer Communication Review, Vol. 20 Issue 5, pp.30-39, October 1990.
10. S. Floyd and V. Jacobson,” Random Early Detection
gateways for congestion avoidance”, in IEEE/ACM Transactions on Networking, Vol. 1 Issue 4, pp.397-413 , August 1993.
11. Red traffic settings http://
www.icir.org/floyd/REDparameters.txt.
12. tcpdump, http://www.tcpdump.org
13. V. Paxson, “End-to-End Internet Packet Dynamics”, in
IEEE/ACM Transactions on Networking, Vol. 7, Issue 3, June 1999.
14. J.Bolot, “End -to-end Packet Delay and Loss Behavior in
the Internet”, ACM SIGCOMM93.
15. M. Yajnik, S. Moon, J. Kurose, D. Towsley, “Measurement
and Modeling of the Temporal Dependence in Packet Loss”, INFOCOM99, March 1999.
16. S.Ramesh, I.Rhee, “Issues in Model based flow control”,
Technical Report TR-99-15, Department of Computer Science, North Carolina State University, Raleigh.
17. H.Karlapudi, “Web Application Performance Prediction”,
Masters Thesis, Clemson University, June 2004.
0 20 40 60 80 100 120
0 1 2 3 4 5 6 7 8
ResponseTime(sec)
Amount of Data transferred(KB) Response time estimates at 82% linkutilization (RED,Set IV)
TCP Response Time WRT Prediction Model(invasive) WRT Prediction Model(non−invasive)