Optimizing Resource Provisioning in Shared Cloud
Systems
ABSTRACT
Cloud computing promises flexibility and high performance for users and cost efficiency for operators. To achieve this premise, cloud providers offer several provisioning strategies including long-term reserved resources and short-term on-demand resources. Determining the most appropriate pro-visioning strategy is a complex, multi-dimensional problem that depends on the load fluctuation, interference sensitivity and duration of incoming jobs and the performance unpre-dictability and cost of the provisioned resources.
We first compare the two main provisioning strategies (re-served and on-demand resources) on Google Compute En-gine (GCE) using three representative workload scenarios with mixes of batch and latency-critical applications and increasing levels of load variability. We show that either ap-proach is suboptimal from the performance or cost perspec-tive. We then explore hybrid provisioning strategies with both reserved and on-demand resources. We design policies that account for the resource preferences of incoming jobs to automatically determine which jobs should be mapped to reserved versus on-demand resources based on overall load, and resource unpredictability. We demonstrate that hybrid configurations improve both performance and cost-efficiency compared to fully reserved and fully on-demand systems. Specifically they improve performance by 2.1x compared to fully on-demand provisioning, and reduce cost by 46% com-pared to fully reserved systems. We also show that hybrid strategies are robust to variation in system and job param-eters, such as cost, and system load.
1.
INTRODUCTION
An increasing amount of computing is now hosted in pub-lic clouds, such as Amazon’s EC2 [1], Windows Azure [62] and Google Compute Engine [19], or in private clouds man-aged by frameworks such as VMware vCloud [60], Open-Stack [45], and Mesos [25]. Cloud platforms provide two major advantages for end-users and cloud operators: flexi-bilityandcost efficiency[7, 8, 24]. Users can quickly launch jobs without the overhead of setting up a new infrastructure every time. Cloud operators can achieve economies of scale by building large-scale datacenters (DCs) and by sharing their resources between multiple users and workloads.
Users can provision resources for their applications in two
basic manners; using reserved and on-demand resources.
Reserved resources consist of servers reserved for long
pe-riods of time (typically 1-3 years [1]) and offer consistent service, but come at a significant upfront cost for the pur-chase of the long-term resource contract. In the other
ex-treme are on-demand resources, which can be full servers
or smaller instances and are progressively obtained as they become necessary. In this case, the user pays only for re-sources used at each point in time, but the per hour cost is 2-3x higher compared to reserved resources. Moreover,
acquiring on-demand resources induces instantiation over-heads and depending on the type of instance, the variability in the quality of service obtained can be significant.
Since provisioning must determine the necessary resources, it is important to understand the extent of this unpredictabil-ity. Performance varies both across instances of the same type (spatial variability), and within a single instance over time (temporal variability) [6, 18, 27, 29, 33, 37, 46, 47, 49, 52, 61]. Figure 1 shows the variability in performance for a Hadoop job running a recommender system using Ma-hout [36] on various instance types on Amazon EC2 [1] and on Google Compute Engine (GCE) [19]. Analytics such as Hadoop and Spark [64] are throughput-bound applications, therefore performance here corresponds to the completion time of the job. The instances are ordered from smallest to largest, with respect to the number of virtual CPUs and
memory allocations they provide. We show 1 vCPUmicro,
1-8 vCPU standard (stX) and 16 vCPU memory-optimized
instances (mX) [1, 19]. Each graph is the violin plot of com-pletion time of the Hadoop job over 40 instances of the cor-responding type. The dot shows the mean performance for each instance type. It becomes clear that especially for in-stances with less than 8 vCPUs unpredictability is signifi-cant, while for the micro instances in EC2 several jobs fail to complete due to the internal EC2 scheduler terminating the VM. For the larger instances (m16), performance is more predictable, primarily due to the fact that these instances typically occupy a large fraction of the server, hence they have a much lower probability of suffering from interference from co-scheduled workloads, excluding potential network interference. Between the two cloud providers, EC2 achieves higher average performance than GCE, but exhibits worse tail performance (higher unpredictability).
Figure 2 shows a similar experiment for a latency-critical service (memcached) on the same instance types. Note that the number of memcached clients is scaled by the number of vCPUs of each instance type, to ensure that all instances operate at a similar system load. Unpredictability is even more pronounced now, as memcached needs to satisfy tail latency guarantees [14], as opposed to average performance. The results from above hold, with the smaller instances (less than 8 vCPUs) experiencing significant variability in their tail latency. Performance jitter decreases again for the 8-16 vCPU VMs, especially in the case of the memory-optimized instances (m16). Additionally GCE now achieves better av-erage and tail performance compared to EC2.
The goal of this work is to optimizeperformance over cost
for cloud systems, similarly to the way work on system
de-sign and resource management optimized performance per Watt for small- and large-scale systems [31, 32, 56, 57, 68]. We first explore the implications of the two main provision-ing approaches (reserved and on-demand resources), with respect to performance variability and cost efficiency. We perform this analysis on Google Compute Engine (GCE) [19]
micro st1 st2 st8 m16 micro st1 st2 st8 m16
0 50 100 150 200 250 300
Execution Time (min)
Hadoop
EC2 GCE
Figure 1: Performance unpredictability on Amazon EC2
and Google Compute Engine for a Hadoop job.
micro st1 st2 st8 m16 micro st1 st2 st8 m16
0 200 400 600 800 1000 1200 1400
99th %ile Latency (usec)
memcached
EC2 GCE
Figure 2: Performance unpredictability on Amazon EC2
and Google Compute Engine for memcached.
Configuration Cost Perf. unpredictability Spin-up Flexibility Typical usage
Reserved High upfront,low per hour no no no long-term
On-demand No upfront,high per hour yes yes yes short-term
Hybrid Medium upfront,medium per hour low some yes long-term
Table 1: Comparison of system configurations with respect to: cost, performance unpredictability, overhead and flexibility.
using three representative workload scenarios with mixes of batch and latency-critical applications, and increasing levels of load variability. We assume no a priori knowledge of the applications in each scenario, except for the minimum and maximum aggregate load for each scenario, which is needed for a comparison with an idealized statically-reserved pro-visioning strategy. Our study reveals that while reserved resources are superior with respect to performance (2.2x on average over on-demand), they require a long-term commit-ment, and are therefore beneficial for use cases over extended periods of time. Fully on-demand resources, on the other hand, are more cost-efficient for short-term use cases (2.5x on average), but are prone to performance unpredictability, especially when using smaller instances. They also incur in-stantiation overheads to spin-up new VMs. Our study also shows that to achieve reasonable performance predictability with either strategy, it is crucial to understand the resource preferences and sensitivity to interference of individual ap-plications [17, 38, 50]. Recent work has shown that a combi-nation of lightweight profiling and classification-based anal-ysis can provide accurate estimations of job preferences with respect to the different instance types, the sensitivity to in-terference in shared resources and the amount of resources needed to satisfy each job’s performance constraint [17].
Next, we consider hybrid provisioning strategies that use both reserved (long-term) and on-demand (short-term) re-sources. A hybrid provisioning strategy has the potential to offer the best of both worlds by allowing users to leverage re-served resources for the steady-state long-term load, and on-demand resources for short-term resource needs. The main challenge with hybrid provisioning strategies is determining how to schedule jobs between the two types of resources. We show that leveraging the knowledge on resource prefer-ences and accounting for the characteristics of on-demand resources, and the system load enables correct mapping of jobs to reserved and on-demand resources. Table 1 shows the differences between the three main provisioning strate-gies with respect tocost, performance unpredictability, in-stantiation overheads andprovisioning flexibility.
We demonstrate that hybrid provisioning strategies achieve both high resource efficiency and QoS-awareness. They max-imize the usage of the already-provisioned reserved resources,
while ensuring that applications that can tolerate some per-formance unpredictability will not delay the scheduling of interference-sensitive workloads. We also compare the per-formance, cost and provisioning needs of hybrid systems against the fully reserved and fully on-demand strategies examined before over a wide spectrum of workload scenar-ios. Hybrid provisioning strategies achieve within 8% of the performance of fully reserved systems (and 2.1x better than on-demand systems), while improving their cost efficiency by 46%. Reserved resources are utilized at 80% on average during steady-state. Finally, we perform a detailed sensitiv-ity analysis of performance and cost with job parameters, such as duration, and system parameters such as resource pricing, spin-up overhead, and external load.
2.
CLOUD WORKLOADS AND SYSTEMS
2.1
Workload Scenarios
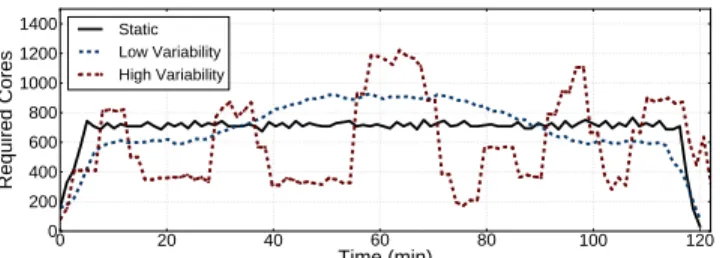
We examine the three workload scenarios shown in Fig-ure 3 and summarized in Table 2. Each scenario consists of a mix of batch applications (Hadoop workloads running over Mahout [36] and Spark jobs) and latency-critical work-loads (memcached). The batch jobs are machine learning and data mining applications, including recommender sys-tems, support vector machines, matrix factorization, and linear regression. memcached is driven with loads that dif-fer with respect to the read:write request ratio, the size of requests, the inter-arrival time distribution, the client fanout and the size of the dataset.
The first scenario has minimal load variability (Static). In steady-state the aggregate resource requirements are 854 cores on average. Approximately 55% of cores are required for batch jobs and the remaining 45% for the latency-critical services. The difference between maximum and minimum load is 10% and most jobs last several minutes to a few tens of minutes.
Second, we examine a scenario with mild, long-term load
variability (Low Variability). The steady-state minimum
load requires on average 605 cores, while in the middle of the scenario the load increases to 900 cores. The surge is mostly caused by an increase in the load of the latency-critical
ap-0 20 40 60 80 100 120
Time (min)
0 200 400 600 800 1000 1200 1400
Required Cores
Static Low Variability High Variability
Figure 3: The three workload scenarios.
plications. On average 55% of cores are needed for batch jobs and the remaining 45% for the latency-critical services. Finally, we examine a scenario with large, short-term load changes (High Variability). The minimum load drops at 210 cores, while the maximum load reaches up to 1226 cores for short time periods. Approximately 60% of cores are needed for batch jobs and 40% for the latency-critical services. Be-cause of the increased load variability, each job is shorter (8.1 min duration on average).
The ideal duration for each scenario, with no scheduling delays or degradation due to interference between workloads, is approximately 2 hours.
2.2
Cloud Instances
We use servers on Google Compute Engine (GCE) for all experiments. For provisioning strategies that require smaller instances we start with the largest instances (16 vCPUs) and partition them using Linux containers [5,13]. The reason for constructing smaller instances as server slices as opposed to directly requesting various instance types is to introduce controlled external interference which corresponds to typical load patterns seen in cloud environments, rather than the random interference patterns present at the specific time we
ran each experiment. This ensures repeatable experiments
andconsistent comparisonsbetween provisioning strategies.
We model external interference by imposing external load that fluctuates±10% around a 25% average utilization [8, 17]. The external load is generated using both batch and latency-critical workloads. Section 5.1 includes a sensitivity study to the intensity of external load.
We only partition servers at the granularity of existing GCE instances, e.g., 1,2,4,8 and 16 vCPUs. Whenever we refer to the cost of an on-demand instance, we quote the cost of the instance that would be used in the real environment, e.g., a 2 vCPU instance. Similarly, we account for the spin-up overhead of the instance of the desired size, wherever applicable. Finally, all scheduling actions such as autoscale and migration performed by GCE are disabled.
2.3
Cloud Pricing
Google Compute Engine currently only offers on-demand
instances. To encourage high instance usage, it provides
sustained usage monthly discounts [19]. Although sustained usage discounts reduce the prices of on-demand instances, they do not approximate the price of long-term reserved re-sources. The most popular alternative pricing model is the one used by AWS, which includes both long-term resource reservations and short-term on-demand instances. Because this pricing model offers more provisioning flexibility and captures the largest fraction of the cloud market today, we use it to evaluate the different provisioning strategies and adapt it to the resource prices of GCE. Specifically, we
ap-Workload Scenarios Static Low Var High Var max:min resources ratio 1.1x 1.5x 6.2x batch:low-latency – in jobs 4.2x 3.6x 4.1x
– in cores 1.4x 1.4x 1.5x
inter-arrival times (sec) 1.0 1.0 1.0
ideal completion time (hr) 2.1 2.0 2.0
Table 2: Workload scenario characteristics.
proximate the cost of reserved resources on GCE based on the reserved to on-demand price ratio for EC2, adjusted to the instance prices of GCE. In Section 5.3 we discuss how our results translate to different pricing models, such as the default GCE model and the pricing model used by Windows Azure.
3.
PROVISIONING STRATEGIES
The two main types of resource offerings in cloud
sys-tems are reserved and on-demand resources. Reserved
in-stances require a high upfront capital investment, but have 2-3x lower per-hour cost than on-demand resources, offer better service availability (1-year minimum), and provide consistent performance. On-demand resources are charged in a pay-as-you-go manner, but incur spin-up overheads and experience performance unpredictability due to interference from external load. We ignore spot instances for the pur-pose of this work, since they do not provide any availability guarantees.
The provisioning strategy must acquire the right type and number of resources for a workload scenario. Ideally, a pro-visioning strategy achieves three goals: (1) high workload
performance, (2) high resource utilization (minimal
over-provisioning), and (3)minimal provisioning and scheduling
overheads. We initially study the three obvious
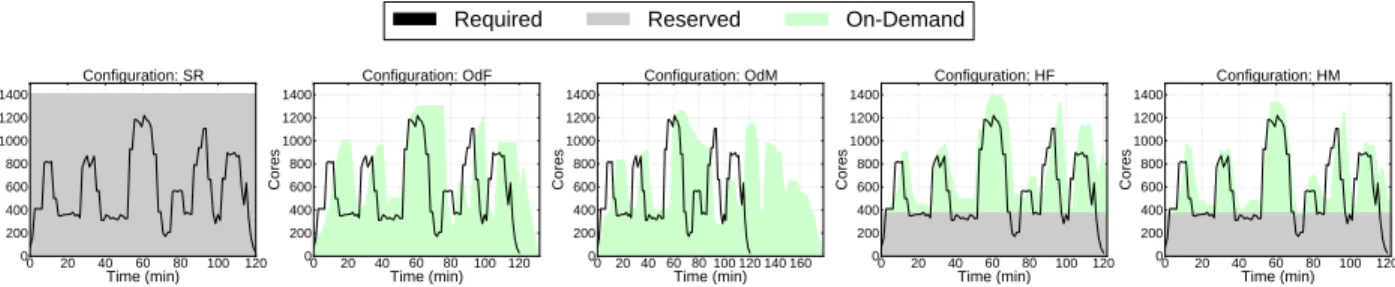
provision-ing strategies described in Table 3: a statically-provisioned strategy using only reserved resources (SR); an on-demand strategy (OdF) that only uses full servers (16 vCPU stances); and an on-demand strategy (OdM) that uses in-stances of any size and type.
3.1
Statically Reserved Resources (SR)
This strategy statically provisions reserved resources for a 1 year period, the shortest contract for reserved resources on cloud systems such as EC2. Reserved resources require significant capital investment upfront, although theper-hour charge is 2-3x lower than for the corresponding on-demand instances. Moreover, reserved resources are readily available as jobs arrive, eliminating the overhead of spinning up new VMs on-demand. Because SR only reserves large instances (16 vCPU), there is limited interference from external load, except potentially for some network interference.
Because of its static nature, SR must provision resources for the peak requirements of each workload scenario, plus
a small amount of overprovisioning. Overprovisioning is
needed because all scenarios contain latency-critical jobs, that experience tail latency spikes when using nearly satu-rated resources [7, 8, 14, 30]. We explain the insight behind the amount of overprovisioning in Section 3.3. Peak require-ments can be easily estimated for mostly static workload scenarios. For scenarios with load variability, static pro-visioning results in acquiring a large number of resources which remain underutilized for significant periods of time.
SR OdF OdM HF HM Reserved
Yes No No Yes Yes
resources On-demand
No Yes (full Yes Yes (full Yes
resources servers) servers)
Table 3: Resource provisioning strategies.
3.2
Dynamic On-Demand Resources (OdF, OdM)
We now examine two provisioning strategies that acquire resources as they become necessary to accommodate the in-coming jobs of each workload scenario. In this case there is no need for a large expenditure upfront, but the price of each instance per hour is 2-3x higher compared to the corresponding reserved resources. Moreover, each new in-stance now incurs the overhead needed to spin up the new VMs. This is typically 12-19 seconds for GCE, although the 95th percentile of the spin-up overhead is up to 2 minutes. Smaller instances tend to incur higher spin-up overheads.
Because of spin-up overheads, these two strategies must also decide how long they should retain the resources for af-ter a job completes. If, for example, a workload scenario has no or little load variability, instances should be retained to amortize the spin-up overhead. On the other hand, retaining instances when load variability is high can result in under-utilized resources. We determine retention time by drawing from related work on processor power management. The challenge in that case is to determine when to switch to low power modes that enable power savings but incur overheads to revert to an active mode [35, 40, 55]. Given that the job inter-arrival time in our scenarios is 1 second, we set the retention time to 10x the spin-up overhead of an instance.1 Section 5.1 shows a sensitivity analysis to retention time. Only instances that perform in a satisfactory manner are retained past the completion of their jobs.
We examine two variants of on-demand provisioning strate-gies. On-demand Full (OdF) only uses large instances (16 vCPUs), which are much less prone to external interference
(see Section 1). On-demand Mixed (OdM) acquires
on-demand resources of any instance type, including smaller instances with 1-8 vCPUs. While OdM offers more flexibil-ity, it introduces the issue that performance unpredictability due to external interference now becomes substantial. There are ways to improve performance predictability in fully on-demand provisioning strategies, e.g., by sampling multiple instances for each required instance and only keeping the better-behaved instances [18]. Although this approach ad-dresses the performance variability across instances, it is still prone to temporal variation within a single instance. Addi-tionally, it is only beneficial for long-running jobs that can afford the overhead of sampling multiple instances. Short jobs, such as real-time analytics (100msec-10sec) cannot tol-erate long scheduling delays and must rely on the initial resource assignment.
3.3
The Importance of Resource Preferences
So far, we have assumed that the provisioning strategy has limited knowledge about the resource preferences of individ-ual jobs within a workload scenario. Traditionally, the end-users have to specify how many resources each job should
1
The benefit of longer retention time varies across instance sizes due to differences in spin-up overheads.
use; unfortunately this is known to be error-prone and to fre-quently lead to significant resource overprovisioning [8, 11, 17, 34, 50]. Moreover, this offers no insight on the sensitivity of each job to interference from other jobs, external or not, running on the same physical server. This is suboptimal for both the statically-reserved and on-demand strategies, which will acquire more/less resources than what is truly needed by an application. The lack of interference under-standing is equally problematic. SR will likely colocate jobs that interfere negatively with each other on the same
in-stance. OdF and OdM will likely acquire instance types
that are prone to higher interference than what certain jobs can tolerate.
The recently-proposed Quasar system provides a method-ology to quickly determine the resource preferences of new
jobs [17]. When a job is submitted to the system, it is
first profiled on two instance types, while injecting inter-ference in two shared resources, e.g., last level cache and network bandwidth. This profiling signal is used by a set of classification techniques which find similarities between the new and previously-scheduled jobs with respect to in-stance type preferences and sensitivity to interference. A job’s sensitivity to interference in resource iis denoted by
ci, wherei∈[1, N], andN = 10 the number of examined
re-sources [17]. Large values ofcimean that the job puts a lot
of pressure in resource i. To capture the fact that certain jobs are more sensitive to specific resources we rearrange vectorC= [c1, c2, ..., cN] by order of decreasing magnitude
ofci,C0= [cj, ck, ..., cn]. Finally, to obtain a single value for C0, we use an order preserving encoding scheme as follows:
Q=cj·10(2·(N−1))+ck·10(2·(N−2))+...+cn, and
normal-ize Qin [0,1]. Q denotes the resource quality a job needs to satisfy its QoS constraints. HighQ denotes a
resource-demanding job, while low Qa job that can tolerate some
interference in shared resources.
We use Quasar’s estimations of resource preferences and interference sensitivity to improve resource provisioning. For SR, we use these estimations to find the most suitable sources available in the reserved instances with respect to re-source size and interference using a simple greedy search [17]. Accounting for the information on resource preferences re-duces overprovisioning to 10-15%. For OdF, the estimations are used to select the minimum amount of resources for a job, and to match the resource capabilities of instances to the interference requirements of a job. For OdM, this addi-tionally involves requesting an appropriate instance size and type (standard, compute- or memory-optimized). Note that because smaller instances are prone to external interference, provisioning decisions may have lower accuracy in this case. Finally, we must detect suboptimal application perfor-mance and revisit the allocation decisions at runtime [3,4,12, 17, 51]. Once an application is scheduled its performance is monitored and compared against its expected QoS. If perfor-mance drops below QoS we take action [17]. At a high level, we first try to restore performance through local actions, e.g., increasing the resource allocation, and then through rescheduling. Rescheduling is very unlikely in practice.
3.4
Provisioning Strategies Comparison
Performance: We first compare the performance
im-pact of the three provisioning strategies, with and without Quasar’s information on individual job preferences. Figure 4 shows the performance achieved by each of the three
pro-with profiling info without profiling info
SR OdF OdM
0 20 40 60 80 100 120 140
Execution Time (min)
Static Scenario
SR OdF OdM
0 50 100 150 200
Execution Time (min)
Low Variability Scenario
SR OdF OdM
0 50 100 150 200 250 300 350
Execution Time (min)
High Variability Scenario
(a) Performance of batch applications for the three scenarios.
SR OdF OdM
0 500 1000 1500 2000 2500
Request Latency (usec)
Static Scenario
SR OdF OdM
0 500 1000 1500 2000 2500
Request Latency (usec)
Low Variability Scenario 59627501
SR OdF OdM
0 1000 2000 3000 4000 5000 6000
Request Latency (usec)
High Variability Scenario 15564 15980 19611 20213
(b) Performance of latency-critical applications for the three scenarios.
Figure 4: Performance of jobs of the three workload scenarios with the three provisioning strategies. The boundaries of
the boxplots depict the 25th and 75th percentiles, the whiskers the 5th and 95th percentiles and the horizontal line in each boxplot shows the mean.
SR OdF OdM 0.0
0.5 1.0 1.5 2.0 2.5 3.0 3.5
Cost
Static Scenario
SR OdF OdM 0.0
0.5 1.0 1.5 2.0 2.5 3.0 3.5
Cost
Low Variability Scenario
SR OdF OdM 0.0
0.5 1.0 1.5 2.0 2.5 3.0 3.5
Cost
High Variability Scenario
Figure 5: Cost of fully reserved and on-demand systems.
visioning strategies for the three workload scenarios. We separate batch (Hadoop, Spark) from latency-critical appli-cations (memcached), since their critical performance met-ric is different: completion time for the batch jobs and
request latency distribution for memcached. The
bound-aries in each boxplot depict the 25th and 75th percentiles of performance, the whiskers the 5th and 95th percentile and the horizontal line shows the mean. When the informa-tion from Quasar is not used, the resources for each job are sized based on user-defined resource reservations. For batch jobs (Hadoop and Spark) this translates to using the default framework parameters (e.g., 64KB block size, 1GB heapsize for Hadoop), while for memcached resources are provisioned for peak load [50]. OdM requests the smallest instance size that satisfies the resource demands of a job. SR allocates resources for workloads on the reserved instances with the most available resources (least-loaded).
It is clear from Figure 4 that all three provisioning strate-gies benefit significantly from understanding the jobs’ re-source preferences and interference sensitivity. Specifically for SR, there is a 2.4x difference in performance on
aver-age across scenarios. The differences are even more
pro-nounced in the case of latency-critical applications, where the performance metric of interest is tail, instead of
aver-age performance. Omitting the information on interference sensitivity in this case significantly hurts request latency. In all following results, we assume that provisioning takes job preferences into account, unless otherwise stated.
We now compare the performance achieved by the three provisioning strategies. The static strategy SR achieves the best performance for all three scenarios, both for batch and latency-critical workloads. OdF behaves near-optimally for the static scenario, but worsens for the scenarios where vari-ability is present. The main reason is the spin-up overhead required to obtain new resources as they become necessary. Strategy OdM achieves the worst performance of all three provisioning strategies for every scenario (2.2x worse than SR on average), in part because of the spin-up overhead, but primarily because of the performance unpredictability it experiences from external load in the smaller instances. Memcached suffers a 24x and 42x increase in tail latency in the low- and high-variability scenarios, as it is more sensitive to resource interference.
Cost: Figure 5 shows the relative cost of each strategy for
the three scenarios. All costs are normalized to the cost of the static scenario with SR. Although strategy SR appears to have the lowest cost for a 2 hour run (2-3x lower per hour charge than on-demand), it requires at least a 1-year com-mitment with all charges happening in advance. Therefore, unless a user plans to leverage the cluster for long periods of time, on-demand resources are dramatically more cost-efficient. Moreover, SR is not particularly cost effective in the presence of high workload variability, since it results in significant overprovisioning. Between the two on-demand strategies, OdM incurs lower cost, since it uses smaller in-stances, while OdF only uses the largest instances available. Note however that the cost savings of OdM translate to a significant performance degradation due to resource unpre-dictability (Figure 4).
P1: Random P2: Q > 80% to reserved P3: Q > 50% to reserved P4: Q > 20% to reserved P5: Reserved load < 50% P6: Reserved load < 70% P7: Reserved load < 90% P8: Dynamic Policy
P1 P2 P3 P4 P5 P6 P7 P8
75 80 85 90 95 100
Perf. norm to Isolation (%)
Reserved Resources
HF HM
P1 P2 P3 P4 P5 P6 P7 P8
55 60 65 70 75 80 85 90 95 100
Perf. norm to Isolation (%)
On-Demand Resources
HF HM
Figure 6: Sensitivity to the policy of mapping jobs to reserved versus on-demand resources for HF and HM.
P1: Random P2: Q > 80% to reserved P3: Q > 50% to reserved P4: Q > 20% to reserved P5: Reserved load < 50% P6: Reserved load < 70% P7: Reserved load < 90% P8: Dynamic Policy
P1 P2 P3 P4 P5 P6 P7 P8 0
20 40 60 80 100
Utilization (%)
Reserved Resources
P1 P2 P3 P4 P5 P6 P7 P8 0
1 2 3 4 5
Cost
Figure 7: Utilization of reserved resources and cost with
different application mapping policies for HF and HM.
4.
HYBRID PROVISIONING STRATEGIES
The previous section showed that neither fully reserved nor fully on-demand strategies are ideal. Hybrid provision-ing strategies that combine reserved and on-demand resourc-es have the potential to achieve the bresourc-est of both worlds. This section presents two hybrid provisioning strategies that in-telligently assign jobs between reserved and on-demand re-sources and compares their performance and cost against the strategies of Section 3. Again, we make use of the infor-mation on resource preferences and interference sensitivity of individual jobs, as estimated by Quasar.
4.1
Provisioning Strategies
We design two hybrid strategies that use both reserved and on-demand resources. The first strategy (HF) only uses large instances for the on-demand resources, to reduce per-formance unpredictability. The second strategy (HM), uses a mix of on-demand instance types to reduce cost, including smaller instances that experience interference from exter-nal load. The retention time policy of on-demand resources is the same as for the purely on-demand strategies OdF and OdM. The reserved resources in both cases are large instances, as with the statically-provisioned strategy (SR). We configure the number of reserved instances to accommo-date the minimum steady-state load, e.g., 600 cores for the low variability scenario to avoid overprovisioning of reserved resources. For scenarios with low steady-state load but high load variability the majority of resources will be on-demand. Since HF uses large instances with limited performance unpredictability for both reserved and on-demand resources, it mostly uses on-demand instances to serve overflow load. In contrast, with HM on-demand instances may be smaller
and can experience resource interference from external load. Therefore, for hybrid strategies it is critical to determine which jobs should be mapped to reserved versus on-demand resources, based on their interference sensitivity and the availability of reserved resources.
4.2
Application Mapping Policies
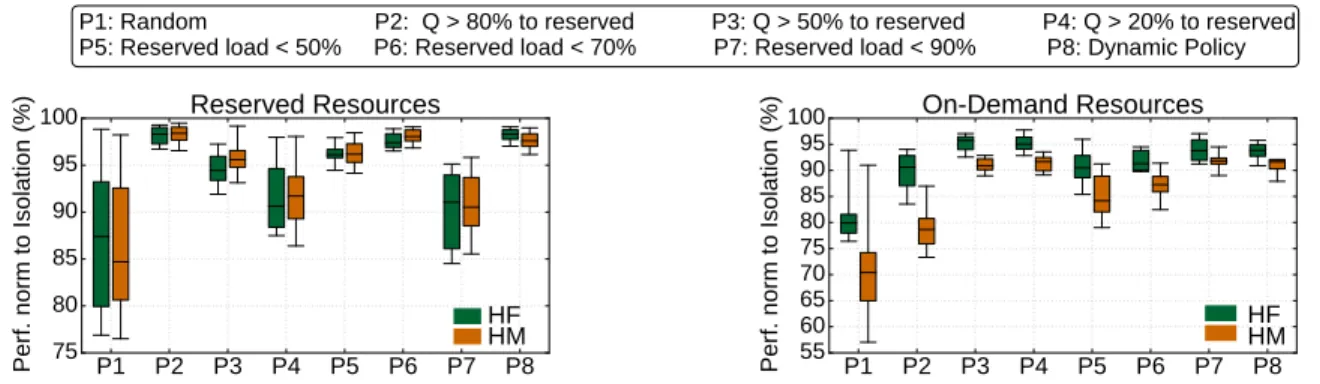
We first consider a baseline policy that maps applications between the reserved and on-demand resources randomly using a fair coin. Figure 6 shows the performance of ap-plications mapped to the reserved (left) and on-demand re-sources (right) for the two hybrid provisioning strategies in
the case of the high variability scenario. Performance is
normalized to the performance each job achieves if it runs with unlimited resources alone in the system (in isolation). Figure 7 also shows the utilization of the reserved instances and the total cost to run the 2 hour scenario normalized to the cost of the static scenario with SR. Because of the large number of scheduled applications, approximately half of them will be scheduled on reserved and half on on-demand resources [22]. The random policy hurts performance for jobs mapped to either type of resources. In the reserved re-sources, performance degrades as more workloads than the instances can accommodate are assigned to them, and are therefore queued. In the on-demand resources, performance degrades for two reasons. First, because of the inherent un-predictability of resources, especially in the case of HM, and, more prominently, because jobs that are sensitive to inter-ference and should have been mapped to reserved resources slow down due to external load.
Ideally, the mapping policy should take into account the sensitivity of jobs to performance unpredictability. The fol-lowing three policies shown in Figure 6 set a limit to the jobs that should be mapped to reserved resources based on the quality of resources they need. P2 assigns jobs that need qualityQ >80% to the reserved instances to protect them from the variability of on-demand resources. P3 andP4 set stricter limits, with P4 only assigning very tolerant to un-predictability jobs to the on-demand resources. As we move fromP2 toP4 the performance of jobs in the on-demand in-stances improves, as the number of applications mapped to them decreases. In contrast, the performance of jobs sched-uled to reserved resources worsens due to increased demand and queueing for resources. In general, performance is worse for HM in the on-demand resources, due to the increased performance variability of smaller instances.
~65% ~80%
System Load (reserved)
0%
Sensitive & insensitive jobs
reserved
No load Soft limit Hard limit Saturation
Sensitive jobs reserved Insensitive jobs on-demand
Sensitivequeuedorlargeron-demand Insensitivejobson-demand
90th %ile Q90
CDF
Resource Quality
QT
QT
Target resource
quality
QT<Q90 On-demand
St. 4
90th %ile
Q90
CDF
QT QT>Q90 Reserved
Mem. 2
Resource Quality
Figure 8: Application mapping scheme between reserved and on-demand instances for HF and HM.
..
Queue Length
.
Time
.
0
.
20
.
40
.
60
.
80
.
100
.
30
.
36
.
42
.
48
.
54
.
60
.
66
.
72
.
78
.
Sof
t
Limit
(%)
0.0 0.5 1.0 1.5 2.0 2.5 3.0 3.5 Time (sec) 0.0
0.2 0.4 0.6 0.8 1.0
Pr
[
∃
in
sta
nc
e X
]
A B C
Figure 9: Determining the soft utilization limit (left) and the expected waiting time (right) in HF and HM.
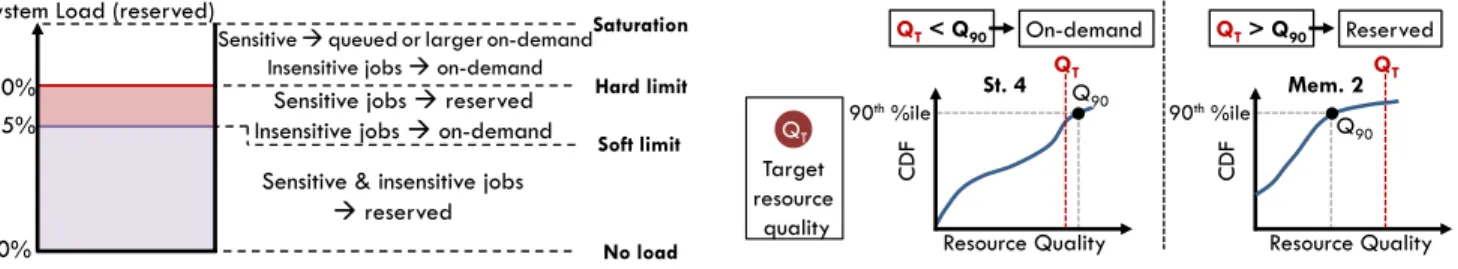
the reserved resources. The next three policiesP5−P7 set progressively higher, static limits. For low utilization limits, e.g., 50-70% the performance of jobs on reserved resources is near-optimal. In contrast, jobs assigned to on-demand resources suffer substantial performance degradations, since application mapping is only determined based on load and not based on resource preferences. For a utilization limit of 90%, the performance of jobs in the reserved resources de-grades due to excessive load. Low utilization in the reserved resources also significantly increases the cost, as additional on-demand resources have to be obtained. Therefore a pol-icy using a static utilization limit that does not distinguish between the resource preferences of jobs is also suboptimal. Based on these findings we design a dynamic policy to sep-arate jobs between reserved and on-demand resources. The policy adheres to three principles. First, it utilizes reserved resources before resorting to on-demand resources. Second, applications that can be accommodated by on-demand re-sources should not delay the scheduling of jobs sensitive to resource quality. Third, the system must adjust the utiliza-tion limits of reserved instances to respond to performance degradations due to excessive queueing.
Figure 8 explains the dynamic policy. We set two uti-lization limits for the reserved resources. First, asoft limit (experimentally set at 60-65% utilization), below which all incoming jobs are allocated reserved resources. Once utiliza-tion exceeds this limit, the policy differentiates between ap-plications that are sensitive to performance unpredictability and insensitive ones. The differentiation is done based on the resource qualityQa job needs to satisfy its QoS constraints and the knowledge on the quality of previously-obtained on-demand instances. Once we determine the instance size a job needs (number of cores, memory and storage), we compare the 90th percentile of quality of that instance type (mon-itored over time) against the target quality (QT) the job
needs. IfQ90> QT the job is scheduled on the on-demand
instance, otherwise it is scheduled on the reserved instances. Examining the 90thpercentile is sufficient to ensure accurate
decisions for the majority of jobs.
Second, we set ahard limitfor utilization, when jobs need to get queued before reserved resources become available. At this point, any jobs for which on-demand resources are satisfactory are scheduled in the on-demand instances and all remaining jobs are locally queued [48]. An exception oc-curs for jobs whose queueing time is expected to exceed the time it would take to spin up a large on-demand instance (16 vCPUs); these jobs are instead assigned to on-demand instances. Queueing time is estimated using a simple feed-back loop based on the rate at which instances of a given type are being released over time. For example, if out of 100 jobs waiting for an instance with 4 vCPUs and 15GB of RAM, 99 were scheduled in less than 1.4 seconds, the sys-tem will estimate that there is a 0.99 probability that the queueing time for a job waiting for a 4 vCPU instance will be 1.4 seconds. Figure 9b shows a validation of the estima-tion of waiting time for three instance types. The lines show the cumulative distribution function (CDF) of the probabil-ity that an instance of a given type becomes available. The dots show the estimated queueing time for jobs waiting to be scheduled on instances with 4 (A), 8 (B) and 16 vCPUs (C) in the high variability scenario. In all cases the deviation between estimated and measured queueing time is minimal. Third, we adjust the soft utilization limit based on the
rate at which applications get queued. If the number of
queued jobs increases sharply, the reserved instances should become more selective in the workloads they accept, i.e., the soft limit should decrease. Similarly, if no jobs get queued for significant periods of time, the soft limit should increase to accept more incoming jobs. We use a simple feedback loop with linear transfer functions to adjust the soft utiliza-tion limit of the reserved instances as a workload scenario progresses. Figure 9a shows how the soft limit changes with execution time and queue length.
4.3
Provisioning Strategies Comparison
Performance: Figure 10 compares the performance
achie-ved by the static strategy SR and the two hybrid strategies (HF and HM), with and without the profiling information for new jobs. Again we separate batch from latency-critical jobs. As expected, having the profiling information improves performance significantly for the hybrid strategies, for the additional reason that it is needed to decide which jobs should be scheduled on the reserved resources (2.4x improve-ment on average for HF and 2.77x for HM). When using the profiling information, strategies HF and HM come within 8% of the performance of the statically reserved system (SR), and in most cases outperform strategies OdF and OdM, es-pecially for the scenarios with significant load variability. The main reason why HF and HM achieve good performance
with profiling info without profiling info
SR HF HM
0 20 40 60 80 100 120
Execution Time (min)
Static Scenario
SR HF HM
0 20 40 60 80 100 120 140
Execution Time (min)
Low Variability Scenario
SR HF HM
0 50 100 150 200
Execution Time (min)
High Variability Scenario
(a) Performance of batch applications for the three scenarios.
SR HF HM
0 500 1000 1500 2000 2500
Request Latency (usec)
Static Scenario
SR HF HM
0 500 1000 1500 2000 2500
Request Latency (usec)
Low Variability Scenario
SR HF HM
0 1000 2000 3000 4000 5000 6000
Request Latency (usec)
High Variability Scenario
(b) Performance of latency-critical applications for the three scenarios.
Figure 10: Performance of the three scenarios with the statically-reserved and hybrid provisioning strategies. The boundaries of the boxplots depict the 25th and 75th percentiles, the whiskers the 5th and 95th percentiles and the horizontal line in each boxplot shows the mean.
Reserved Cost On Demand Cost
SR HF HM 0.0
0.2 0.4 0.6 0.8 1.0 1.2 1.4 1.6 1.8
Cost
Static Scenario
SR HF HM 0.0
0.2 0.4 0.6 0.8 1.0 1.2 1.4 1.6 1.8
Cost
Low Variability Scenario
SR HF HM 0.0
0.2 0.4 0.6 0.8 1.0 1.2 1.4 1.6 1.8
Cost
High Variability Scenario
Figure 11: Cost comparison between SR, HF and HM.
is that they differentiate between applications that can tol-erate the unpredictability of on-demand instances, and jobs that need the predictable performance of a fully controlled environment. Additionally hybrid strategies hide some of the spin-up overhead of on-demand resources by accommo-dating part of the load in the reserved instances.
Cost: Figure 11 shows the relative cost of strategies SR,
HF and HM for the three scenarios. While the static pro-visioning strategy (SR) is more cost-efficient in the static scenario where provisioning is straight-forward, the hybrid strategies incur significantly lower costs for both scenarios with load variability. Therefore, unless load is almost com-pletely static, statically-provisioned resources is not cost-efficient both due to long-term reservations, and significant
overprovisioning. Additionally, because of the lower
per-hour cost of reserved resources in HF and HM, the hybrid strategies have lower per-hour cost than fully on-demand re-sources as well. For HF and HM, most of the cost per hour comes from on-demand resources, since reserved instances are provisioned for the minimum steady-state load. Finally, between the two hybrid strategies, HM achieves higher cost-efficiency since it uses smaller instances.
5.
DISCUSSION
5.1
Sensitivity to Job/System Parameters
We first evaluate the sensitivity of the previous findings to various system and workload parameters. Unless otherwise specified, we use the same strategies as before to provision reserved and/or on-demand resources.
Resource cost: The current average cost ratio of
on-demand to reserved resource per hour is 2.74. Figure 12 shows how the relative cost of the three scenarios varies for each of the five strategies when this ratio changes. The cur-rent ratio is shown with a vertical line at 2.74. All costs are normalized to the cost for the static scenario using SR. We change the ratio by scaling the price of reserved resources. We vary the ratio in [0.01,4]; beyond that point the cost of SR per hour becomes practically negligible. Initially (0.01), strategies using only on-demand resources (OdF, OdM) are significantly more cost-efficient, especially for the scenarios
with load variability. For the static scenario, even when
on-demand resources are much cheaper than reserved, SR, HF and HM incur similar charges as the fully on-demand systems. For each scenario, there is a price ratio for which SR becomes the most cost-efficient strategy. As variability increases, this value becomes larger (e.g., for the high vari-ability scenario the ratio needs to become 3 for SR to be more cost-efficient per hour than HM). Note that SR still requires at least a 1-year commitment, in contrast to the on-demand strategies. Finally, the hybrid strategies achieve the lowest per-hour cost for significant ranges of the price ratio, especially for scenarios with load variability.
Scenario duration: Figure 13 shows how cost changes for
each strategy, as the scenario duration increases. Because we compare aggregate costs (instead of per-hour), this figure shows the absolute cost in dollars for each strategy. For the static scenario, from a cost perspective, strategy HM is
op-0.0 0.5 1.0 1.5 2.0 2.5 3.0 3.5 4.0 On-Demand:Reserved Price per hr 0.0 0.5 1.0 1.5 2.0 2.5 3.0 3.5 4.0 Cost Static Scenario SR OdF OdM HF HM
0.0 0.5 1.0 1.5 2.0 2.5 3.0 3.5 4.0 On-Demand:Reserved Price per hr 0.0 0.5 1.0 1.5 2.0 2.5 3.0 3.5 4.0 Cost
Low Variability Scenario
SR OdF OdM HF HM
0.0 0.5 1.0 1.5 2.0 2.5 3.0 3.5 4.0 On-Demand:Reserved Price per hr 0 1 2 3 4 5 6 Cost
High Variability Scenario SR OdF OdM
HF HM
Figure 12: Sensitivity to on-demand:reserved cost.
0 10 20 30 40 50 Duration (weeks) 0 100 200 300 400 500 600 Cost (x1000$) Static Scenario SR OdF OdM HF HM
0 10 20 30 40 50 Duration (weeks) 0 100 200 300 400 500 600 Cost (x1000$)
Low Variability Scenario SR
OdF OdM
HF HM
0 10 20 30 40 50 Duration (weeks) 0 100 200 300 400 500 Cost (x1000$)
High Variability Scenario SR
OdF OdM
HF HM
Figure 13: Sensitivity to scenario duration.
0 20 40 60 80 100 120 Spin up Overhead (sec) 0 20 40 60 80 100
95th %ile of Perf norm to SR (%)
High Variability Scenario
SR OdF
OdM HF
HM
0 20 40 60 80 100
External Load (%) 0 20 40 60 80 100
95th %ile Perf norm to Isolation (%)
High Variability Scenario
SR OdF
OdM HF
HM
Figure 14: Sensitivity to spin-up time and external load.
timal only if duration is [20−25] weeks. For durations less than 20 weeks, strategy OdM is the most cost-efficient, while for durations more than 25 weeks the statically-reserved sys-tem (SR) is optimal. This changes for scenarios with load variability. Especially in the case of high variability, for durations larger than 18 weeks, strategy HM is the most cost-efficient, with the significantly overprovisioned reserved system (SR) never being the most efficient. Note that the charge for SR doubles beyond the 1 year (52 weeks) mark.
Spin-up overhead: Figure 14a shows how the 95th
per-centile of performance changes as the overhead to spin-up new resources changes for the high variability scenario. The statically-reserved strategy (SR) is obviously not affected by this change. Because in this scenario resources are frequently recycled, increasing the spin-up overhead significantly affects performance. This is more pronounced for the strategies us-ing exclusively on-demand resources (OdF, OdM). The ad-ditional degradation for OdM comes from the performance unpredictability of smaller on-demand instances.
External load: Figure 14b shows the sensitivity of
perfor-mance to external load (load in machines due to jobs beyond those provisioned with our strategies). SR provisions a fully-controlled environment, therefore there is no external load to affect performance. OdF and HF are also tolerant to ex-ternal load, as they only use the largest instances, which are much less prone to external interference. For HM per-formance degrades minimally until 50% load, beyond which point the estimations on resource quality become inaccurate. OdM suffers most of the performance degradation as all of its resources are susceptible to external interference.
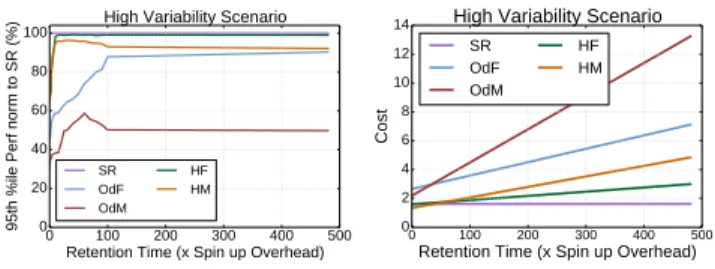
Retention time: Figure 15 shows the 95th percentile of
performance and the cost of each strategy, as the time for which idle instances are maintained changes for the high variability scenario. As expected, releasing well-behaved in-stances immediately hurts performance, as it increases the overheads from spinning-up new resources. This is especially the case for this scenario, where load changes frequently. With respect to cost, higher retention time increases the cost of strategies using only on-demand resources (OdF, OdM), while SR remains unchanged; the difference for
hy-0 100 200 300 400 500 Retention Time (x Spin up Overhead) 0 20 40 60 80 100
95th %ile Perf norm to SR (%)
High Variability Scenario
SR OdF OdM
HF HM
0 100 200 300 400 500
Retention Time (x Spin up Overhead) 0 2 4 6 8 10 12 14 Cost
High Variability Scenario
SR OdF OdM
HF HM
Figure 15: Sensitivity to resource retention time.
brid strategies is small. An unexpected finding is that exces-sive resource retention slightly hurts performance for OdM and HM. The primary reason is the temporal variability in the quality of on-demand resources, which degraded by the time new applications were assigned to these instances.
5.2
Provisioning Overheads
In the presented strategies, the provisioning overheads in-clude job profiling and classification (Quasar), provisioning decisions, spin-up of new on-demand instances (where ap-plicable), and rescheduling actions. The profiling that gen-erates the input signal for the classification engine takes 5-10 sec, but only needs to happen the first time a job
is submitted. Classification itself takes 50msec on
aver-age. Decision overheads include the greedy scheduler in
the statically-reserved strategy (SR) and the overhead of deciding whether to schedule a new job on reserved versus on-demand resources in the hybrid strategies. In all cases decision overheads do not exceed 20msec, three orders of magnitude lower than the spin-up overheads of on-demand instances (10-20sec on average). Finally, job rescheduling due to suboptimal performance is very infrequent for all strategies except OdM, where it induces 6.1% overheads to the execution time of jobs on average.
5.3
Different Pricing Models
So far we have assumed a pricing model for reserved and on-demand instances similar to the one used by Amazon’s AWS. This is a popular approach followed by many smaller cloud providers. Nevertheless, there are alternative approa-ches. GCE does not offer long-term reservations. Instead it providessustained usage monthly discounts to encourage high-utilization of on-demand resources. The higher the us-age of a set of instances of a type for a fraction of the month, the lower the per-hour instance price for the remainder of the month. This approach does not differentiate whether one uses a single instance of type A for 3 weeks or 3 in-stances of type A for 1 week each. Microsoft Azure only offers on-demand resources of different types.
Even without reserved resources, the problem of selecting the appropriate instance size and configuration, and
deter-SR OdF OdM HF HM
Reserved & On-demand On-demand & 0.0
0.5 1.0 1.5 2.0 2.5 3.0 3.5 4.0
Cost
Static Scenario
on-demand only usage discounts Reserved & On-demand On-demand &
0.0 0.5 1.0 1.5 2.0 2.5 3.0 3.5 4.0
Cost
Low Variability Scenario
on-demand only usage discounts Reserved & On-demand On-demand &
0 1 2 3 4 5
Cost
High Variability Scenario
on-demand only usage discounts
Figure 16: Sensitivity to the cloud pricing model for the three workload scenarios.
mining how long to keep an instance for before releasing it remains. Figure 16 shows how cost changes for the three workload scenarios, under the Azure (on-demand only) and GCE (on-demand + usage discounts) pricing models, com-pared to the AWS pricing model (reserved + on-demand). We assume that the resources will be used at least for a one month period, so that GCE discounts can take effect. Cost is normalized to the cost of the static workload sce-nario under the SR provisioning strategy using thereserved
& on-demand pricing model. Even with these alternative
pricing models using the hybrid strategies and accounting for the resource preferences of incoming applications to op-timize provisioning significantly benefits cost. For example, for the high variability scenario HM achieves 32% lower cost than OdF with the Windows Azure pricing model; similarly for the GCE model with discounts, HM achieves 30% lower cost than OdF.
GCE decouples the level of usage from the specific in-stance used. For example, monthly usage is considered the same between a single instance used for 50% of the month, andN instances of the same type used for (50/N)% of the month each. This introduces new opportunities to optimize resource provisioning by maximizing the time a certain in-stance type is used during a month. We defer such consid-erations to future work.
5.4
Additional Provisioning Considerations
Spot instances: Spot instances consist of unallocated
re-sources that cloud providers make available to users through a bidding interface. Spot instances do not have availability guarantees, and may be terminated at any point in time if the bidding price is lower than the market price for an instance type. Incorporating spot instances in provisioning strategies for non-critical tasks or jobs with very relaxed performance requirements can further improve the system’s cost-efficiency.
Reducing unpredictability: Resource partitioning (e.g.,
cache or network bandwidth partitioning) has the poten-tial to improve isolation between instances sharing one or more resources, thus reducing performance unpredictability in fully on-demand provisioning strategies. We plan to inves-tigate how resource partitioning complements provisioning decisions in future work.
Data management: In our current infrastructure both
reserved and on-demand resources are in the same cluster. When reserved resources are deployed as a private facility, the provisioning strategy must also consider how to minimize and manage data transfers and replication across the private and on-demand resources.
6.
RELATED WORK
Cluster management: The increase in the size and
number of large-scale DCs has motivated several designs for cluster management. Systems like Mesos [25], Torque [58] and Omega [53] all address the problem of allocating re-sources and scheduling applications in large, shared clus-ters. Mesos is a two-level scheduler. It has a central co-ordinator that makes resource offers to application frame-works, and each framework has an individual scheduler that handles its assigned resources. Omega on the other hand, follows a shared-state approach, where multiple concurrent schedulers can view the whole cluster state, with conflicts being resolved through a transactional mechanism [53]. De-javu identifies a few workload classes and reuses previous resource allocations for each class, to minimize reallocation overheads [59]. CloudScale [54], PRESS [21], AGILE [43] and the work by Gmach et al. [20] predict future resource needs online, often without a priori workload knowledge. Finally, scaling systems, such as Rightscale [51], auto-matically scale the number of physical or virtual instances used by webserving workloads, to accommodate changes in user load.
A second line of work tries to identify the specific re-sources that are appropriate for incoming tasks [16, 39, 41, 63]. Paragon uses classification techniques to determine the impact of platform heterogeneity and workload interference on an unknown, incoming workload [16]. It then uses this information to schedule each workload in a way that en-ables high performance for the job and high utilization for
the cluster. Paragon, assumes that the cluster manager
has full control over all resources, which is often not the case in public clouds. Nathuji et al. developed a feedback-based scheme that tunes resource assignments to mitigate interference effects [42]. Yang et al. developed an online scheme that detects memory pressure and finds colocations that avoid interference on latency-sensitive workloads [63]. Similarly, DeepDive detects and manages interference be-tween co-scheduled workloads in a VM environment [44]. Finally, CPI2 [67] throttles low-priority workloads that in-duce interference to important services. In terms of man-aging platform heterogeneity, Nathuji et al. [41] and Mars et al. [38] quantified its impact on conventional benchmarks and Google services, and designed schemes to predict the most appropriate server type for each workload.
Hybrid clouds: Hybrid clouds consist of both
privately-owned and publicly-rented machines and have gained in-creased attention over the past few years for several reasons, including cost-efficiency, as well as security and privacy con-cerns [2,10,26,28,66]. Breiter et al. [10] describe a framework that allows service integration in hybrid cloud environments,
including actions such as overflowing in on-demand resources during periods of high load. Farahabady et al. [26] present a resource allocation strategy for hybrid clouds that attempts to predict the execution times of incoming jobs and based on these predictions generate Pareto-optimal resource allo-cations. Finally, Annapureddy et al. [2] and Zhang et al. [66] discuss the security challenges of hybrid environments, and propose ways to leverage the private portion of the infras-tructure for privacy-critical computation. The provisioning strategies discussed here are also applicable to hybrid clouds.
Cloud economics: The resource pricing of cloud providers
has been extensively analyzed. Ben-Yehuda et al. [9] con-test whether the pricing strategy of spot instances on EC2 is indeed market-driven, and discuss alternative pricing strate-gies. Deelman et al. [15] discuss provisioning strategies for a single astronomy application on a cloud provider. Li et al. [33] compare the resource pricing of several cloud providers to assist users provision their applications. Finally, Guevara et al. [23] and Zahed et al. [65] incorporate the economics of heterogeneous resources in market-driven and game-theoretic strategies for resource allocation in shared environments.
7.
CONCLUSIONS
We have discussed the different provisioning strategies available on cloud providers today and showed their ad-vantages and pitfalls with respect to cost, performance pre-dictability and initialization overheads. We have also de-signed two new hybrid provisioning strategies, that use both reserved and on-demand resources, and leverage the infor-mation on resource preferences of incoming jobs and the quality of previously-obtained on-demand instances, to map jobs to reserved versus on-demand resources. We showed that hybrid provisioning strategies can provide the best of both worlds in terms of performance and cost-efficiency; they preserve QoS for the majority of jobs, improve perfor-mance by 2.1x compared to fully on-demand resources, and reduce cost by 46% compared to fully reserved resources.
8.
REFERENCES
[1] Amazon ec2.http://aws.amazon.com/ec2/.
[2] K. Annapureddy. Security challenges in hybrid cloud infrastructures. InAalto University, T-110.5290
Seminar on Network Security. 2010.
[3] Autoscale.https:
//cwiki.apache.org/cloudstack/autoscaling.html.
[4] Aws autoscaling.
http://aws.amazon.com/autoscaling/.
[5] G. Banga, P. Druschel, and J. Mogul. Resource containers: a new facility for resource management in server systems. InProc. of OSDI. New Orleans, 1999. [6] S. K. Barker and P. Shenoy. Empirical evaluation of
latency-sensitive application performance in the cloud.
InProc. of MMsys. Scottsdale, AR, 2010.
[7] L. Barroso. Warehouse-scale computing: Entering the
teenage decade.ISCA Keynote, SJ, June 2011.
[8] L. Barroso and U. Hoelzle.The Datacenter as a
Computer: An Introduction to the Design of
Warehouse-Scale Machines. MC Publishers, 2009.
[9] O. A. Ben-Yehuda, M. Ben-Yehuda, A. Schuster, and D. Tsafrir. Deconstructing amazon ec2 spot instance
pricing. InACM TEAC, 1(3), September 2013.
[10] G. Breiter and V. Naik. A framework for controlling and managing hybrid cloud service integration. In
Proc. of IC2E. Redwood City, CA, 2013.
[11] M. Carvalho, W. Cirne, F. Brasileiro, and J. Wilkes. Long-term slos for reclaimed cloud computing resources. InProc. of SOCC. Seattle, WA, 2014. [12] J. Chase, D. Anderson, P. Thakar, A. Vahdat, and
R. Doyle. Managing energy and server resources in hosting centers. InProc. of SOSP. Banff, CA, 2001.
[13] Linux containers.http://lxc.sourceforge.net/.
[14] J. Dean and L. A. Barroso. The tail at scale. In
CACM, Vol. 56 No. 2, Pages 74-80.
[15] E. Deelman, G. Singh, M. Livny, B. Berriman, and J. Good. The cost of doing science on the cloud: The
montage example. InProc. of SC. Austin, TX, 2008.
[16] C. Delimitrou and C. Kozyrakis. Paragon: QoS-Aware
Scheduling for Heterogeneous Datacenters. InProc. of
ASPLOS. Houston, TX, 2013.
[17] C. Delimitrou and C. Kozyrakis. Quasar: Resource-Efficient and QoS-Aware Cluster
Management. InProc. of ASPLOS. Salt Lake City,
UT, 2014.
[18] B. Farley, A. Juels, V. Varadarajan, T. Ristenpart, K. D. Bowers, and M. M. Swift. More for your money: Exploiting performance heterogeneity in public clouds.
InProc. of SOCC. San Jose, CA, 2012.
[19] Google compute engine.
https://developers.google.com/compute/.
[20] D. Gmach, J. Rolia, L. Cherkasova, and A. Kemper. Workload analysis and demand prediction of
enterprise data center applications. InProc. of IISWC. Boston, MA, 2007.
[21] Z. Gong, X. Gu, and J. Wilkes. Press: Predictive elastic resource scaling for cloud systems. InProc. of
CNSM. Niagara Falls, ON, 2010.
[22] G. R. Grimmett and D. R. Stirzaker. Probability and random processes. 2nd Edition. Clarendon Press, Oxford, 1992.
[23] M. Guevara, B. Lubin, and B. Lee. Navigating heterogeneous processors with market mechanisms. In
Proc. of HPCA. Shenzhen, China, 2013.
[24] J. Hamilton. Cost of power in large-scale data centers.
http://perspectives.mvdirona.com.
[25] B. Hindman, A. Konwinski, M. Zaharia, A. Ghodsi, A. Joseph, R. Katz, S. Shenker, and I. Stoica. Mesos: A platform for fine-grained resource sharing in the data center. InProc. of NSDI. Boston, MA, 2011. [26] M. Hoseinyfarahabady, H. Samani, L. Leslie, Y. C.
Lee, and A. Zomaya. Handling uncertainty: Pareto-efficient bot scheduling on hybrid clouds. In
Proc. of ICPP. Lyon, 2013.
[27] A. Iosup, N. Yigitbasi, and D. Epema. On the performance variability of production cloud services.
InProc. of CCGRID. Newport Beach, CA, 2011.
[28] V. Khadilkar, K. Y. Oktay, B. Hore, M. Kantarcioglu, S. Mehrotra, and B. Thuraisingham. Risk-aware data processing in hybrid clouds. TR-UTDCS-31-11, 2011. [29] Y. E. Khamra, H. Kim, S. Jha, and M. Parashar.
Exploring the performance fluctuations of hpc workloads on clouds. InProc. of CloudCom. Indianapolis, IN, 2010.
[30] L. Kleinrock. Queueing systems volume 1: Theory. pp. 101-103, 404.
[31] E. Lau, J. E. Miller, I. Choi, D. Yeung, S. Amarasinghe, and A. Agarwal. Multicore
performance optimization using partner cores. InProc.
of HotPar. Berkeley, CA, 2011.
[32] J. Laudon. Performance/watt: the new server focus.
InACM SIGARCH Computer Architecture News:
dasCMP. Vol. 33 Issue 4, p. 5-13, November 2005.
[33] A. Li, X. Yang, S. Kandula, and M. Zhang. Cloudcmp: Comparing public cloud providers. InProc. of IMC. Melbourne, Australia, 2010.
[34] Host server cpu utilization in amazon ec2 cloud. http://huanliu.wordpress.com/2012/02/17/
host-server-cpu-utilization-in-amazon-ec2-cloud/. [35] J. Lorch and A. Smith. Reducing processor power
consumption by improving processor time management in a single-user operating system. In
Proc. of MOBICOM. New York, NY, 1996.
[36] Mahout.http://mahout.apache.org/.
[37] D. Mangot. Ec2 variability: The numbers revealed. http://tech.mangot.com/roller/dave/entry/ec2_
variability_the_numbers_re%vealed.
[38] J. Mars and L. Tang. Whare-map: heterogeneity in
”homogeneous” warehouse-scale computers. InProc. of
ISCA. Tel-Aviv, Israel, 2013.
[39] J. Mars, L. Tang, R. Hundt, K. Skadron, and M. L. Soffa. Bubble-up: increasing utilization in modern warehouse scale computers via sensible co-locations. In
Proc. of MICRO. Porto Alegre, Brazil, 2011.
[40] S. M. Martin, K. Flautner, T. Mudge, and D. Blaauw. Combined dynamic voltage scaling and adaptive body biasing for lower power microprocessors under
dynamic workloads. InProc. of ICCAD. 2002.
[41] R. Nathuji, C. Isci, and E. Gorbatov. Exploiting platform heterogeneity for power efficient data centers.
InProc. of ICAC, FL, 2007.
[42] R. Nathuji, A. Kansal, and A. Ghaffarkhah. Q-clouds: Managing performance interference effects for
qos-aware clouds. InProc. of EuroSys France, 2010. [43] H. Nguyen, Z. Shen, X. Gu, S. Subbiah, and
J. Wilkes. Agile: Elastic distributed resource scaling for infrastructure-as-a-service. InICAC. 2013. [44] D. Novakovic, N. Vasic, S. Novakovic, D. Kostic, and
R. Bianchini. Deepdive: Transparently identifying and managing performance interference in virtualized
environments. InProc. of ATC. San Jose, CA, 2013.
[45] Openstack cloud software.
http://www.openstack.org/.
[46] S. Ostermann, A. Iosup, N. Yigitbasi, R. Prodan, T. Fahringer, and D. Epema. A performance analysis of ec2 cloud computing services for scientific
computing. InLecture Notes on Cloud Computing.
Volume 34, p.115-131, 2010.
[47] Z. Ou, H. Zhuang, J. K. Nurminen, A. Yl¨a-J¨a¨aski, and P. Hui. Exploiting hardware heterogeneity within the same instance type of amazon ec2. InHotCloud. 2012. [48] K. Ousterhout, P. Wendell, M. Zaharia, and I. Stoica. Sparrow: Distributed, low latency scheduling. InProc.
of SOSP. Farminton, PA, 2013.
[49] M. Rehman and M. Sakr. Initial findings for
provisioning variation in cloud computing. InProc. of
CloudCom. Indianapolis, IN, 2010.
[50] C. Reiss, A. Tumanov, G. Ganger, R. Katz, and M. Kozych. Heterogeneity and dynamicity of clouds at scale: Google trace analysis. InProc. of SOCC. 2012.
[51] Rightscale.https://aws.amazon.com/
solution-providers/isv/rightscale.
[52] J. Schad, J. Dittrich, and J.-A. Quian´e-Ruiz. Runtime measurements in the cloud: Observing, analyzing, and
reducing variance.Proc. VLDB Endow.,
3(1-2):460–471, Sept. 2010.
[53] M. Schwarzkopf, A. Konwinski, M. Abd-El-Malek, and J. Wilkes. Omega: flexible, scalable schedulers for large compute clusters. InProc. of EuroSys. 2013. [54] Z. Shen, S. Subbiah, X. Gu, and J. Wilkes. Cloudscale:
elastic resource scaling for multi-tenant cloud systems.
InProc. of SOCC. Cascais, Portugal, 2011.
[55] T. Simunic and S. Boyd. Managing power
consumption in networks on chips. InProc. of DAC.
Paris, France, 2002.
[56] S. Swanson, A. Putnam, M. Mercaldi, K. Michelson, A. Petersen, A. Schwerin, M. Oskin, and S. J. Eggers. Area-performance trade-offs in tiled dataflow
architectures. InProc. of ACM SIGARCH Computer
Architecture News, v.34 n.2, p.314-326, May 2006.
[57] K. Therdsteerasukdi, G. Byun, J. Cong, F. Chang, and G. Reinman. Utilizing rf-i and intelligent
scheduling for better throughput/watt in a mobile gpu
memory system. InTACO 8(4). 2012.
[58] Torque resource manager.
http://www.adaptivecomputing.com/products/
open-source/torque/.
[59] N. Vasi´c, D. Novakovi´c, S. Miuˇcin, D. Kosti´c, and R. Bianchini. Dejavu: accelerating resource allocation
in virtualized environments. InASPLOS. 2012.
[60] Vmware vcloud suite.
http://www.vmware.com/products/vcloud.
[61] G. Wang and T. S. E. Ng. The impact of virtualization on network performance of amazon ec2 data center. In
Proc. of INFOCOM. San Diego, CA, 2010.
[62] Windows azure.http://www.windowsazure.com/.
[63] H. Yang, A. Breslow, J. Mars, and L. Tang. Bubble-flux: precise online qos management for increased utilization in warehouse scale computers. In
Proc. of ISCA. 2013.
[64] M. Zaharia, M. Chowdhury, T. Das, A. Dave, J. Ma, M. McCauley, M. Franklin, S. Shenker, and I. Stoica.
Spark: Cluster computing with working sets. InProc.
of NSDI. San Jose, CA, 2012.
[65] S. M. Zahed and B. C. Lee. Ref: Resource elasticity fairness with sharing incentives for multiprocessors. In
Proc. of ASPLOS. Salt Lake City, UT, 2014.
[66] J. Y. Zhang, P. Wu, J. Zhu, H. Hu, and F. Bonomi. Privacy-preserved mobile sensing through hybrid cloud trust framework. InProc. of ICCC. 2013. [67] X. Zhang, E. Tune, R. Hagmann, R. Jnagal,
V. Gokhale, and J. Wilkes. Cpi2: Cpu performance isolation for shared compute clusters. InProc. of
EuroSys. Prague, 2013.
[68] L. Zhao, R. Iyer, J. Moses, R. Illikkal, S. Makineni, and D. Newell. Exploring large-scale cmp architectures