INTRODUCTION
According to Ramalho et al. (1993) more than one trait should be considered in a common bean breeding program using pure lines or even progenies. Other traits in addition to grain yield, such as disease resistance, number of pods per plant, yield per plant and weight of 100 seeds should be observed and measured to complement the objectives established for the program. In this case, the estimated correlation, measured from the association among the characteristics, enables the breeder to understand the changes that occur in a determined trait in function of the selection practiced on another, correlated trait. Thus knowledge of the correlation is important for simultaneous trait selection or when a trait of interest presents low heritability that hinders measurement or identification. When selecting another trait with high heritability easily identified and highly correlated with the desired trait, the breeder can obtain quicker progress than with direct selection.
Estimates of correlation coefficients in the common bean between grain yield and its primary components and structural and physiological traits have been frequently obtained (Santos et al., 1986; Pereira Filho
Correlations and path analysis of common bean grain yield and its
primary components
Manoel Carlos Gonçalves
*2; Agenor Martinho Correa
1; Deonísio Destro
3; Luiz Carlos Ferreira
de Souza
2and Teodorico Alves Sobrinho
21Universidade Estadual de Mato Grosso dos Sul (UEMS), Rod. Aquidauana/CERA, km 12, CEP 79200-000, Aquidauana,
MS, Brazil; 2Universidade Federal de Mato Grosso do Sul (UFMS), Departamento de Ciências Agrárias, Rod.
Dourados-Itahum, km 12, Caixa Postal 533, CEP 79804-970, Dourados, MS, Brazil; 3Universidade Estadual de Londrina (UEL),
Departamento de Agronomia, Caixa Postal 6001, CEP 86051-990, Londrina, PR, Brazil. (* Corresponding Author. E-mail: [email protected])
ABSTRACT
The objective of this study was to estimate the correlation coefficients (genotypic, phenotypic and environmental) and carry out path analysis between grain yield in kg.ha-1 (basic variable) and its primary components (explicative variables). The experiments, in randomized complete blocks with three replications, were carried out in the counties of Dourados-MS and Aquidauana-MS in the 2000/2001 growing season. Sixteen common bean genotypes were assessed including advanced lines and commercial varieties. Yield per plant and number of pods were explicative variables included in the study that presented the best combinations of path coefficient and correlation, both positive and of high magnitude, and both were superior to that of the variable number of seeds per pod. The explicative variable weight of 100 seeds correlated negatively with grain yield, although its path coefficient was positive, thus suggesting that it should be considered in breeding studies to increase grain yield.
KEY WORDS:Phaseolus vulgaris L., genetic breeding correlations; path analysis yield.
et al., 1987; Coimbra et al., 1998; Coelho et al., 2002). The quantification and interpretation of the magnitude of a correlation can result in errors when indirect selection strategy is used based on the correlated response because high correlation between two traits may be the result of the effect of a third trait or of a group of other traits on them (Cruz and Regazzi, 1997). For these authors, correlation studies among traits do not permit definitive conclusion on the relation of cause and effect.
Path analysis, a method proposed by Wright (1921), permits the partitioning of the correlation coefficients into direct and indirect effects of various traits on a basic variable whose estimates are obtained by multiple regression equations where the variables are previously standardized. According to Gravois and Helms (1992) path analysis has been little applied in crop breeding. Although correlation coefficients among traits are frequently present, they are not incorporated into a path analysis to investigate the relative direct and indirect influence of each trait on yield.
The objective of the present study was to estimate the genotypic, phenotypic and environmental correlations and partition of the correlation between
grain yield (kg.ha-1) with its primary components (number of pods per plant, number of seeds per pod and weight of 100 seeds and yield per plant) into direct and indirect effects to determine the relative importance of each one in determining yield.
MATERIAL AND METHODS
Experiments were carried out in the 2000/2001 growing season in the countries of Dourados-MS (sown in September 2000, the ‘wet harvest‘ and March 2001 the ‘dry harvest´) and Aquidauana-MS (sown in March 2001). The experimental field at the Federal University of Mato Grosso do Sul -UFMS, Dourados Campus, is located on the geographic coordinates 22º12´16" latitude south and 54º 48´ 20" longitude west, altitude 452 meters. The climate is classified by the International Köppen system as Wet Mesothermic with 1500mm mean annual precipitation. The soil is classified as Distroferric Purple latosoil with clay texture. The experimental area of the teaching unit of the Mato Grosso do Sul State University - UEMS - in Aquidauana is located on the geographic coordinates 20º 20´00" latitude south and 55º 48´ 00" longitude west, altitude 207 meters. The climate of the region is classified as Hot Tropical, sub-Wet, 1200 to 1400 mm annual rainfall and Red-Yellow Distroferric Podzol with sandy texture is the predominant pedogenetic unit.
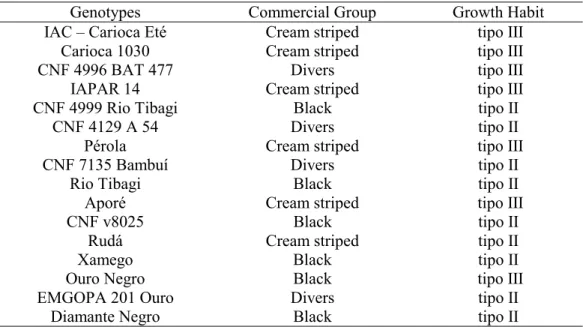
The genotypes used in the experiments involving commercial varieties and advanced lines are described
in Table 1. The soil was prepared by plowing and leveling grade. The ‘wet season harvest´ was sown in September 2000 and harvested in January 2001 and the ‘dry season harvest´ was sown in March 2001 and harvested in July 2001.
A randomized complete block design was used with three replications. Each experimental unit consisted of two 1.50m long rows spaced at 0.50m. The sowing drills were fertilized with the commercial formula 5-2-20 (300 kg.ha-1) in the experiments in Dourados and 4-14-8 (400 kg.ha-1) in the experiment in Aquidauana. Twelve seeds were distributed per linear meter at sowing and cover fertilizer applied 25 days after emergence by applying 40 kg.ha-1 N. Phytosanitary control, weeding and complementary irrigation were carried out to keep the plants under optimum growth and development conditions. Eight plants were taken randomly from each plot and assessed for the traits number of pods per plant (VAG), number of seeds per pod (SEM) and grain yield in grams per plant (PRD1), and a mean per plot was established. The total of plants that formed the final stand (24 to 30) was considered for the trait yield in kg.ha-1 (PRD2) and for the description of the mean number of seeds per pod (SEM) three pods were taken from each plant totaling 24 pods per plot and 72 per treatment. The weight of 100 seeds (PCS) was obtained from a sample of grains collected from the plot. The means of each plot were considered for the genetic-statistic analyses. The following statistical model was adopted: Yijk = µ + Gi + Ej + GEij + B/Ejk + εijk , where:
Table 1. Genotypes used in the experimental environments.
Genotypes Commercial Group Growth Habit
IAC – Carioca Eté Cream striped tipo III
Carioca 1030 Cream striped tipo III
CNF 4996 BAT 477 Divers tipo III
IAPAR 14 Cream striped tipo III
CNF 4999 Rio Tibagi Black tipo II
CNF 4129 A 54 Divers tipo II
Pérola Cream striped tipo III
CNF 7135 Bambuí Divers tipo II
Rio Tibagi Black tipo II
Aporé Cream striped tipo III
CNF v8025 Black tipo II
Rudá Cream striped tipo II
Xamego Black tipo II
Ouro Negro Black tipo III
EMGOPA 201 Ouro Divers tipo II
µ: general mean
Gi: effect of i-eth genotype (i = 1, 2 …, 16) Ej: effect of j-eth environment (j = 1,2,3)
GEij: effect of the interaction of the i-eth genotype with the j-eth environment
B/Ejk: effect of k-eth block within the j-eth environment (k = 1, 2, 3):
εijk: error
The genotype and genotype x environment interaction effects were considered as random and those of environments as fixed (Cruz, 2001). The correlations were estimated from the expressions quoted by Falconer (1987) and Ramalho et al. (1993):
Fy Fx xy f xy F
COV
r
2 2 ) ( ) (.
σ
σ
=
Gy Gx xy G xy GCOV
r
σ
σ
2.
) ( ) (=
Ey Ex xy E xy ECOV
r
2 2 ) ( ) (.
σ
σ
=
, where:rx,y : correlation between traits X and Y; COV(x,y) : covariance between the two traits σ2
x and σ2y : variance of the traits X and Y respectively. The data were not transformed to logarithms to obtain
the additive model of linear regression in the path analysis (Cruz and Regazzi, 1997) because similar results with and without data transformation were obtained by Parodi et al. (1970), a fact that led some researchers, according to Vencovsky and Barriga (1992), to not adopt logarithmic transformation. The phenotypic and genotypic relationships was interpreted and possible traits to be used as indirect selection criteria for yield were identified based on the concept formulated by Board et al. (1997): a) the most desirable traits are those that correlate positively with yield and present high direct positive effects on these traits; b) the traits with moderate direct positive effects on yield (without necessarily being positively correlated) may also serve as selection criteria; c) the traits should have, preferentially, minimum negative indirect effects on yield, through the other traits assessed.
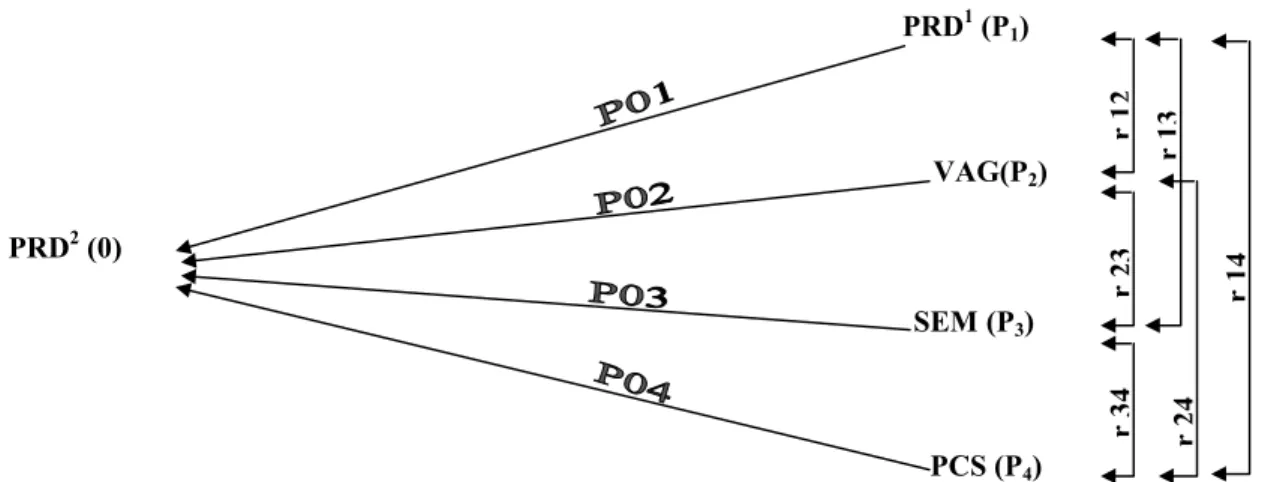
Figure 1 shows the illustrative causal diagram of the direct and indirect effects of the explicative variables on the basic variable in path analysis.
RESULTS AND DISCUSSION
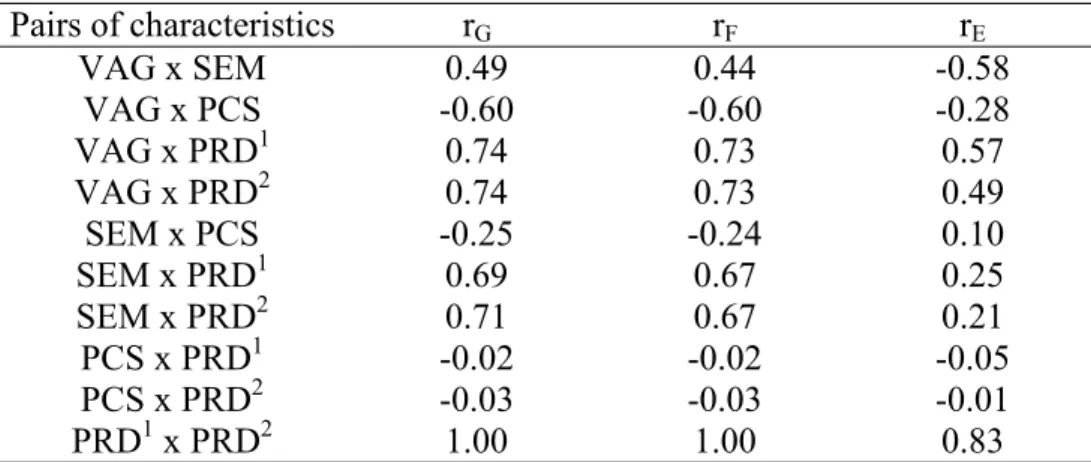
Table 2 shows the coefficient of genotypic (rG), phenotypic (rF), and environmental (rE) correlations among the traits grain yield in kg.ha-1 (PRD2), primary yield components (VAG, SEM and PCS) and yield per plant (PRD1). The magnitude of the rF, rG e rE values ranged from -0.68 to 1.00 and there was generally good agreement in the direction of the correlations, except for the pair of traits VAG x SEM whose genetic (rG) and environmental (rE) correlations had changed signs. Such disagreement, according to
Figure 1. Causal diagram of the direct and indirect effects of the explicative variables (yield per plant (PRD1), number of pods per plant (VAG), number of seeds per pod (SEM) and weight of 100 seeds (PCS) on the basic variable (grain yield in kg.ha-1 (PRD2)).
PRD2 (0) PRD1 (P 1) r1 2 SEM (P3) VAG(P2) PCS (P4) r3 4 r2 3 r1 3 r2 4 r1 4
Falconer and Mackay (1996) is that the genetic and environmental variations influence the traits through different physiological mechanisms. For these authors, occurrence of positive or negative genetic correlation is due mainly to pleiotropy or to genetic links among the genes responsible for these characteristics.
Cruz and Regazzi (1997) commented that, although it is not common, genotypic and phenotypic correlation for the same pair of traits may present changed signs, which is generally attributable to sampling errors, a fact not observed for any of the pairs of trait studied. The authors further stated that negative rE values show that the environment may favor one trait in detriment to another, a fact observed with the pairs of characteristics VAG X SEM, VAG X PCS, PCS X PRD1 and PCS X PRD2 (Table 2), that can be explained by the compensation among the primary production components (Castoldi, 1991). Positive r values indicate that the two traits are benefited or harmed by interaction with the environment.
Positive and high genotypic correlations such as observed among the pairs of traits PRD1 X PRD2; VAG X PRD1, SEM X PRD1 and SEM X PRD2 (Table 2) indicate that the improvement in one trait is reflected positively in the other. When negative, as in the trait pairs VAG X PCS, SEM X PCS, PCS X PRD1 and PCS X PRD2 (Table 2), there is an inverse relationship relationship between the traits.
The VAG trait was the primary yield component that presented the highest positive correlation with grain yield. This suggested that selection to increase the number of pods must have contributed to the increase
in grain yield. Somewhat similar results were obtained by Ramalho et al. (1986), Santos et al. (1986) and Pereira Filho et al. (1987).
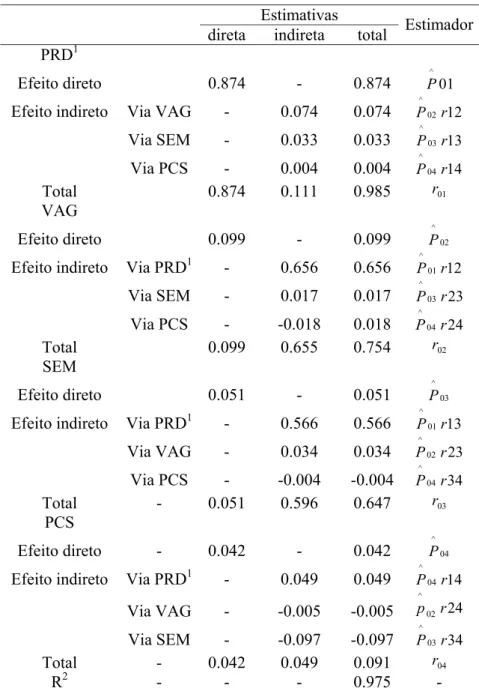
Table 3 shows the results of the estimates of the direct and indirect effects of the primary yield components and of yield per plant, considered explicative variables, on the grain yield per area, the basic variable.
All the explicable values, except for PCS, are determinant for the performance of the basic variable PRD2 because they present path coefficients (direct effects) of the same sign and magnitude as those presented by the coefficients of genotypic correlation (Table 2).
Yield per plant (PRD1) is the most important trait for yield per area because it presents high and positive values in the correlation in the direct effects and in the indirect effects, except for the PCS variable, a fact that should be taken into consideration when recommending sowing density for the crop because high densities may significantly harm yield per area unit due to of the competition effect among plants. The number of pods per plant (VAG) is the primary yield component that exercises greatest direct effect on grain yield because of the greater magnitude of its correlation coefficients and path. Although the PCS variable had direct positive effect on PRD2, the magnitude of its path coefficient was low and it correlated negatively with the basic variable. Such facts suggest that although this variable is not directly important in genetic breeding studies to increase grain yield it should not be disregarded.
Table 2. Estimates of genotypic (rG), phenotypic (rF) and environmental (rE) correlations among pairs of yield traits of common bean (2000/2001 growing season).
VAG: number of pods per plant; SEM: number of seeds per pod; PCS: weight of 100 seeds; PRD1: yield per plant; PRD2: yield in kg.ha-1.
Pairs of characteristics
r
Gr
Fr
EVAG x SEM
0.49
0.44
-0.58
VAG x PCS
-0.60
-0.60
-0.28
VAG x PRD
10.74 0.73 0.57
VAG x PRD
20.74 0.73 0.49
SEM x PCS
-0.25
-0.24
0.10
SEM x PRD
10.69 0.67 0.25
SEM x PRD
20.71 0.67 0.21
PCS x PRD
1-0.02 -0.02 -0.05
PCS x PRD
2-0.03 -0.03 -0.01
PRD
1x PRD
21.00 1.00 0.83
The total determination coefficient (R2) of 97.50% indicates that the variables used explain satisfactorily the performance of the basic variable PRD2.
CONCLUSIONS
The results of the present study permit the following conclusions:
Yield per plant, in common bean, is determinant in
Table 3. Estimates of the direct and indirect effects of the primary yield components and yield per plant (PRD1) on common bean grain yield (kg.ha-1) 1/.
1/ PRD1: yield per plant; VAG: number of pods per plant; SEM: number of seeds per pod; PCS: weight of 100 seeds.
j
P
0^
: direct effect of each one of the four explicative traits (j) on the basic variable 0.
r
yj: coefficient of genotypic correlation among the explicative traits.the yield per area unit, which indicated that sowing density must be very carefully considered;
The primary yield component that correlated best and had greatest effect on grain yield was number of pods per plant and it should be considered in indirect selection to increase this trait.
Although the seed weight was shown not to be directly important for increase in grain yield, this trait should not be disregarded in genetic breeding studies.
Estimativas
direta indireta total Estimador
PRD1
Efeito direto 0.874 - 0.874 P^ 01
Efeito indireto Via VAG - 0.074 0.074 02 12 ^ r P Via SEM - 0.033 0.033 03 13 ^ r P Via PCS - 0.004 0.004 04 14 ^ r P Total 0.874 0.111 0.985 r01 VAG Efeito direto 0.099 - 0.099 02 ^ P
Efeito indireto Via PRD1 - 0.656 0.656 01 12 ^ r P Via SEM - 0.017 0.017 03 23 ^ r P Via PCS - -0.018 0.018 04 24 ^ r P Total 0.099 0.655 0.754 r02 SEM Efeito direto 0.051 - 0.051 03 ^ P
Efeito indireto Via PRD1 - 0.566 0.566 01 13 ^ r P Via VAG - 0.034 0.034 02 23 ^ r P Via PCS - -0.004 -0.004 04 34 ^ r P Total - 0.051 0.596 0.647 r03 PCS Efeito direto - 0.042 - 0.042 04 ^ P
Efeito indireto Via PRD1 - 0.049 0.049 04 14 ^ r P Via VAG - -0.005 -0.005 02 24 ^ r p Via SEM - -0.097 -0.097 03 34 ^ r P Total - 0.042 0.049 0.091 r04 R2 - - - 0.975 -
ACKNOWLEDGEMENTS
The authors thank the CAPES for funding and Embrapa Rice and Beans for fellowships.
RESUMO
Correlações e análise de trilha de produtividade de grãos do feijoeiro comum e seus componentes primários
Este trabalho teve como objetivo estimar coeficientes de correlação (genotípica, fenotípíca e de ambiente) e realizar a análise de trilha entre produtividade de grãos, em kg.ha-1 (variável básica) e seus componentes primários (variáveis explicativas). Os experimentos, em blocos casualizados, com três repetições , foram conduzidos nos municípios de Dourados-MS e Aquidauana-MS, no ano agrícola 2000/2001. Avaliaram-se dezesseis genótipos de feijoeiro-comum entre linhagens avançadas e variedades comerciais. Das variáveis explicativas envolvidas no estudo, após a produtividade por planta, o número de vagens foi a que apresentou melhor combinação de coeficiente de trilha e correlação, ambos positivos e de magnitude elevada, superiores ao da variável número de sementes por vagem. A variável explicativa peso de 100 sementes correlacionou-se negativamente com a produção de grãos, apesar de seu coeficiente de trilha ser positivo, sugerindo, desta forma, que a mesma não deve ser descartada nos trabalhos de melhoramento para incremento de produtividade de grãos.
REFERENCES
Board, J.E.; Kang, M.S. and Harville, B.G. 1997. Path analysis identify indirect selection criteria for yield of late planted soybean. Crop Science. 37(3):879-884. Castoldi, F.L. 1991. Análises das interpretações entre rendimentos e diversas características agronômicas do feijoeiro (Phaseolus vulgaris L.). M. S. Thesis. Universidade Federal de Viçosa, Viçosa:
Coelho, A.D.; Cardoso, A.A.; Cruz, C.D.; Andrade Araujo, G.A.; Ribeiro Furtado, M. and Amaral, C.L.F. 2002. Herdabilidade e correlações da produção de feijão e dos seus componentes primários, nas épocas de cultivo da primavera-verão e do verão-outono. Ciência Rural. 32(2):211-216.
Coimbra, J.L.M.; Guildolin, A.F.; Carvalho, F.I.F de and Duarte, I.A. 1998. Análise quantitativa de parâmetros genéticos e fenotípicos em feijão
(Phaseolus vulgaris L.). Pesq. Agropecuária Gaúcha. 4(2):163-171.
Cruz, C.D. 2001. Programa GENES – versão Windows. Aplicativo computacional em genética e estatística. UFV, Viçosa.
Cruz, C.D. and Regazzi, A.J. 1997. Modelos biométricos aplicados ao melhoramento genético. UFV, Viçosa.
Estado De Mato Grosso Do Sul Secretaria de Planejamento e Coordenação Geral. 1990. Atlas Multirreferencial. Campo Grande.
Falconer, D.S. 1987. Introdução à genética quantitativa. Imprensa Universitária da UFV, Viçosa. Falconer, D.S. and Mackay, T.F.C. 1996. Introduction to quantitative genetics. 4.ed. Longman, England. Gravois, K.A and Helmes, R.S. 1992. Path analysis of rice yield components as affected by seeding rate. Agronomy Journal. 84:1-4.
Parodi, P.; Patterson, F.L.and Nyquist, W.E. 1970. Interrelaciones entre los components principales y secundarios de rendimento en trigo (Triticum aestivum L.) Fitotecnia Latinoamericana. 7:1-15. Pereira Filho, I.A.; Ramalho, M.A.P. and Ferreira, S. 1987. Avaliação de progênies de feijão e estimativas de parâmetros genéticos na região do Alto são Francisco em Minas Gerais. Pesquisa Agropecuária Brasileira. 22(9/10):987-993.
Ramalho, M.A.P.; Santos, J.B. dos and Santa Cecília, F.C. 1986. Seleção de progênies no feijão “Pintado” e estimativas de parâmetros genéticos e fenotípicos. Ciência e Prática. 3(1):51-57.
Ramalho, M.A.P.; Santos, J.B. dos and Zimmermann, M.J. de O. 1993. Genética Quantitativa em plantas autógamas: aplicação ao melhoramento do feijoeiro. UFG, Goiânia.
Santos, P.C. dos; Cardoso, A.A.; Vieira, C. and Silva, J.C. 1986. Herdabilidade e correlações do rendimento em dois cruzamentos de feijão. Revista Ceres. 33(189):404-412.
Vencovsky., R. and Barriga, P. 1992. Genética biométrica no fitomelhoramento. Sociedade Brasileira de Genética, Ribeirão Preto.
Wright, S. 1921. Correlation and causation. Journal of Agricultural Research. 20:557-585.
Received: November 01, 2002; Accepted: January 27, 2003.