Associations among personal care product use patterns and
exogenous hormone use in the NIEHS Sister Study
Kyla W. Taylor1, Donna D. Baird2, Amy H. Herring3,4, Lawrence S. Engel5, Hazel B. Nichols5, Dale P. Sandler2, and Melissa A. Troester5
1Office of Health Assessment and Translation, National Toxicology Program, National Institute of
Environmental Health Sciences, NIH, DHHS, Research Triangle Park, North Carolina 27709 USA
2Epidemiology Department, National Institute of Environmental Health Sciences, Chapel Hill,
North Carolina, USA
3Biostatistics Deptartment, University of North Carolina, Chapel Hill, North Carolina, USA 4Carolina Population Center, Chapel Hill, North Carolina, USA
5Epidemiology Deptartment, University of North Carolina, Chapel Hill, North Carolina, USA
Abstract
It is hypothesized that certain chemicals in personal care products may alter the risk of adverse health outcomes. The primary aim of this study was to use a data-centered approach to classify complex patterns of exposure to personal care products and to understand how these patterns vary according to use of exogenous hormone exposures, oral contraceptives (OCs) and
post-menopausal hormone therapy (HT). The NIEHS Sister Study is a prospective cohort study of 50,884 US women. Limiting the sample to non-Hispanic blacks and whites (N = 47,019), latent class analysis (LCA) was used to identify groups of individuals with similar patterns of personal care product use based on responses to 48 survey questions. Personal care products were categorized into three product types (beauty, hair, and skincare products) and separate latent classes were constructed for each type. Adjusted prevalence differences (PD) were calculated to estimate the association between exogenous hormone use, as measured by ever/never OC or HT use, and patterns of personal care product use. LCA reduced data dimensionality by grouping of individuals with similar patterns of personal care product use into mutually exclusive latent classes (three latent classes for beauty product use, three for hair, and four for skin care. There were strong differences in personal care usage by race, particularly for haircare products. For both blacks and whites, exogenous hormone exposures were associated with higher levels of product use, especially beauty and skincare products. Relative to individual product use questions, latent class variables capture complex patterns of personal care product usage. These patterns differed by race and were associated with ever OC and HT use. Future studies should consider personal care product exposures with other exogenous exposures when modeling health risks.
Correspondence: Dr Kyla W. Taylor, National Institute of Environmental Health Sciences, P.O. Box 12233, MD K2-04, Research Triangle Park, North Carolina 27709 USA. Tel.: +1 919 316 4707. Fax: +1 919 541 1994. [email protected].
HHS Public Access
Author manuscript
J Expo Sci Environ Epidemiol
. Author manuscript; available in PMC 2017 September 01.Published in final edited form as:
J Expo Sci Environ Epidemiol. 2017 September ; 27(5): 458–464. doi:10.1038/jes.2016.82.
A
uthor Man
uscr
ipt
A
uthor Man
uscr
ipt
A
uthor Man
uscr
ipt
A
uthor Man
uscr
Keywords
empirical/statistical models; endocrine disruptors; epidemiology; exposure modeling; personal exposure; population based studies
INTRODUCTION
The average American woman uses 12 personal care products a day, resulting in daily exposure to an estimated 126 unique chemicals.1 Because certain chemicals in personal care products are suspected endocrine disrupters (e.g, phthalates, parabens, triclosan),2,3 there is concern that exposure to personal care products may be associated with risk of breast cancer and/or may have adverse reproductive health effects. In vitro and animal studies have demonstrated that endocrine disrupting chemicals can mimic estrogens,4 alter hormonal signaling, affect developing reproductive systems,5 and/or disrupt normal mammary development.6 However, there is currently no definitive evidence for the same effects in humans.7–10
The strongest evidence to support concern for endocrine disrupting chemicals comes from experimental animal studies.10 However, laboratory animals are usually exposed to
individual chemicals over short periods of time (often at higher doses than humans), whereas humans are typically exposed to multiple endocrine disrupting compounds simultaneously over many years. Consequently, there is concern that laboratory animal data have not addressed the patterns of exposure to these complex mixtures, which may be most relevant.11,12 At the same time, more information is needed to characterize the nature of human exposure in order to design more appropriate animal and in vitro studies of complex mixtures as well as validate computational models of predicted exposure. To address the limitations in experimental animal studies and capture the exposure characteristics in human populations, human studies are needed.
The objective of the current study was to use data from 47,019 women in the NIEHS Sister Study to characterize patterns of personal care product use across a wide range of products. We hypothesized that individuals would be classifiable according to broad patterns of personal care product usage, with patterns differing by race. To investigate possible correlated estrogenic exposures in epidemiologic studies, we also examined the association between personal care product use and two common estrogenic medications (e.g., oral contraceptive (OC) and hormone therapy (HT) use). We used latent class analysis (LCA) to identify groups of women by patterns of product use and compared these patterns with in terms of past exogenous estrogen use.
MATERIALS AND METHODS
Study Population
The Sister Study is a large prospective cohort study directed at identifying environmental and genetic risk factors for breast cancer. The study consists of 50,884 women who had at least one sister diagnosed with breast cancer but were cancer-free themselves at time of enrollment. Study enrollment began in 2003 and ended in 2009, and eligible women were
A
uthor Man
uscr
ipt
A
uthor Man
uscr
ipt
A
uthor Man
uscr
ipt
A
uthor Man
uscr
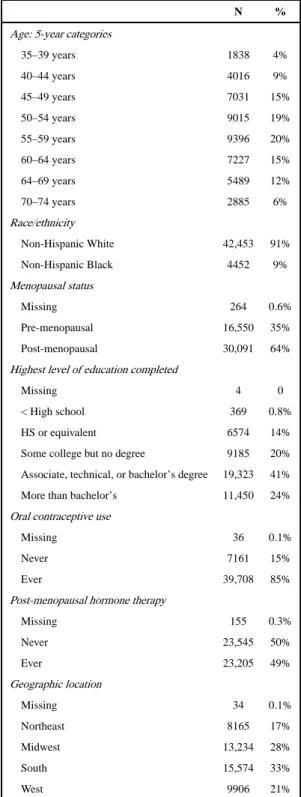
35–74 years of age. Baseline enrollment activities included a computer-assisted telephone interview and self-administered questionnaires that elicited information about environmental and genetic risk factors for breast cancer. The Sister Study was approved by the institutional review boards at the National Institute of Environmental Health Sciences and Copernicus Group. Written informed consent was provided by study participants. The present analysis was limited to non-Hispanic white (n = 42,558, 84% of participants) and non-Hispanic black (n = 4462, 9% of participants) women (Table 1); there were too few Hispanic (5%) and Other (3%) participants to include in this analysis.
Personal Care Product Assessment
Detailed self-reported use of 48 personal care products was collected during the baseline phase of the study (Supplementary Material 1) by inquiring about frequency of use (5-level-response options) during the previous 12 months. The five (5-level-response options varied according to intended use of the product. For example, the response options for a product intended to be used regularly (e.g., hand lotion) included: (1) did not use, (2) used less than once a month, (3) used 1–3 times per month, (4) 1–5 times per week, (5) >5 times per week. Response options for products that are used less often (e.g., hair dye) included: (1) did not use, (2) 1–2 times a year, (3) every 3–4 months, (4) every 5–8 weeks, (5) once a month or more. To identify latent classes of personal care product use, each of three product categories were analyzed separately to identify latent classes for each category: (1) beauty products (e.g., lipstick, mascara, nail polish), (2) hair products (e.g., hair spray, hair relaxers), and (3) skincare products (e.g. facial lotion, hand lotion).
Latent Classes
LCA was used to identify groups of individuals with similar patterns of personal care product use. LCA is a data reduction tool that describes variability among multiple, correlated, observed variables in terms of a fewer number of unobserved variables called latent classes. It has been used for identifying patterns of exposure when the exposure is a complex combination of separate factors.13 Personal care products were categorized into three product types,14 and separate latent classes were constructed for each type: (1) beauty products, (2) hair products, and (3) skincare products. To reduce dimensionality, improve interpretability of the model, and improve classification and precision we used a method based on Dean et al.15 to select the variables that were most useful for distinguishing among latent classes (i.e., ≥ 10% difference in posterior probabilities between classes). Variables that were determined not to contribute to the distinction between latent classes were removed from the model.
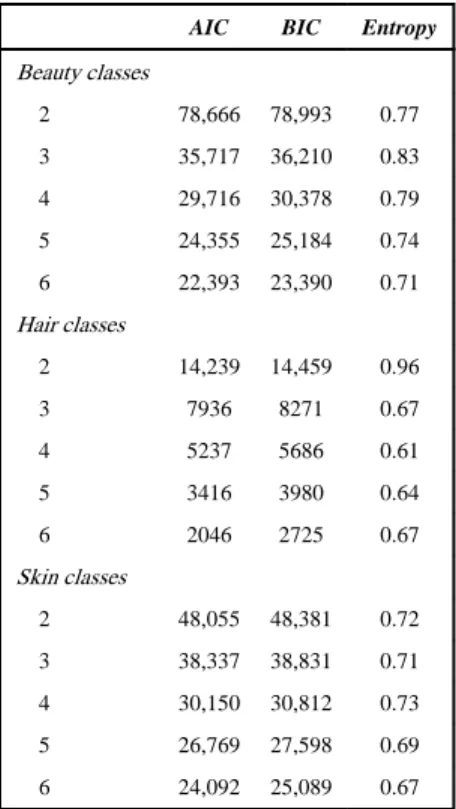
We fit a sequence of LCA models starting with two classes and increasing the number of classes for each model (up to six). To identify an optimal but minimal number of classes, Akaike’s information criterion (AIC), the Bayesian information criterion (BIC), and entropy were considered.13 A smaller AIC and BIC and higher entropy for a particular model suggests a better model fit.13 The AIC and BIC continue to diminish with increasing numbers of latent classes; however, to avoid overfitting sparsely populated categories, we identified an optimal number of classes through a combination of the change in information criteria (i.e., a leveling off of differences) and minimum size of the latent class (10%). A
A
uthor Man
uscr
ipt
A
uthor Man
uscr
ipt
A
uthor Man
uscr
ipt
A
uthor Man
uscr
summary of the fit statistics and entropy are shown in Table 2. The classes were described and labeled based on item-response probabilities15 and ability to identify which variables were driving each class.13
To assign participants class membership, we used a common classify-analyze approach referred to as the maximum-probability assignment rule, where individuals are assigned to the class in which they have the highest posterior probability of membership.16 Item-response probabilities provided the basis on which each latent class was interpreted.17 The correlation among use patterns for the three product types was evaluated by Spearman correlation coefficients of the item-response variables’ posterior probabilities.
Statistical Analysis Describing Association Between Personal Product Use and Exogenous Hormone Use
We examined associations between personal product use and OC use (ever, never) for the entire sample and the association between personal care product use and HT use (never/ever) among women >50 years. We used logistic regression stratified by race to estimate age-adjusted prevalence differences (PD) and 95% confidence intervals in exogenous hormone use associated with latent class membership for the three different product types. OC use and HT use were coded as binary variables so they could be allocated as outcome variables in the logistic models. As an additional analysis we examined the associations between personal product use and duration of OC and HT use (≥ 5 vs < 5 years).
RESULTS
Latent Class Descriptions
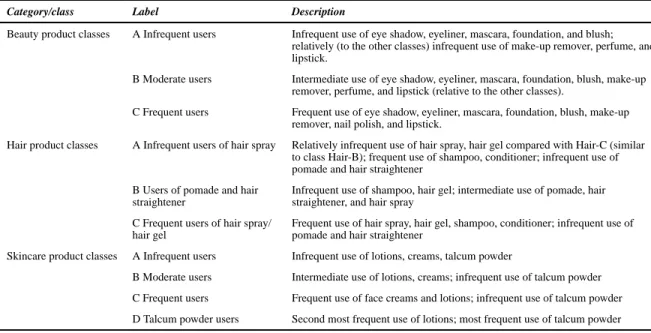
Based on fit statistics and parsimony (Table 2), three latent classes were identified as optimal for both the beauty and hair product groups; the skincare product group had four classes. Figure 1 indicates the specific personal care products and the item-response probabilities for each product. Analysis of fourteen initial beauty product usage items resulted in three latent classes (infrequent users; moderate users; frequent users) with nine contributing product items: mascara, lipstick, foundation, nail polish, perfume, eye shadow, eyeliner, blush, and make-up remover (Figure 1, Table 3). Analysis of fifteen hair product usage items resulted in three latent classes (infrequent users of hair products other than shampoo/conditioner; users of pomade and hair straightener; frequent users of hair products other than pomade and hair straightener) with six contributing product items: pomade, hair straightener, conditioner, hair spray, hair gel, and shampoo. Finally, analysis of nineteen skincare product usage items resulted in four latent classes (infrequent users; moderate users; frequent users; talcum powder users) with nine contributing product items: cleansing cream, anti-aging cream, body lotion, hand lotion, face cream, foot cream, petroleum jelly, talcum powder applied under arms, and talcum powder applied elsewhere. Short descriptions of the classes were created based on the item-response probabilities.
Product-Use Patterns by Race
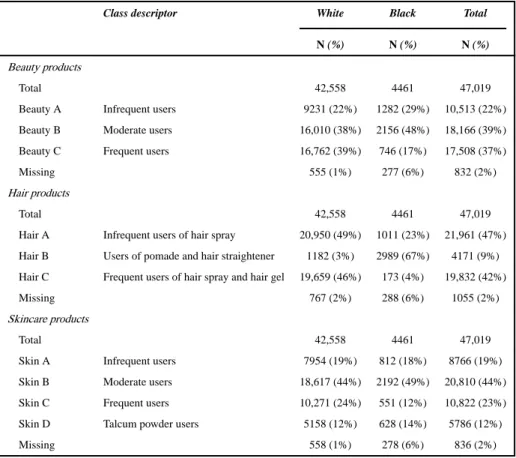
Among non-Hispanic women in our study population, 91% were white and 9% were black (Table 4). Race was most strongly associated with differences in haircare product classes;
A
uthor Man
uscr
ipt
A
uthor Man
uscr
ipt
A
uthor Man
uscr
ipt
A
uthor Man
uscr
only 3% of white women were in the “users of pomade and hair straightener” group, whereas over two-thirds (67%) of black women were. There were also some differences in beauty product classes: white women were more frequent users than black women. The moderate lotion user category was the most common skincare class among both black and white women users (Table 4). Because of racial differences in population distribution across product classes, we report results separately by race in the subsequent analyses.
Patterns of Class Membership Across Product Categories (Beauty, Hair, Skin)
After considering different types of personal care products in separate classification
schemas, we also evaluated whether product usage class in one category (e.g., hair products) predicted use in another category (e.g., beauty products). As shown in Figure 2, the product types for whites tended to be correlated, i.e., infrequent users of one product type tended to be infrequent users of the other product types, but correlation coefficients were modest. The highest correlation of posterior probabilities of class membership was between infrequent users of beauty and skincare products (r = 0.45). The next strongest correlation was between frequent users of beauty products and hair products (r = 0.39). For black women the correlations among usage patterns for the different product types were low except for skin and beauty (r =0.39).
Exogenous Hormonal Exposures and Product Use
The prevalence of OC use history was 85% for whites and 86% for blacks; the prevalence of HT among women over age 50 was 51% for whites and 48% for blacks. The percentage of women (all ages) who had ever used OC therapy and/or HT was 93% (N = 39,388) among white women and 91% (4449) among black women. Exogenous hormonal exposures (Figure 3) showed strong associations with product use. White and black women who had ever taken OCs were more likely to be “moderate users” or “frequent users” of beauty products than to be “infrequent users” of beauty products. Black women who had used OCs were also more likely to be “moderate users” of skincare products than to be “infrequent users”. White and black women over age 50 who had ever received HT were more likely to be “frequent users” of beauty products than to be “infrequent users” of beauty products. White women who had ever received HT were substantially more likely to be “moderate users” of skincare products or “talcum powder users” than to be “infrequent users”. When we used ≥ 5 vs < 5 years of OC or HT exposure as the variable of interest, the pattern of results was essentially the same as when we used ever/never, though the associations tended to be somewhat attenuated (Supplementary tables).
DISCUSSION
We found that use of LCA could identify a relatively small number of subgroups of women with distinct personal care product use and that personal care product use varied by race. We also showed that the women with the highest use of personal care products are more likely to have used the common exogenous hormone medications, OC, or HT. Previous studies have examined correlation structure between specific personal care products,14,18,19 but such studies were not aimed at reducing the complexity of individual product usage patterns, nor
A
uthor Man
uscr
ipt
A
uthor Man
uscr
ipt
A
uthor Man
uscr
ipt
A
uthor Man
uscr
did these studies evaluate associations between personal care product use and other exposures.
Some key challenges have impeded progress in understanding the relationship between personal care product use and health outcomes in humans. First, publically available data on personal care product usage patterns in the United States typically lack large sample populations or include only specific types of product users.20–23 Currently the only population-based studies of personal care product use that have a comparison group of infrequent personal care product users are limited to other countries,18,19 or small
populations within the United States.14 Second, studies that have collected data on product use have described correlations between use patterns for only a limited numbers of products. Third, studies to date have not placed the personal care product exposures in context of other exposures, particularly those in relevant biological pathways.
Our analysis addresses some of these challenges. First, we used a large, nationwide study of personal care product use and other environmental exposures to study patterns of exposure. Second, we took a broad approach to characterizing exposure, starting with data on 48 different personal care products included in the Sister Study’s questionnaire. Then we used LCA to identify a subset of 24 of the 48 that provided unique information on pattern of product use within three product-use categories (beauty, hair, and skin). The result was a set of exposure variables that grouped women with similar product use. Finally, we used the LCA-identified use patterns to examine the association between personal care product use and history of using either OC or HT. With this data reduction method, we could investigate associations between product use and other factors with control for potential confounders and without the severe multiple-testing problems that arise when each product is examined separately.
However, with currently available data we cannot specify a commonality of chemical exposures, only a commonality of which products tend to be used together by different groups of women. Information about specific chemicals or ingredients in personal care products was not captured in the questionnaire.
The use of LCA was a key strength of our analysis. As opposed to a variable centered approach that considers how variables are related to each other, LCA is a data-centered approach that considers how variables are grouped within individuals. LCA can reduce and organize large, multifaceted data sets and create manageable categorical data elements to summarize complex patterns.13 LCA has been used to capture complex exposures in a variety of research settings. For example, it has been used to organize and describe subgroups of weight loss strategies and disordered eating among women17 and to identify subgroups of emerging sexual behaviors among adolescents.24 LCA has also been used to identify substance use behavior among adolescents to inform programs that could be targeted for or tailored to the different population subgroups that are expected to show the strongest response.25
Our results were consistent with some previous studies. We observed race-related patterns of hair product use similar to those observed in previous smaller studies.9,26–28 The class that
A
uthor Man
uscr
ipt
A
uthor Man
uscr
ipt
A
uthor Man
uscr
ipt
A
uthor Man
uscr
was characterized by use of pomade and hair straightener contained the majority of black women, but only 3% of white women. In a small study with 10 black and 206 white participants from California14 African American women were more likely to have their hair treated permanently (including chemical straightening or relaxing). Although the National Health and Nutrition Examination Survey (NHANES) 1999–2000 did not collect
questionnaire information on frequency of product use, a NHANES analysis of 2540 participant samples found that compared with non-Hispanic white women, African American women had higher urinary levels of monoethyl phthalate, a phthalate found in personal care products.9 The authors of the NHANES suggest that these differences were likely due to differences in hair texture and cultural practices. Although our analyses did not link product exposure with specific internal dose markers, future application of LCA approaches, or the patterns identified here, could be used to link specific exposure biomarkers with self-reported exposure information.
To consider personal care product use in association with health outcomes, it is important to integrate these exposures with other biologically relevant and risk-related exposures. Having observed correlation within personal care product use classes (e.g., between heavy users of haircare products and heavy users of beauty products), we tested whether personal care product categories are associated with other relevant exposure patterns. OC and HT are examples of key exposures to exogenous estrogens. There were statistically significant associations between beauty and skincare product latent classes and OC and HT. Therefore, when personal care product use is being evaluated as a potential risk factor for hormonally mediated conditions, we encourage researchers to consider possible confounding by OC and HT use.
Our analysis has several key strengths. LCA provides an objective method of distinguishing between groups of women on the basis of their patterns of personal care product use and, thus, potential chemical exposures. The number of latent classes is determined, in part, by data-based metrics, and is small relative to the number of product use items. The component product-use probabilities are complex and objectively discerning overall product-use data from casual inspection would be difficult. The NIEHS Sister Study provided a large dataset for this purpose.
LCA provides an objective means of reducing data dimensionality; however, there are some limitations. For example, the classes can be difficult to interpret. Labels were assigned to different classes based on our observation and interpretation of the probability based weights for class membership. Although there is some subjectivity in choosing the shorthand label descriptors for different classes, the precise item-response probabilities are provided in Supplementary tables. Another limitation was that we could not consider them all of the personal care products together; owing to the large number of variables we had to break LCA into three different product category models: beauty, hair, and skin products. Also, the categories we identified with LCA may not be generalizable to other populations. Therefore it is important that these methods are replicated in other populations. Finally, our models only adjusted for age and not for other possible confounders of the personal care product use and exogenous estrogen association. However, the goal of this research was not to quantify the independent effects of personal care product use on estrogen exposure, but rather to
A
uthor Man
uscr
ipt
A
uthor Man
uscr
ipt
A
uthor Man
uscr
ipt
A
uthor Man
uscr
illustrate a method for identifying important covariates for future studies of personal care product-health outcome associations.
CONCLUSION
One active area of environmental health research is the investigation of associations between personal care product use and health outcomes.29–31 This necessitates a thorough
understanding of how exposures vary within a population and co-vary with other exposures. We used LCA to identify patterns of personal care product use among a nationwide group of women and found that for white women, those with the highest level of exposure to personal care products also tended to have used exogenous hormone medications. Understanding and accounting for such relationships is critical as researchers explore associations between personal care product use and health outcomes. Future studies on personal care product exposures and health impacts should consider common hormonal treatments as potential confounders.
References
1. Environmental Working Group. Exposures add up: survey results [website]. Available: http:// wwwewgorg/skindeep/2004/06/15/exposures-add-up-survey-results/ (accessed on 3 April 2014) 2. Jones J. Can rumors cause cancer? J Nat l Cancer Inst. 2000; 92:1469–1471.
3. Dodson RE. Endocrine disruptors and asthma-associated chemicals in consumer products. Environ Health Perspect. 2012; 120:935–943. [PubMed: 22398195]
4. Davis D, Bradlow H, Wolff M, Woodruff T, Hoel D, Anton-Culver H. Medical hypothesis: xenoestrogens as preventable causes of breast cancer. Environ Health Perspect. 1993; 101:372–377. [PubMed: 8119245]
5. Colborn T. Developmental effects of endocrine-disrupting chemicals in wildlife and humans. Environ Health Perspect. 1993; 101:378–384. [PubMed: 8080506]
6. Macon MB. Endocrine disruptors and the breast: early life effects and later life disease. J Mammary Gland Biol Neoplasia. 2013; 18:43–61. [PubMed: 23417729]
7. Barrett JR. Chemical exposures: the ugly side of beauty products. Environ Health Perspect. 2005; 113:A24–A24. [PubMed: 15631956]
8. Kortenkamp A. Low dose mixture effects of endocrine disrupters: implications for risk assessment and epidemiology. Int J Androl. 2008; 31:233–240. [PubMed: 18248400]
9. Silva MJ, Barr DB, Reidy JA, Malek NA, Hodge CC, Caudill SP, et al. Urinary levels of seven phthalate metabolites in the U.S. population from the National Health and Nutrition Examination Survey (NHANES) 1999–2000. Environ Health Perspect. 2004; 112:331–338. [PubMed: 14998749] 10. World Health Organization. State of the Science of Endocrine Disrupting Chemicals. An
assessment of the state of the science of endocrine disruptors prepared by a group of experts for the United Nations Environment Programme and World Health Organization. Geneva: World Health Organization, United Nations Environment Programm; 2012. (cited 2 January 2016) 11. Carlin DJ, Rider CV, Woychik R, Birnbaum LS. Unraveling the health effects of environmental
mixtures: an NIEHS priority. Environ Health Perspect. 2013; 121:A6–A8. [PubMed: 23409283] 12. NIEHS. (National Institute of Environmental Health Sciences). 2012–2017 Strategic Plan.
Advancing Science, Improving Health: A Plan for Environmental Health Research. 2012. Publication No 12-7935http://niehs.nih.gov/about/strategicplan/index.cfm (accessed 11 October 2015)
13. Lanza ST. PROC LCA: a SAS procedure for latent Class analysis. Struct Equ Model. 2007; 14:671–694.
A
uthor Man
uscr
ipt
A
uthor Man
uscr
ipt
A
uthor Man
uscr
ipt
A
uthor Man
uscr
14. Wu X, Bennett DH, Ritz B, Cassady DL, Lee K, Hertz-Picciotto I. Usage pattern of personal care products in California households. Food Chem Toxicol. 2010; 48:3109–3119. [PubMed: 20696198]
15. Dean N, Raftery AE. Latent class analysis variable selection. Ann Inst Stat Math. 2010; 62:11–35. [PubMed: 20827439]
16. Bray BC, Lanza ST, Tan Z. An introduction to elminating bias in classify-analyze approaches for latent class analysis. The Methodoogy Center Technical Report. :N012–N1182012.
17. Lanza ST, Savage JS, Birch LL. Identification and omen. Obesity prediction of latent classes of weight-loss strategies among women. 2010; 18:833–840.
18. Biesterbos JWH, Dudzina T, Delmaar CJE, Bakker MI, Russel FGM, von Goetz N, et al. Usage patterns of personal care products: Important factors for exposure assessment. Food Chem Toxicol. 2013; 55:8–17. [PubMed: 23174517]
19. Manová E, von Goetz N, Keller C, Siegrist M, Hungerbühler K. Use patterns of leave-on personal care products among Swiss-German children, adolescents, and adults. Int J Environ Res Public Health. 2013; 10:2778–2798. [PubMed: 23823714]
20. Fakri S. Antiperspirant use as a risk factor for breast cancer in Iraq. East Mediterr Health J. 2006; 12:478–82. [PubMed: 17037719]
21. Mirick DK, Davis S, Thomas DB. Antiperspirant use and the risk of breast cancer. J Natl Cancer Inst. 2002; 94:1578–1580. [PubMed: 12381712]
22. McGrath KG. An earlier age of breast cancer diagnosis related to more frequent use of
antiperspirants/deodorants and underarm shaving. Eur J Cancer Prev. 2003; 12:479–485. [PubMed: 14639125]
23. Takkouche B, Etminan M, Montes-Martínez A. Personal use of hair dyes and risk of cancer: a meta-analysis. JAMA. 2005; 293:2516–2525. [PubMed: 15914752]
24. Lanza ST, Rhoades BL. Latent class analysis: an alternative perspective on subgroup analysis in prevention and treatment. Prev Sci. 2013; 14:157–168. [PubMed: 21318625]
25. Haydon AA, Herring AH, Halpern CT. Associations between patterns of emerging sexual behavior and young adult reproductive health. Perspect Sex Reprod Health. 2012; 44:218–227. [PubMed: 23231329]
26. James-Todd T, Terry MB, Rich-Edwards J, Deierlein A, Senie R. Childhood hair product use and earlier age at menarche in a racially diverse study population: a Pilot study. Ann Epidemiol. 2011; 21:461–465. [PubMed: 21421329]
27. Tiwary CM. Premature sexual development in children following the use of estrogen-or placenta-containing hair products. Clin Pediatr. 1998; 37:733–739.
28. Tiwary CM, Ward JA. Use of hair products containing hormone or placenta by US military personnel. J Pediatr Endocrinol Metab. 2003; 16:1025–1032. [PubMed: 14513880]
29. Campaign for Safe Cosmetics. Campaign for Safe Cosmetics. Chemicals of Concern [website]. 2015. Available. http://www.safecosmetics.org/get-the-facts/chemicals-of-concern/. Accessed 16 March 2015
30. EWG. EWG’s Skin Deep Cosmetics Database. http://wwwewgorg/skindeep/. Accessed 5 November 2012
31. Kessler R. More than cosmetic changes: taking stock of personal care product safety. Environ Health Perspect. 2015; 123:A120–A127. [PubMed: 25933009]
A
uthor Man
uscr
ipt
A
uthor Man
uscr
ipt
A
uthor Man
uscr
ipt
A
uthor Man
uscr
Figure 1.
Item-response probability conditional on class membership.
A
uthor Man
uscr
ipt
A
uthor Man
uscr
ipt
A
uthor Man
uscr
ipt
A
uthor Man
uscr
Figure 2.
Spearman correlation coefficients of posterior probabilities of latent class membership for beauty products, hair products, and skincare products among (a) white and (b) black women r = Spearman Correlation Coefficient.
A
uthor Man
uscr
ipt
A
uthor Man
uscr
ipt
A
uthor Man
uscr
ipt
A
uthor Man
uscr
Figure 3.
Prevalence differences (PDs) and 95% confidence intervals (CIs) for oral contraceptive (OC) and post-menopausal hormone therapy (HT) by race.
OC: Oral contraceptives.
HT: Post-menopausal hormone therapy
Statistically significant results are those where the 95% CI excludes a prevalence difference of zero.
A
uthor Man
uscr
ipt
A
uthor Man
uscr
ipt
A
uthor Man
uscr
ipt
A
uthor Man
uscr
A
uthor Man
uscr
ipt
A
uthor Man
uscr
ipt
A
uthor Man
uscr
ipt
A
uthor Man
uscr
ipt
Table 1
Descriptive characteristics of sample population.
N %
Age: 5-year categories
35–39 years 1838 4%
40–44 years 4016 9%
45–49 years 7031 15%
50–54 years 9015 19%
55–59 years 9396 20%
60–64 years 7227 15%
64–69 years 5489 12%
70–74 years 2885 6%
Race/ethnicity
Non-Hispanic White 42,453 91%
Non-Hispanic Black 4452 9%
Menopausal status
Missing 264 0.6%
Pre-menopausal 16,550 35%
Post-menopausal 30,091 64%
Highest level of education completed
Missing 4 0
< High school 369 0.8%
HS or equivalent 6574 14%
Some college but no degree 9185 20%
Associate, technical, or bachelor’s degree 19,323 41%
More than bachelor’s 11,450 24%
Oral contraceptive use
Missing 36 0.1%
Never 7161 15%
Ever 39,708 85%
Post-menopausal hormone therapy
Missing 155 0.3%
Never 23,545 50%
Ever 23,205 49%
Geographic location
Missing 34 0.1%
Northeast 8165 17%
Midwest 13,234 28%
South 15,574 33%
A
uthor Man
uscr
ipt
A
uthor Man
uscr
ipt
A
uthor Man
uscr
ipt
A
uthor Man
uscr
ipt
Table 2
Indicators of fit for latent class analysis.
AIC BIC Entropy
Beauty classes
2 78,666 78,993 0.77
3 35,717 36,210 0.83
4 29,716 30,378 0.79
5 24,355 25,184 0.74
6 22,393 23,390 0.71
Hair classes
2 14,239 14,459 0.96
3 7936 8271 0.67
4 5237 5686 0.61
5 3416 3980 0.64
6 2046 2725 0.67
Skin classes
2 48,055 48,381 0.72
3 38,337 38,831 0.71
4 30,150 30,812 0.73
5 26,769 27,598 0.69
6 24,092 25,089 0.67
A
uthor Man
uscr
ipt
A
uthor Man
uscr
ipt
A
uthor Man
uscr
ipt
A
uthor Man
uscr
ipt
Table 3
Latent class labels and descriptions by product category.
Category/class Label Description
Beauty product classes A Infrequent users Infrequent use of eye shadow, eyeliner, mascara, foundation, and blush; relatively (to the other classes) infrequent use of make-up remover, perfume, and lipstick.
B Moderate users Intermediate use of eye shadow, eyeliner, mascara, foundation, blush, make-up remover, perfume, and lipstick (relative to the other classes).
C Frequent users Frequent use of eye shadow, eyeliner, mascara, foundation, blush, make-up remover, nail polish, and lipstick.
Hair product classes A Infrequent users of hair spray Relatively infrequent use of hair spray, hair gel compared with Hair-C (similar to class Hair-B); frequent use of shampoo, conditioner; infrequent use of pomade and hair straightener
B Users of pomade and hair straightener
Infrequent use of shampoo, hair gel; intermediate use of pomade, hair straightener, and hair spray
C Frequent users of hair spray/ hair gel
Frequent use of hair spray, hair gel, shampoo, conditioner; infrequent use of pomade and hair straightener
Skincare product classes A Infrequent users Infrequent use of lotions, creams, talcum powder
B Moderate users Intermediate use of lotions, creams; infrequent use of talcum powder
C Frequent users Frequent use of face creams and lotions; infrequent use of talcum powder
A
uthor Man
uscr
ipt
A
uthor Man
uscr
ipt
A
uthor Man
uscr
ipt
A
uthor Man
uscr
ipt
Table 4
Latent class distribution by race.
Class descriptor White Black Total
N (%) N (%) N (%)
Beauty products
Total 42,558 4461 47,019
Beauty A Infrequent users 9231 (22%) 1282 (29%) 10,513 (22%)
Beauty B Moderate users 16,010 (38%) 2156 (48%) 18,166 (39%)
Beauty C Frequent users 16,762 (39%) 746 (17%) 17,508 (37%)
Missing 555 (1%) 277 (6%) 832 (2%)
Hair products
Total 42,558 4461 47,019
Hair A Infrequent users of hair spray 20,950 (49%) 1011 (23%) 21,961 (47%)
Hair B Users of pomade and hair straightener 1182 (3%) 2989 (67%) 4171 (9%)
Hair C Frequent users of hair spray and hair gel 19,659 (46%) 173 (4%) 19,832 (42%)
Missing 767 (2%) 288 (6%) 1055 (2%)
Skincare products
Total 42,558 4461 47,019
Skin A Infrequent users 7954 (19%) 812 (18%) 8766 (19%)
Skin B Moderate users 18,617 (44%) 2192 (49%) 20,810 (44%)
Skin C Frequent users 10,271 (24%) 551 (12%) 10,822 (23%)
Skin D Talcum powder users 5158 (12%) 628 (14%) 5786 (12%)