TOWARDS AN UNDERSTANDING OF THE EFFECTS OF ENCODING VARIABILITY ON LONG-TERM MEMORY
Milton E. Picklesimer
A dissertation submitted to the faculty at the University of North Carolina at Chapel Hill in partial fulfillment of the requirements for the degree of Doctorate of Philosophy in the
Department of Psychology and Neuroscience.
Chapel Hill 2016
© 2016
ABSTRACT
Milton E. Picklesimer: Towards an Understanding of the Effects of Encoding Variability on Long-Term Memory
(Under the direction of Neil W. Mulligan)
Prior research on encoding variability has often employed it as an auxiliary concept in an attempt to explain what gives rise to the spacing effect. However, tests of this hypothesis
serendipitously revealed that spacing modulates the effects of encoding variability. It often results in superior performance (relative to encoding constancy) at short repetition lags, and this difference dissipates at longer lags. The chunking hypothesis is an extant but scarcely known theory that can account for this frequent pattern in the literature. This theory’s core assumption is that encoding variability can enhance memory when something is recognized as a repetition, and then the information from both presentations is chunked into an enriched memory code (all of which is presumably easier at short lags). However, this core assumption about recognizing repetitions (a.k.a., study-phase retrieval) remains untested. The current study tested this
assumption—as well as other ones implied by the chunking hypothesis—using methods akin to a continuous recognition memory paradigm. We also employed a metric of chunking to see if details from both presentations of a target stimulus exhibited statistical dependence between each other in ways predicted by the chunking hypothesis. The results largely supported the
TABLE OF CONTENTS
LIST OF FIGURES ... vi
LIST OF TABLES ... vii
INTRODUCTION ... 1
ABRIEF HISTORY OF ENCODING VARIABILITY AND THE SPACING EFFECT ... 3
THE CHUNKING HYPOTHESIS ... 6
The Chunking Hypothesis and Study-Phase Retrieval ... 8
The Chunking Hypothesis and The Chunking Process (P1 & P2 Memory) ... 11
THE CURRENT STUDY ... 17
EXPERIMENT 1 – THE ROLE OF STUDY-PHASE RETRIEVAL ... 17
METHODS ... 19
RESULTS ... 25
First Occurrence Detection Rates (Correct Rejection Rates) ... 25
Study-Phase Retrieval Accuracy (Hits – False Alarms) ... 26
EXPERIMENT 2 – OMITTING REPETITION DECISIONS ... 38
METHODS ... 40
RESULTS ... 42
GENERAL DISCUSSION ... 48
The Current Study ... 48
APPENDIX ... 62
LIST OF FIGURES
Figure 1. Hypothetical Data Pattern Supportive of an EV Hypothesis of the Spacing Effect ... 5
Figure 2. Analyses of P1 vs. P2 Recall Adapted from Thios & D’Agostino (1976) ... 12
Figure 3. Example Study-Phase Trial Sequence for Experiment 1 ... 22
Figure 4. Example Cued Recall Test Trial ... 24
Figure 5. Study-Phase Retrieval Accuracy for High-Confidence Ratings ... 30
Figure 6. Cued Recall OR Memory for Repeated Items ... 32
Figure 7. Chunking Levels by EV Type and Lag ... 34
Figure 8. Example Study-Phase Trial Sequence for Experiment 2 ... 41
Figure 9. Cued Recall OR Memory for Repeated Items ... 43
LIST OF TABLES
Table 1. First Occurrence Detection Rates During the Study Phase ... 26
Table 2. Study-Phase Retrieval Hit & False Alarm Rates ... 28
Table 3. Cued Recall OR Memory for 1P Items ... 31
Table 4. Cued Recall AND Memory ... 34
Table 5. Cued Recall OR Memory for 1P Items ... 43
INTRODUCTION
The repetition of information is generally found to benefit memory (Hintzman, 1976). However, information need not be repeated in the same manner (encoding constancy), it can be repeated in ways that encourage a different analysis—causing the learner to processes a different set of attributes about the stimulus. This is known as encoding variability. Encoding variability sometimes benefits memory more than encoding constancy. For example, Glenberg and Smith (1981, Exp. 1) found that an encoding variation of the orienting tasks used on words in a list-learning paradigm resulted in better memory for the words. On each trial, subjects were
recall than encoding constancy. There have also been instances in which encoding variability did not enhance performance in a transfer paradigm (Dempster, 1987, Exps. 2 – 5).
The inconsistency in encoding variability’s effects is all the more surprising when one recognizes it as a form of elaborative encoding. In general, memory improves as one adds features to an existing memory code. The amount of features that are processed at encoding is the amount of elaboration. Elaborative encoding is also thought to be the means by which deeper (i.e., more semantic) processing often results in better memory than shallow processing (Craik & Lockhart, 1972; Craik & Tulving, 1975; Klein & Saltz, 1976). Relative to shallow processing of the superficial features of a stimulus, deeper processing of semantics involves a more elaborate process that consequently appends more features to a memory code. In that sense, processing a stimulus in different ways (i.e., encoding variability) could be considered a form of elaborative encoding. Therefore, given that we know that elaborative encoding can enhance memory, it is all the more surprising that elaborations through encoding variability do not always enhance memory (especially considering that many encoding variations in the literature have been semantic in nature). Therefore, given that we know that the genus elaborative encoding usually enhances memory, it behooves us to understand why various species of encoding variability help in some cases but not in others.
Finally, note that, because encoding variability can enhance memory, this also means encoding constancy is not always the optimal approach. That is, an optimal learning scenario might require a judiciously constructed regimen of encoding constancy and variability.
In order to capitalize on the promise of encoding variability, we first need a basic theoretical understanding of the determinants of its effects so that we may more confidently predict when it will and will not enhance memory. Episodic list learning studies can reveal the effects of an encoding manipulation on the initial stages of memory formation. As it turns out, there is a wealth of such studies that can guide theory development of our understanding of the effects of encoding variability. However, most of these studies have focused on the auxiliary use of encoding variability as a potential explanation for other memory phenomena. To preview, no existing study adequately tests theories of encoding variability in and of itself. However, the current study contains experiments designed to test and develop such a theoretical foundation.
A Brief History of Encoding Variability and The Spacing Effect
Encoding variability is probably most well known for being invoked as an explanation for various memory phenomena. For example, repetitions that invite a different analysis of the information are thought to be more efficacious. In that sense, encoding variability is viewed as an underlying cause of the repetition effect (e.g., Craik & Lockhart, 1972). Traditionally, the spacing effect was attributed to a similar cause (e.g., Bower, 1972; Crowder, 1976). In studies of the spacing effect, items are repeated throughout a list at various intervals. The number of intervening items between the two presentations of a repeated item is referred to as the repetition lag. Items repeated successively are referred to as lag 0 items, meaning there are zero
& Tullis, 2010; Cepeda, Pashler, Vul, Wixted, & Rohrer, 2006; Hintzman, 1976). The memory advantage for spaced items (lag > 0) over massed items (lag = 0) is the spacing effect.
An encoding variability hypothesis of the spacing effect asserts that, as the presentations of a stimulus become spaced farther apart in time, they become less likely to invite the same analysis of the stimulus—despite the fact that the presentations are nominally identical. This change is thought to be due to drift in one’s mental and/or physical context that typically correlates with changes in time. Assuming that the mental or physical context affects the stimulus attributes attended to by the learner, then contextual drift should promote the encoding of a greater multitude of stimulus attributes (i.e., encoding variability) (Bower, 1972).
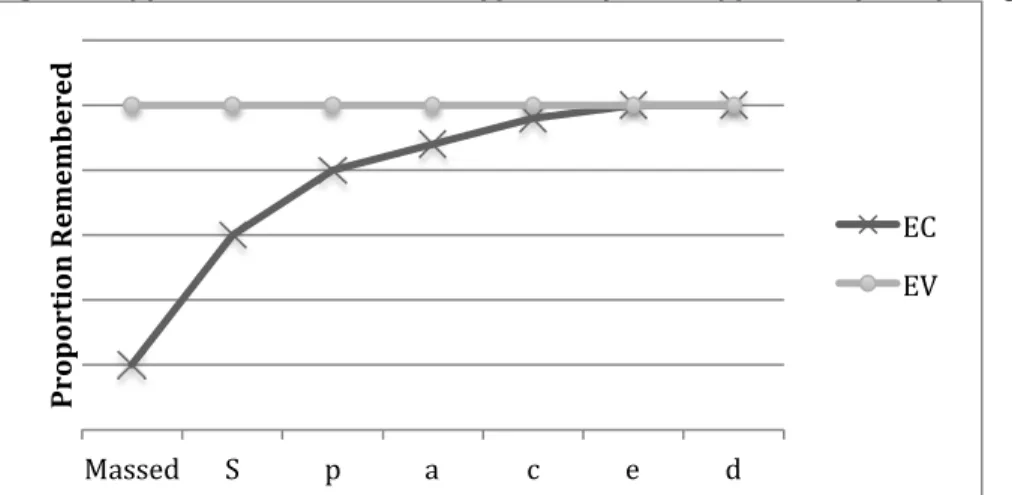
The encoding constancy (EC) curve in Figure 1 depicts a stylized profile of the typical effects of spacing on nominally identical repetitions of stimuli. The benefits of spacing increase most dramatically for shorter lags and then plateau at longer ones1. Moreover, if spacing
promotes contextual drift, which in turn promotes encoding variability, then circumventing the process via an overt manipulation of encoding variability should eliminate the spacing effect by lifting memory for all lags in the encoding variability (EV) condition up to the level of memory for the longer lag items in the EC condition. That is, experimentally inducing a change in encoding from presentation 1 to presentation 2 (P1 and P2, respectively) should result in memory
rivaling that normally produced under the longer lags of EC.
However, most tests of an encoding variability hypothesis of the spacing effect have failed to find the aforementioned data pattern depicted in Figure 1. Failures to produce this pattern have occurred regardless of whether the design overtly required a different analysis at P1
1
Several researchers have noted, however, that the tonicity (i.e., monotonic or non-monotonic) of the function relating recall to the repetition lag is also affected by the ratio of the repetition lag to the retention interval
and P2; such as changing orienting tasks (Bird, Nicholson, & Ringer, 1978, Exp. 1; Glenberg &
Smith, 1981, Exp. 1; Shaughnessy, 1976); inviting a different analysis of a target word via a change in the cue words paired with it (Madigan, 1969, Exp. 2); or changing the preceding list items of a target word at P1 and P2 (Johnson, Coots, & Flickinger, 1972; Maskarinec &
Thompson, 1976, Exp. 1).
Figure 1. Hypothetical Data Pattern Supportive of an EV Hypothesis of the Spacing Effect
Fig. 1 Notes: Data pattern that would be supportive of an encoding variability hypothesis of the spacing effect. EC = encoding constancy and EV = encoding variability. The massed bin refers to repetitions that were presented successively. The spaced bins refer to non-successive repetitions.
It is clear that support for an EV hypothesis of the spacing effect has been quite variable itself. A more appropriate stance might be to think of encoding variability as an important standalone factor in learning—but whose properties have thus far been poorly understood. It seems forlorn as an explanation of the spacing effect unless one restricts their discussion to a narrow range of spacing effects and encoding variability manipulations. Its failure as an
auxiliary explanatory tool has even led some to prematurely conclude that “encoding variability is an attractive theoretical concept but seems empty” (Roediger, Sanches, & Agarwal, 2011). Other research on EV suggests that its effects are moderated by spacing, and not vice versa. More importantly, the interaction between EV and repetition lag may be indicative of one of the determinants of the effects of EV.
Massed S p a c e d
Pr
opo
rti
on Rememb
er
ed
The Chunking Hypothesis
Episodic memory experiments often strive to strictly bifurcate periods of study and retrieval so that both acts of memory can be examined separately. This pursuit is problematic in experiments on repetition effects because retrieval is likely to take place during the study phase if someone recognizes that an item has been repeated (i.e., study-phase retrieval). Study-phase retrieval occurs when a repeated stimulus is recognized as a repetition. Interestingly, research on the spacing effect has found that study-phase retrieval declines with spacing (Thios &
D’Agostino, 1976; Johnston & Uhl, 1976, Exp. 2). This factor may also be important to
spacing function (D’Agostino & DeRemer, 1973, Exp. 2; Dellarosa & Bourne, 1985, Exp. 2; Madigan, 1969, Exp.2; Paivio, 1974, Exp. 2; Shaughnessy, Zimmerman, & Underwood, 1974; Verkoeijen et al., 2004). Sometimes EV can also interact with spacing in such a way that memory gets progressively worse with spacing (Thios, 1972; Bellezza & Young, 1989, Exp. 3). To account for this interaction between EV and spacing, Bellezza and Young proposed the chunking hypothesis (Young & Bellezza, 1982; Bellezza & Young, 1989).
The basic dynamics of the chunking hypothesis are relatively simple. The central tenets of this hypothesis are that the effect of encoding variability on memory is a function of two things: 1) the degree to which subsequent presentations of an item cue retrieval of prior
presentations and 2) whether or not the newly sampled information gets integrated with that from previous traces, or instead forms an entirely different code within which new traces will be bundled.
Bellezza and Young’s hypothesis places an immense amount of stock in the importance of study-phase retrieval. Other theorists had already noted that repetitions of an item that fail to be recognized as such show little-to-no benefit of spacing (Hintzman et al., 1975; Johnston & Uhl, 1976, Exp. 2; Melton, 1967; Thios & D’Agostino, 1976). Bellezza and Young believed that encoding variability was a potentially strong moderator of the likelihood of study-phase retrieval. If one assumes that the likelihood of P2 cuing retrieval of P1 is a function of the similarity of their
1982). Nonetheless, the effect of EV on study-phase retrieval can have a tremendous bearing on the second aspect of Bellezza and Young’s hypothesis, the actual chunking process.
One major way by which Bellezza and Young’s hypothesis accounts for positive, negative, and null effects of encoding variability is through a chunking process. If one’s
encoding experience during a repetition of a nominal stimulus has a sufficient amount of overlap with previous experiences, then the components sampled during the most recent experience can be retrieved and integrated (i.e., chunked) with the code in which previous experiences were bundled. This results in a richer memory code (i.e., a positive effect of encoding variability). If, however, the current encoding experience results in a failure to retrieve previous ones, then a new code is formed. Instead of one enriched code, this results in two relatively impoverished codes (i.e., a negative encoding variability effect). Note, however, that the dynamics of this chunking process require that the effects of repetitions are optimal when encoding is actually a balance between similarities and differences in processing. That is, there should in theory exist an optimal encoding regimen that consists of encoding variability.
The Chunking Hypothesis and Study-Phase Retrieval
was higher in the EV condition. Conversely, recall of the spaced, lag 60 items was higher in the EC condition. Bellezza and Young’s (1989) third experiment used a larger number of repetition lags and found a qualitatively similar interaction between encoding condition and repetition lag. More importantly, these recall results are consistent with the predictions of the chunking
hypothesis. That is, study-phase retrieval and chunking should be easiest for massed items, therefore ensuring a memory advantage for massed EV items. However, study-phase retrieval and chunking should become less likely as the effects of temporal distance are compounded by the effects of associative distance. Thus resulting in a diminishing and eventual reversal of the EV advantage as repetition lag increases.
There exist other studies demonstrating that the effects of EV interact with spacing—and these interactions were at least attributed to alleged differences in study-phase retrieval (Greene & Stillwell, 1995; Verkoeijen et al., 2004)2. However, some of the explicit core predictions of the chunking hypothesis and other ones implied by it remain untested. Most importantly, if the hypothesis is correct then, as the lag increases, study-phase retrieval should decline more rapidly under EV. In addition, given that study-phase retrieval is affected by temporal and associative distance, the deviance of the encoding variation should affect the threshold lag at which EV results in worse memory than EC. For example, if a drastic variation in encoding results in very different experiences at P1 and P2, then the cuing potential of P2 should be weakened, compared
to a moderate variation between P1 and P2. Therefore the chunking hypothesis implies that the
threshold lag for a negative effect of EV on memory should shorten as the encoding variation
2
becomes more deviant. Thus far, the effects of EV on study-phase retrieval and the above interaction between spacing and EV deviance remain untested.
One can also extend aspects of the hypothesis to predict that, for massed repetitions, even the largest deviations in encoding of a nominal stimulus should result in better memory than EC. Study-phase retrieval is essentially guaranteed for successive presentations. Thus, any variation in encoding will result in the sampling and chunking of new components into an older code. Another implication of the chunking hypothesis is that, given two EV manipulations, the more deviant one should result in a greater amount of chunked components under massed repetitions. To preview, the current study can test this implication because it will implement two EV
manipulations that differ in deviance.
In sum, although the chunking hypothesis itself does not use relative standing on conventional dependent measures as a litmus test for the number of codes, there could exist a temptation in empirical analyses to apply a post-hoc account about the number of codes. Therefore caution should be observed when interpreting the data in terms of a chunking
hypothesis. One’s conclusions should not only be guided by relative standings on conventional dependent measures, but also by reasoning about the manipulations themselves. There may, however, be some alternative analyses of memory performance that could shed light on the number of codes created by various manipulations of EV. Such analyses could help provide a more revealing test of the chunking hypothesis.
The Chunking Hypothesis and The Chunking Process (P1 & P2 Memory)
If there is in fact a chunking process driving part of the interaction between EV and spacing, then one should be able to find evidence that 1) information from P1 and P2 is being
chunked; 2)the amount of chunked information interacts with study-phase retrieval; and 3) that changes in chunking are modulated by spacing and the deviance of the encoding variation. As of now, the requisite data needed to evaluate these notions do not exist.
Evidence of EV mediating the probability of an actual chunking process has been scarce. To support the existence of such a process, one would need to demonstrate that information from both P1 and P2 has been bound into a composite memory code. Most studies of EV report only
the conventional dependent measures of memory (e.g., accuracy and proportion correct). Furthermore, the overwhelming majority of studies using these measures restricted them to information shared by both presentations (e.g., recall of a target word associated with different cues at P1 and P2). To determine if EV does affect a chunking process, one must be in a position
that these pieces of information have become bound. Tests for such evidence have been scarce but, nonetheless, there is at least combined evidence from a few studies showing that the effects of EV on memory are driven by a chunking process whose likelihood changes with lag. These studies are reviewed below so that their results can be used to guide predictions for the current study.
Indirect evidence has been reported by Thios and D’Agostino (1976) in a re-analysis of data from D’Agostino and DeRemer (1973, Exp. 2). This re-analysis at least showed that the retention of P1 and P2 info is affected by spacing. In the sole EV condition of D’Agostino and
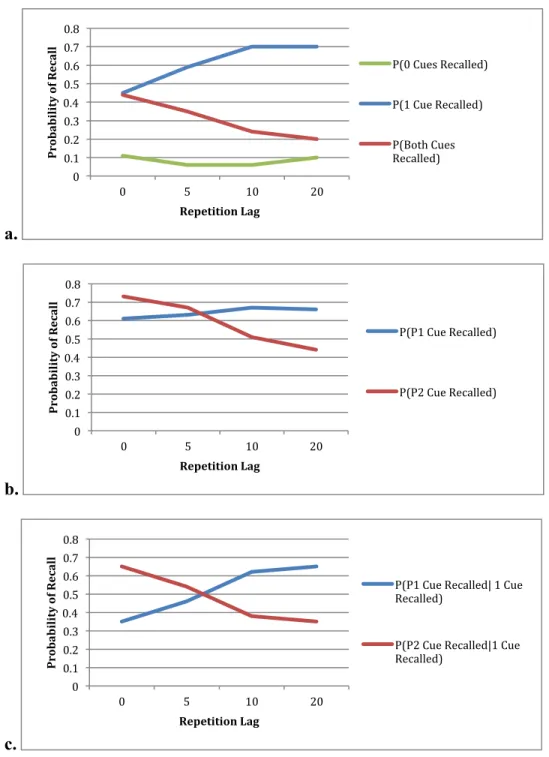
DeRemer (1973, Exp. 2), object phrases were repeated in 2 different sentence frames depicting different actions being performed on the object (e.g., “The plane hit the flag pole.” and “The bear climbed the flag pole.”). The sentences were given massed presentations (lag 0) or spaced presentations at lags of 5, 10, or 20 sentences. After encoding, subjects freely recalled as many object phrases as they could. Upon completion, they then wrote any sentence frames they could remember next to their corresponding object phrases. Note that each sentence frame counts as a detail unique to each presentation. The re-analysis of these data by Thios and D’Agostino (1976) plotted various aspects of memory for P1 and P2 information and how they changed with spacing.
For the sake of brevity, the sentence frames from P1 and P2 are referred to as cues and the object
phrases as targets. An adaptation of their re-analysis is presented below in Figure 2.
a.
b.
c.
Fig. 2Notes: A re-analysis of recall data from D’Agostino and DeRemer (1973, Exp. 2) reported in Thios and D’Agostino (1976). Each figure depicts different probability indices of recalling cues as a function of lag, given that the corresponding target was recalled. a. Probabilities of recalling 0, 1, or 2 cues as a function of lag. b.
Probabilities of recalling P1 or P2 as a function of lag. c. Probabilities of recalling P1 or P2 as a function of lag given
that at least 1 cue was recalled.
Several patterns from these figures suggest that the likelihood of chunking diminishes with spacing. In Figure 2a one can see that the probability of recalling both cues declines with
0 0.1 0.2 0.3 0.4 0.5 0.6 0.7 0.8
0 5 10 20
Pr ob ab ili ty o f Recall Repetition Lag
P(0 Cues Recalled)
P(1 Cue Recalled)
P(Both Cues Recalled) 0 0.1 0.2 0.3 0.4 0.5 0.6 0.7 0.8
0 5 10 20
Pr ob ab ili ty o f Recall Repetition Lag
P(P1 Cue Recalled)
P(P2 Cue Recalled)
0 0.1 0.2 0.3 0.4 0.5 0.6 0.7 0.8
0 5 10 20
Pr ob ab ili ty o f Recall Repetition Lag
P(P1 Cue Recalled| 1 Cue Recalled)
spacing whereas the probability of recalling only one cue increases. At least one part of the change appears to be driven by a tradeoff enhancement of P1 info with spacing. Note that in
Figure 2b the probability of recalling P1 increases with spacing whereas the probability of
recalling P2 shows a concomitant decrease. A similar pattern is shown in Figure 2c using a more
equitable comparison where P1 and P2 recall were conditionalized on the probability of recalling
at least one cue in response to a target.
The decline in recall of both cues with spacing provides suggestive support of a chunking process that interacts with the effects of spacing. However, another pattern in the data suggests that an addendum may be needed to the chunking hypothesis. Namely, the opposite trajectories of P1 and P2 recall hint at another mechanism that might be driving down P1—P2 binding.
Several theorists have suggested and/or shown that the locus of the effect of spacing on memory is primarily the enhancement of P1 information (Benjamin & Tullis, 2010; Braun & Rubin, 1998;
Hintzman, 2004; Thios & D’Agostino, 1976). As the repetition lag increases, study-phase retrieval becomes more difficult. When retrieval succeeds at these longer lags, the mnemonic effects are thought to be greater than those for items at shorter lags. Insofar as difficult retrieval is more mnemonically potent than easy retrieval, then, holding retrieval success constant, memory should be better following more difficult retrieval attempts. This is akin to a testing effect being greater for more difficult but successful retrieval attempts (Carpenter & DeLosh, 2006). Therefore, longer lags disproportionately benefit memory for P1 details because the
mnemonic potency of retrieving P1 increases with lag—but only up to a point (for a simulation,
see Benjamin & Tullis, 2010)3. However, one might intuit that, because P
2 trials occur closer to
the memory test, P2 details should be easier to retrieve. Contrary to this intuition, it would
appear that the retrieval practice effect on P1 details results in memory that eclipses the “recency
effect” for P2 details. This apparent tradeoff between P1 recall and P1—P2 binding may be a
function of time-in-working-memory spent retrieving P1; furthermore, this tradeoff may be
driven by spacing (Braun & Rubin, 1998). That is, as more time is spent retrieving P1 details,
less time is allotted for chunking P1 and P2 details. Thus, holding trial length constant, it is
possible that chunking success is inversely related to P1 retrieval time. If so, the chunking
hypothesis may require an addendum to its purported mechanisms.
Regardless of the source of the lag-related decline in recalling P1 and P2 together, several
issues more central to the current proposal remain unresolved by the re-analysis reported in Thios and D’Agostino (1976). For one, it did not compare encoding variations of different deviances. Such a comparison is key to testing the predictions of the chunking hypothesis given that it assumes that P1—P2 similarity modulates the probability of study-phase retrieval. In
addition, it still remains unclear if P1 and P2 details are ever actually chunked into one code.
Thios and D’Agostino (1976) provided no resolution to this issue because they did not determine whether or not P1 and P2 details were dependent on one another; nor did they determine whether
or not such dependence interacted with lag and study-phase retrieval.
recall test. All cues were shown on the test and subjects were instructed that they might have to respond with some of the same targets twice.
One analysis of the cued recall data revealed some interesting patterns relevant to the current proposal. This analysis consisted of determining P1—P2 dependence by comparing the
probabilities of various cued recall outcomes. The conditional probability of recalling a target in response to one cue—given that the target was also recalled in response to the other cue—was compared to the base rate probability of recalling the target in response to one cue. In other words, P(Recall to 2nd Cue|Recall to 1st Cue) was compared to P(Recall to 2nd Cue) to determine if they were different or equal. If the former is greater than the latter, then the two cues (i.e., P1
and P2 details) are dependent upon one another. However, if the cues confer no benefits to each
other and are therefore independent, then the two probabilities should be statistically equal. In other words, if the first proportion is significantly than the second, then that means chunking occurred. If they are equal, then it means there is no evidence of chunking. Slamecka and Barlow’s analysis showed that, in the Same meaning condition, the effects of both cues showed dependence. However, such evidence was not found for the Different meaning condition. This suggests that, at least at the level of the information used for a retrieval cue, the deviance of the encoding variation can affect the dependence (i.e., chunking) of P1 and P2 information. Also
possible to tell if, as predicted by the chunking hypothesis, the effect of EV deviance on
chunking (i.e., P1—P2 dependence) interacts with spacing and presumably study-phase retrieval.
The Current Study
The representative literature reviewed in the introduction shows that research seeking to understand EV in and of itself is sparse. This is evidenced by the large literature testing it as a potential explanation of the spacing effect. Insight may still be gained from the literature on EV and the spacing effect because a survey of said literature also shows that the effect of EV often depends on the repetition lag. The chunking hypothesis (Young & Bellezza, 1982; Bellezza & Young, 1989) was proposed as a set of mechanisms to help explain the dynamics of EV and spacing. However, the most explicit prediction of the chunking hypothesis, that EV and spacing modulate the probability of study-phase retrieval, remains untested. Furthermore, other
predictions of the chunking hypothesis remain untested: primarily that the deviance of the encoding variation should interact with the effect of spacing on study-phase retrieval. Another concern is that there exists little proof that EV can result in the chunking of information. Alternative analyses of memory for P1 and P2 details should be employed to test for evidence of
this. Furthermore, it remains to be determined if such evidence of chunking interacts with study-phase retrieval—which is presumably affected by spacing and the deviance of the encoding variation.
Experiment 1 – The Role of Study-Phase Retrieval
presented in either the exact same semantic context or a variation of it that 1) preserved the same meaning or 2) changed to a completely different one. We then tested their memory with a cued recall test specially constructed to examine the effects of encoding variability on chunking.
Piloting. We employed homonyms as our target words. These are words that can take on two or more different meanings but have the same pronunciation and spelling for all meanings. The inherent qualities of these stimuli ensured that our targets had identical perceptual
characteristics across meanings. Our first approach to inducing the intended semantic context of a target word was to pair it with a semantically related cue word of the intended meaning (i.e., purple – maroon vs. island – maroon). After constructing the required number of paired associates (226 to be exact), we piloted our materials in the full version of our paradigm. To ensure that participants were encoding the target words in the intended semantic context, we asked them to form a sentence combining the two words and to state this sentence out loud. To our surprise, we found that they did not always make a sentence using the intended meaning of the target (e.g., for example, for the pair island – maroon one participant said “While vacationing on the island, I got so sunburned that I looked maroon.”). Moreover, these problems cropped up most frequently for the less dominant meaning of a target word. In the previous example, the island-related meaning of maroon is the less dominant of the two. This kind of problem undermined our ability to induce the intended semantic context and also imposed a confound because it disproportionately affected the less dominant meanings of target words.
Given these limitations, we abandoned the use of paired associates. They were
similar approach (for a few examples, see Bobrow, 1970; D’Agostino & DeRemer, 1973; Dellarosa & Bourne, 1985, DeRemer & D’Agostino, 1974; Jacoby, 1972; Postman & Knecht, 1983, Exps. 1 & 2; Thios, 1972). To make use of the many paired associates we constructed, we incorporated both the cue and target words in the sentences we constructed. Thus, we created 4 unique sentences for each target word (2 for each meaning) and 1 unique sentence for each of the 10 primacy words—resulting in a grand total of 226 sentences. The experiments described hereafter employed these sentences as our way of controlling the semantic context. The basic attributes of our materials are described in brief in the methods for Experiment 1. In-depth descriptions are provided in the Appendix.
METHODS Participants.
Seventy-two introduction to psychology students participated in exchange for course credit. All reported being between the ages of 18-30, having native or native-level fluency in English, and no disorders that would prevent them from reading aloud for several minutes at a time. Six subjects had to be replaced because they appeared to have excessive difficulties following the instructions and/or performing the encoding task (4 in the Similar condition and 2 in the Different condition). This was evidenced by the fact that the number of study-phase trials on which they failed to provide a repetition judgment was more than 2 standard deviations above the mean (the resulting cut-off was 5 or more omissions). Thus, our final sample, including the replacements, is based on 72 subjects who omitted responses on fewer than 5 study-phase trials. Design.
within-intervening items. Presentation frequency was manipulated within-subjects. All subjects experienced items that were presented once (1P) or twice (2P). Within the 2P items, we manipulated the repetition type: encoding constancy (EC) or encoding variability (EV). All subjects had an EC and EV condition. The type of EV, however, was manipulated between-groups. One group experienced encoding variations within the same meaning (the Similar group) and the other group experienced encoding variations between different meanings (the Different group). The pool of useable homonyms for this experiment was limited, so this design feature allowed us to have more target words per subject in all conditions than would be possible if EV type were also manipulated within-subjects.
Materials.
Target Words. The target words were homonyms, words that take on two or more different meanings but have the same pronunciation and spelling for all meanings. The inherent qualities of these stimuli ensured that our targets had identical perceptual characteristics across meanings. Our experimental design required a total of 64 target words. Fifty-six were drawn from the English homonym norms of Armstrong, Tokowicz, and Plaut (2012). The remaining 8 were taken from the materials used by Slamecka and Barlow (1979). The lexical attributes of the targets are described in the Appendix.
word. After multiple waves of free association piloting, we were able to reduce the correct guessing rate for our bank of sentences to an average of 12%.
Counterbalancing Scheme. Ten targets and their respective sentences were used as primacy items that remained constant for all subjects. The remaining 54 targets were divided up into 3, 18-item sub-lists to facilitate counterbalancing. These 54 targets were counterbalanced across lag, repetition type (EC or EV), and EV type (Similar or Different). The rest of the counterbalancing scheme, and the creation of the study-phase lists, are described at length in the Appendix.
Procedures.
After obtaining informed consent, participants were instructed on the procedures of the first phase, the encoding phase. (However, note that they were not alerted to the fact that a memory test followed this phase). They were told that they would be shown sentences one at a time. They were assured that the sentences were grammatically correct and meaningful, but that they would not link together coherently like the sentences of a story or book. Therefore, they would seem out of context, like excerpts from a story or book. The level of a detail would also vary from sentence to sentence and some of the sentences would be repeated. We gave
participants these forewarnings to mitigate any confusion that might arise from reading many unrelated sentences.
They were then told that their two tasks for this experiment were to 1) read the sentence and then 2) make a repetition judgment about one of the words in the sentence. When they read the sentence, they were required to read it aloud and try to comprehend it as quickly and
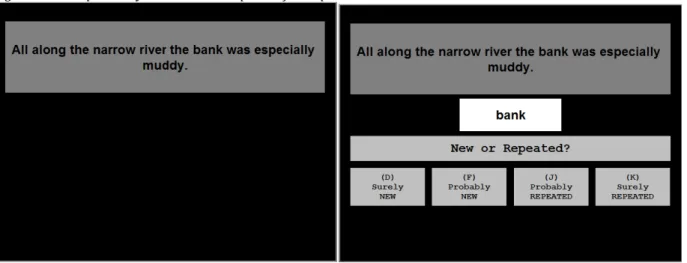
they would have 7.5 sec to read each sentence. Afterwards, the computer would select one word from the sentence and they would have to decide whether or not they had seen it before in the experiment. (They were told that the computer randomly selected the word but, unbeknownst to them, the word in question was always one of the aforementioned target words). If they had not seen the word before in the experiment, they were to call it “new”. If they had seen it before anywhere in the experiment, they were to call it “repeated.” Along with their judgment, they had to rate the confidence as “surely” or just “probably.” They were informed that they had 3.5 sec to make this judgment for a given word. These instructions were provided alongside an example trial sequence shown in Figure 3. They key mappings were explained to the participants and they were reassured the key mappings would be shown on every trial. They were also reminded to make their repetition decision as quickly and accurately as possible during the 3.5 sec allotted for it. They were also told that the end of each trial would be signaled with a .5 sec crosshair, after which the next sentence would appear. Any remaining questions were answered and then the participant proceeded to the encoding phase. They were not told of the total length of the encoding phase nor were they made aware of the memory test following it.
Figure 3. Example Study-Phase Trial Sequence for Experiment 1
Fig. 3 Notes: Depicted above is the example of a study-phase trial shown to all participants before the experiment began. After the repetition judgment portion of a trial, a crosshair appeared in the middle of the screen for 500 msec (not depicted).
Cued Recall Phase Materials.
Test List Construction. In order to compute a chunking index, all target words in a subject’s respective EV condition had to be tested twice. In case this testing process had any idiosyncratic effects on memory, the target words in all other conditions were tested twice as well. Targets in the 1P and EC conditions were necessarily tested using the same sentence frame twice. Targets in the EV condition were tested using the P1 sentence frame and P2 sentence
frame once each. The participants were not alerted to these specifics. Also unbeknownst to the participants, the test was structured in three waves. These waves corresponded to the original order of the three waves from the encoding phase (described in the Appendix). We did this to approximately equate the retention intervals among the experimental conditions because the retention interval can modulate the effects of spacing (Glenberg, 1976; Cepeda et al., 2006). However, the sentences were not tested in their exact original serial positions. Instead we pseudo-randomized the within-wave test trial order with the constraint that any two test trials over the same target had to occur at least three or more trials apart.
Procedures.
every sentence. The participants were made aware of this and they were also told that sometimes the correct word they needed to recall might not always fit within the blank. They were allotted 7.5 sec for each trial. After which, a crosshair appeared for .5 sec and then the computer
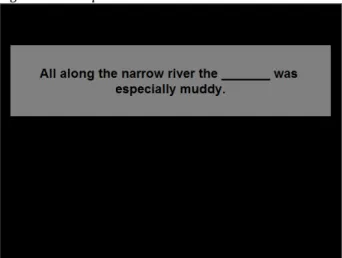
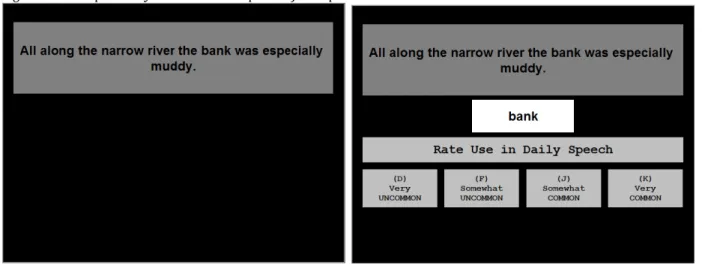
automatically advanced to the next trial. After these instructions, participants were given an example of a cued recall trial (shown in Figure 4) with the sentence used in the beginning “All along the narrow river the _______ was especially muddy.” They were then reminded that the correct word was bank.
After these instructions, the participants did a practice phase of 6 trials of items from the primacy buffer. The practice trials and their order were the same for every participant. After this practice phase, any remaining questions were answered and then the participant proceeded to the full test. The experimenter wrote down all of their responses to reduce the response demands on the participants. No feedback was given during the test. After the test, participants were debriefed.
Figure 4. Example Cued Recall Test Trial
Sentence frame for 7.5 sec
RESULTS Study-Phase Data
To determine study-phase retrieval accuracy, we treated the repetition judgment data as a recognition memory task and conducted the appropriate analyses. Correctly identified
repetitions were coded as hits. Correct identifications of the first presentation of a repeated word or the only presentation of a 1P word were both coded as correct rejections. Incorrectly
classifying either kind of trial as repeated item was coded as a false alarm. Finally, incorrectly classifying a repeated item as new was coded as a miss. Trials for which participants failed to respond were excluded from all analyses. When necessary, degrees of freedom were corrected for violations of sphericity.
First Occurrence Detection Rates (Correct Rejection Rates)
Our first analysis of the study-phase retrieval data examined the extent to which our participants could accurately detect the first occurrence of a repeated word or the only
occurrence of a 1P word during the study phase. As such, we analyzed the correct rejection rates for both groups. Recall that we also collected confidence ratings during encoding. Thus they were included as a factor as well. We conducted a 2 x 2 (Group: Similar or Different by
Confidence: Low or High). There was a significant main effect of group, F(1, 70) = 11.67, MSE = .14, p = .001, ηp2 = .14. Correct rejection rates were higher in the Similar group than the
Different group. There was also a significant main effect of confidence level, F(1,70) = 39.12, MSE = 2.83, p < .001, ηp2 = .36. Correct rejection rates were higher for high-confidence ratings
than low-confidence ones. However, these two main effects were qualified by a significant interaction, F(1,70) = 5.75, MSE = .42, p = .019, ηp2 = .08. Probing the interaction revealed that
that, among high-confidence ratings, correct rejection rates were higher in the Similar group than the Different group, t(70) = 2.92, p = .005. A summary of the results is shown in Table 1.
Table 1. First Occurrence Detection Rates During the Study Phase EV Type Low-Confidence High-Confidence
Similar .23 (.16) .62 (.25) Different .27 (.14) .45 (.25)
Table 1 Notes: means and standard deviations (in parentheses).
Two conclusions can be gathered from these data. First, the overall higher correct rejection rates among the high-confidence ratings suggests that the confidence ratings were used with a degree of metacognitive accuracy. That is, when our participants reported being highly confident that a given word has appeared only once thus far in the experiment, they were indeed more accurate than when the same judgment was made with low confidence. This result shows that the confidence ratings had some utility. Secondly, the interaction between group and confidence level demonstrates that any differences between the encoding conditions might be restricted to higher levels of confidence. Perhaps because performance at higher confidence levels is based on a greater level of memorial information that is further from the decision
boundary between repeated vs. new. Consequently, the results of the high-confidence data might simply be less contaminated by noisier inputs. This is an issue we will revisit in the following section on study-phase retrieval accuracy.
Study-Phase Retrieval Accuracy (Hits – False Alarms)
The next set of analyses evaluated our hypotheses about the effects of lag and associative distance on study-phase retrieval. To assess study-phase retrieval accuracy, we did an analysis of recognition memory accuracy for repeated words. Our measure of accuracy was hits
first conducted a 2 x 2 x 3 x 2 (Group: Similar or Different by Repetition Type: EC or EV by Lag: 0, 6, or 18 by Confidence: Low or High) ANOVA. We first evaluated the effect of confidence to determine if separate analyses should be conducted for each confidence level. Recall that, in the analysis of correct rejection rates, the pattern of results depended on confidence. Any similar effect of confidence in the current analysis would warrant separate analyses for each confidence level. Moreover, any interaction between confidence and another variable would certainly warrant separate analyses.
Preliminary Analysis Including Both Confidence Levels. There was a very large main effect of confidence, F(1,70) = 2,159.64, MSE = 192.20, p < .001 , ηp2 = .969. Study-phase
retrieval accuracy was overall higher for high-confidence ratings than low-confidence ones. Once again demonstrating that our participants used the confidence ratings with a degree of metacognitive accuracy. More importantly, the effect of confidence emerged in 3 interactions. There were two-way interactions between confidence and repetition type [F(1,70) = 30.32, MSE = .75, p < .001, ηp2 = .30] and confidence and lag, F(2,140) = 28.30, MSE = .46, p < .001, ηp2 =
.29. There was also a 3-way interaction between confidence, repetition type, and lag, F(2,140) = 17.86, MSE = .22, p < .001, ηp2 = .20. This 3-way interaction alone mandates a partitioned
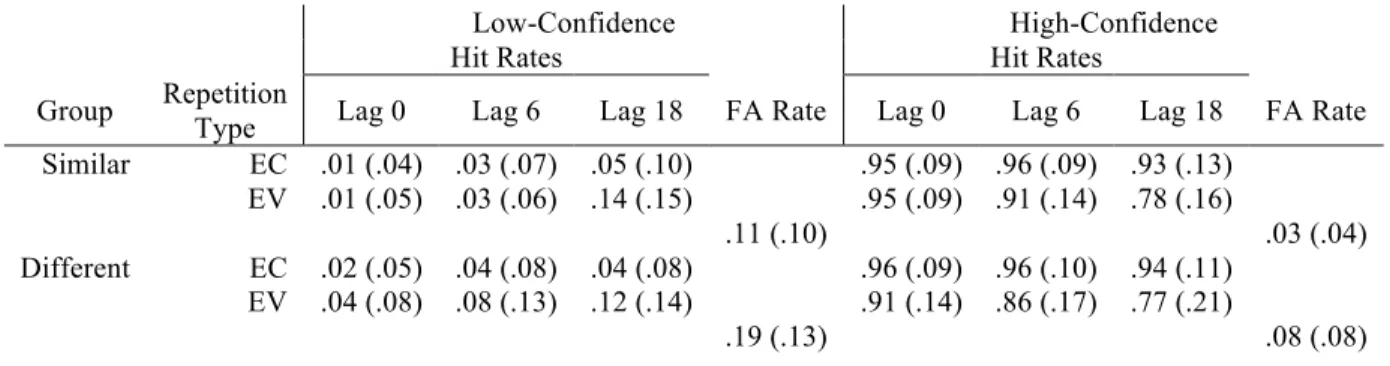
Table 2. Study-Phase Retrieval Hit & False Alarm Rates
Low-Confidence High-Confidence
Hit Rates Hit Rates
Group Repetition
Type Lag 0 Lag 6 Lag 18 FA Rate Lag 0 Lag 6 Lag 18 FA Rate Similar EC .01 (.04) .03 (.07) .05 (.10) .95 (.09) .96 (.09) .93 (.13)
EV .01 (.05) .03 (.06) .14 (.15) .95 (.09) .91 (.14) .78 (.16)
.11 (.10) .03 (.04)
Different EC .02 (.05) .04 (.08) .04 (.08) .96 (.09) .96 (.10) .94 (.11) EV .04 (.08) .08 (.13) .12 (.14) .91 (.14) .86 (.17) .77 (.21)
.19 (.13) .08 (.08)
Table 2 Notes: EC = encoding constancy, EV = encoding variability. FA = false alarm. Cell values are means and standard deviations (in parentheses).
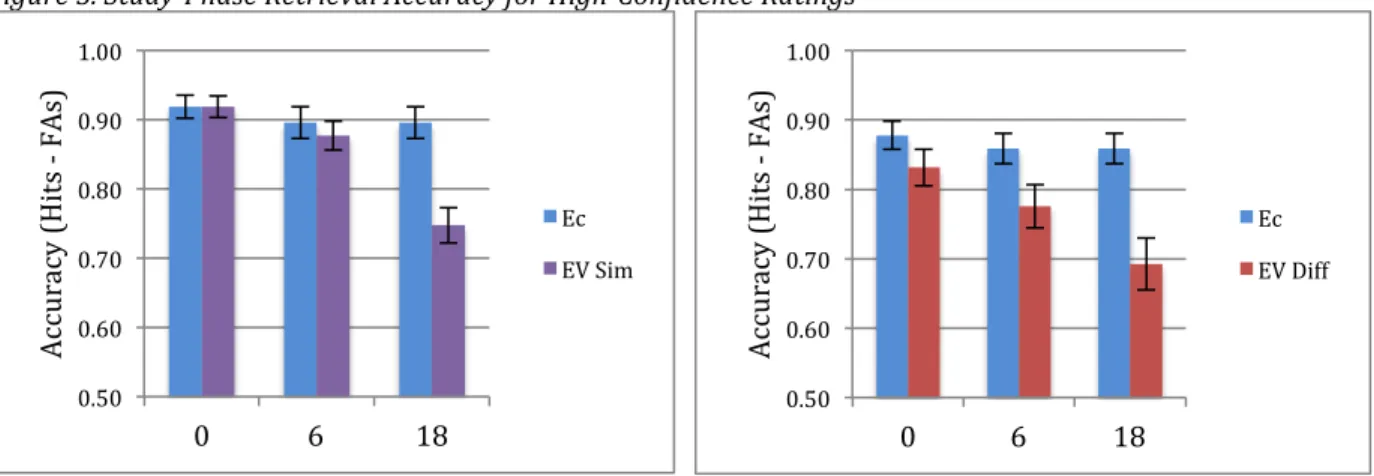
High-Confidence Responses Only. The next analysis was restricted to high-confidence responses and entailed a 2 x 2 x 3 (Repetition Type: EC or EV by Group: Similar or Different by Lag: 0, 6, or 18) ANOVA. The main effect of lag was significant, F(2,140) = 24.88, MSE = .28, p < .001, ηp2 = .26. Only the linear contrast of this main effect emerged as significant, F(1,70) =
45.70, MSE = .56, p < .001, ηp2 = .40. This indicates that, overall, study-phase retrieval accuracy
decreased proportionately with lag. The main effect of repetition type was also significant, F(1,70) = 29.80, MSE = .64, p < .001, ηp2 = .30. Study-phase retrieval accuracy was overall
higher for items in the EC condition than EV conditions. The main effect of group was also significant, F(1,70) = 5.97, MSE = .39, p = .017, ηp2 = .08. Of the two groups, study-phase
retrieval accuracy was overall higher in the Similar group than the Different one. There was also a significant interaction between lag and repetition type, F(2,140) = 18.49, MSE = .18, p < .001,
ηp2 = .21.
= .01, p = .139. There was, however, a significant, linear effect of lag for EV repetitions, F(1,71) = 64.48, MSE = .87, p < .001, ηp2 = .48. This indicates that, for EV repetitions, study-phase
retrieval accuracy decreased with lag. Finally, we also evaluated the second component to the lag by repetition type interaction: the lag-by-lag differences between EC and EV repetitions. We did this by calculating the confidence intervals of the differences between the EC and EV
conditions at each lag. At lag 0, the confidence interval of the EC-EV difference was (-.01 to .06). At lag 6, the confidence interval of the difference was (.01 to .09). At lag 18, the confidence interval of the difference was (.12 to .20). The confidence interval at lag 0
encompasses 0, thus indicating no difference between EC and EV at that lag. The interval at lag 6 did not encompass 0, indicating significantly higher accuracy in the EC condition at that lag. The same was true for lag 18. In addition, the confidence intervals of the differences for lags 6 and 18 do not overlap, indicating that the EC-EV difference at lag 18 was significantly different from that of lag 6. Finally, none of the remaining interactions were significant. The interaction between repetition type and group was non-significant, F(1,70) = 2.34, MSE = .05, p = .131. For all other interactions, F was < 1.
Figure 5. Study-Phase Retrieval Accuracy for High-Confidence Ratings
Fig. 5 Notes: Error bars indicate +/- 1 standard error of the mean. EC = encoding constancy, EV = encoding variability. FAs = False Alarms.
Cued Recall Data
Cued Recall OR Memory. Our first set of analyses of the cued recall data focused on memory for the target word. As such, we analyzed cued recall OR memory (Ross & Landauer, 1978). This was the probability that the correct target word was recalled in response to either the P1 or the P2 sentence frame. This metric allowed for an equitable and sensitive comparison of
target word memory across all conditions.
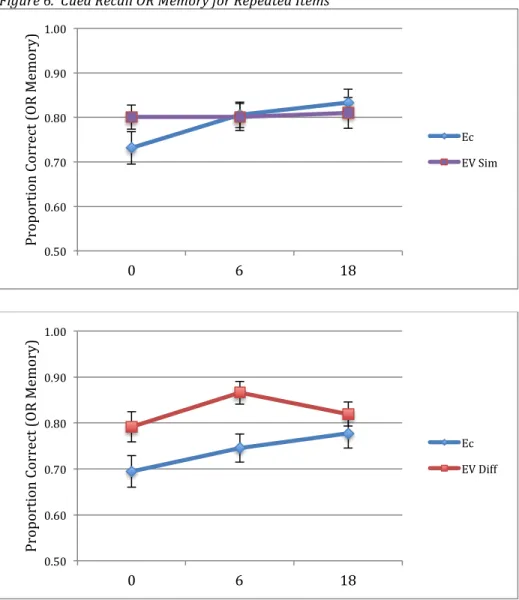
We first compared OR memory for 1P words between those assigned to the Similar and Different groups. Note that memory for the 1P (and EC) targets was in fact tested twice; thus permitting an OR memory analysis of them. We found no significant difference in 1P OR memory between the groups, t(70) = .95, p = .347. These results are displayed in Table 3. Next we analyzed OR memory for the repeated items using a 2 x 2 x 3 (Repetition Type: EC vs. EV by Group: Similar vs. Different by Lag: 0, 6, or 18) ANOVA. There was a significant main effect of repetition type, F(1,70) = 11.68, MSE = .27, p = .001, ηp2 = .14. Overall, OR memory
0.50 0.60 0.70 0.80 0.90 1.00
0 6 18
Ac cu ra cy ( H it s - F As ) Ec EV Sim 0.50 0.60 0.70 0.80 0.90 1.00
0 6 18
was higher for EV items than EC ones. There was no main effect of group, F < 1. There was a significant main effect of lag, F(2,140) = 5.44, MSE = .13, p = .005, ηp2 = .07. A test of the least
significant difference revealed that, overall, OR memory for lag 0 zero items was significantly lower than OR memory for lag 6 items (SE= .02, p = .007) or lag 18 items (SE= .02, p = .007). The latter two, however, did not significantly differ (SE= .02, p = .746). Note, however, that the main effect of lag seems to be mostly driven by a spacing effect in 3 out of 4 repetition
conditions; the EC conditions of both groups and the EV condition of the Different group. This might explain why the interaction between repetition type and lag approached but did not
achieve conventional significance levels, F(2,140) = 2.20, MSE = .05, p = .115. However, we do have an a priori motivation to test for an EV > EC difference at lag 0. When collapsing across both EV types, we did find a significant EV > EC difference at lag 0, t(71) = 3.14, p = .002.
Next, there was a significant interaction between repetition type and group, F(1,70) = 6.11, MSE = .14, p = .016, ηp2 = .02. A follow-up analysis splitting the data by group revealed
that there was an effect of repetition type for the Different group [F(1,35) = 15.49, MSE = .40, p < .001, ηp2 = .31], but not the Similar group, F < 1. Thus, there was statistically an overall EV >
EC difference in the Different group, but not the similar group. Finally, neither of the remaining interactions were significant (both F’s < 1). The results of the cued recall OR memory analysis are displayed in Figure 6.
Table 3. Cued Recall OR Memory for 1P Items
Similar Group Different Group 1P OR Memory .64 (.16) .60 (.15)
Figure 6. Cued Recall OR Memory for Repeated Items
Fig. 6 Notes: Error bars indicate +/- 1 standard error of the mean. Lag is plotted along the x-axis. EC = encoding constancy, EV Sim = encoding variability in the Similar condition, EV Diff = encoding variability in the Different condition.
Chunking Rates. The next set of analyses examined the extent to which lag and
associative distance affected the chunking of information across presentations of a target word. To estimate the amount of chunking for both EV types at each lag, we calculated a chunking index (proposed by Bellezza & Young, 1989, Exp. 3). This index had two inputs: 1) a measure
0.50 0.60 0.70 0.80 0.90 1.00
0 6 18
Pr op or ti on C or re ct ( O R M emo ry ) Ec EV Sim 0.50 0.60 0.70 0.80 0.90 1.00
0 6 18
of information recalled from both presentations of a target word and 2) an estimate of the baseline recall rate that would be expected if recall were based on two independent memory traces. The measure of information recalled from both presentations was cued recall AND memory—which was the proportion of target words for which a participant correctly recalled the word in response to the first recall cue (i.e., the first sentence frame) and the second recall cue (i.e., the second sentence frame). The independence baseline was the probability of recalling a truly independent memory trace (e.g., a 1P item) twice (i.e., 1P OR memory squared). Thus, the chunking index was: cued recall AND memory – (1P OR memory)2. This index was computed for all 3 lags of the EV conditions for all subjects4. Note that this metric would be
uninterpretable for the EC items because the AND metric is ambiguous for them. The recall cues (i.e., the sentence frames) are identical for P1 and P2 in the EC condition. Therefore, there
is no way of knowing whether a participant recalled a given target word from P1, P2, or both. As
such, we only computed a chunking index for the EV conditions.
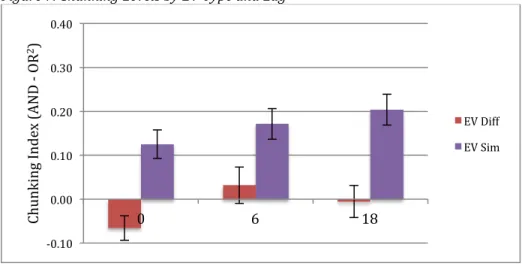
We analyzed the chunking index results with a 2 x 3 (EV Type: Similar vs. Different by Lag: 0, 6, or 18) ANOVA. There was a marginally significant main effect of lag, F(2,140) = 3.03, MSE = .12, p = .051. In general, chunking levels trended towards increasing with lag. There was, however, a significant main effect of EV type, F(1,70) = 33.29, MSE = 1.75, p < .001, ηp2 = .32. Chunking levels were overall higher in the Similar condition than the Different
one. Finally, lag and EV type did not interact, F < 1. This indicates that the overall advantage of
the Similar condition did not significantly change with lag. The results of the chunking analysis are shown in Figure 7. Also, cued recall AND levels are shown in Table 4.
Table 4. Cued Recall AND Memory
Lag
EV Type 0 6 18
Similar .56 (.21) .60 (.23) .63 (.26) Different .32 (.20) .42 (.28) .38 (.25)
Table 4 Notes. Cell values are means and standard deviations (in parentheses). Figure 7. Chunking Levels by EV Type and Lag
Fig. 7 Notes: Error bars indicate +/- 1 standard error of the mean. EV Sim = encoding variability in the Similar condition, EV Diff = encoding variability in the Different condition.
Interim Summary & Discussion
Study-Phase Retrieval. We restricted our primary analyses to high-confidence responses because low-confidence responses were so infrequent. Our preliminary analyses including data from both confidence levels revealed large differences between the low-confidence and high-confidence data. Also, the difference in accuracy between the two levels showed the utility of our decision to collect confidence data (and also indicated that the ratings were used with some
-0.10 0.00 0.10 0.20 0.30 0.40
0 6 18
metacognitive accuracy). Moreover, our preliminary analyses also justified a subsequent exclusive focus on the high-confidence responses to evaluate our hypotheses.
We hypothesized that study-phase retrieval would decline as a function of lag and associative distance. We believed that study-phase retrieval would decline with lag for the EC and EV conditions of both groups—but more so for the EV conditions. This is because the EV conditions have the added effect of associative distance impairing study-phase retrieval. In addition, study-phase retrieval in the Different EV condition should decline more rapidly than in the Similar EV condition because the former entails a larger change in associative distance than the latter. In short, we found results in support for many of these hypotheses. However, some of the specific interactions we hypothesized did not fully materialize. We did find a negative effect of lag on study-phase retrieval, however it only emerged as significant in the EV conditions, not each group’s respective EC condition (although there was a subtle numerical trend towards a decline in both groups’ EC conditions). We also found that associative distance impaired study-phase retrieval because it was overall lower in the Different group. Although there was a trend towards a faster decline in the Different EV condition than the Similar EV condition, the hypothesized interaction was not significant. Nonetheless, the results showed that increases in lag and associative distance do impair study-phase retrieval.
Some other results suggest that the effect of associative distance might have also been more systemic than we anticipated. For one, first occurrence detection rates (i.e., correct
Different emerged as significant. Note that these results indicate that the deviance of the encoding variation had episode-wide—as opposed to within-condition—effects on one’s ability to detect first occurrences and repetitions. This could be due to an overall increase in
interference in the Different EV condition; which would explain why some of the hypothesized interactions did not materialize. This is an issue we will revisit in the General Discussion, but it does not wholly undermine our ability to make inferences about the effects of lag and associative distance on study-phase retrieval (and later memory).
Cued Recall. We hypothesized that lag and associative distance would also interact with cued recall rates. We hypothesized that the EC condition of each respective group would exhibit a prototypical spacing effect in cued recall where recall increases as a function of lag. For both EV types, we hypothesized that EV would exceed EC at lag 0 and that this difference would dissipate with lag. In addition, we hypothesized that recall rates would decline faster with lag in the Different EV condition due the effects of more heavily impaired study-phase retrieval on later memory.
Chunking Rates. We hypothesized that chunking rates are dependent on study-phase retrieval success. Therefore, chunking rates should peak at the shortest lag, lag 0, and in the less deviant encoding variation, the Similar EV condition. As such, chunking rates in the EV
conditions should be maximal where study-phase retrieval is maximal (i.e., at lag 0 in the Similar EV condition). We only found support for one of those hypotheses. The main effect of EV type indicated that chunking rates were overall higher in the Similar EV condition. There was a marginally significant main effect of lag but, contrary to our hypotheses, it trended towards an increase in chunking with lag. Therefore, we also did not find that chunking levels were
maximal in the hypothesized intersection of conditions. It is possible that this was also a reactive side effect of our overt assessment of study-phase retrieval. Perhaps, when study-phase retrieval is not overtly required, the peak of the chunking function will be pushed farther towards the left as was hypothesized. This is another issue that we will address in Experiment 2.
One possible reason for the trend towards a positive effect of lag on chunking could be that study-phase retrieval does promote chunking, but that it interacts with the frequency of retrieval (and possibly the difficulty of it). In an incidental learning paradigm, devoid of any overt assessment of study-phase retrieval, study-phase retrieval is assumed to be more
often to the results. As such, the peak of the chunking function would be shifted farther towards the right. If so then, in an incidental learning paradigm, with no overt assessment of study-phase retrieval (such as the following Experiment 2), the peak should be shifted farther towards the left.
Experiment 2 – Omitting Repetition Decisions
Experiment 1 assessed the effects of lag and associative distance on overt study-phase retrieval to see if these effects related to later memory. This was necessary given that, although there is some evidence from the literature that study-phase retrieval is the proximate cause of the effects of encoding variability on memory, no studies on encoding variability have assessed it. However, we recognize that one reason that overt assessments of study-phase retrieval are rare in the literature is because such assessments might have reactive effects on memory. Consequently, some of the results of the first experiment may have been reactivity effects. Therefore,
Experiment 2 was conducted to determine the extent to which the results of Experiment 1 were due to reactivity. Note that we do not concede that our results were entirely due to reactivity effects. In essence, Experiment 1 only turned up the gain on variable already thought to be at play in incidental learning paradigms. It did not turn on a variable thought to be absent from them. Hence Experiment 2 is really assessing the extent to which the design of Experiment 1 enhanced processes (e.g., study-phase retrieval) that routinely contribute to memory
performance.
participant’s attention to the target word (as was done in Experiment 1), but did not overtly require them to compare the target on the current trial to a previous presentation of it. We also required an orienting task that invited semantic processing because our materials and the encoding variations were semantic in nature. We also needed an orienting task that could be easily mapped onto a 4-option rating scale in case the idiosyncrasies of the decision processes associated with such a scale affected the results. The participants of Experiment 2 would also still read the sentences in isolation for 7.5 sec (like the participants of Experiment 1), but now the 3.5 sec period following that would be replaced with a 4-choice semantic orienting task instead of a 4-choice repetition decision.
Piloting. During initial piloting for Experiment 2, we used 4-choice pleasantness ratings as an orienting task (very unpleasant to very pleasant). This is because pleasantness ratings have been shown to increase semantic processing relative to other non-semantic orienting tasks (Hyde & Jenkins, 1973). Also, unlike Experiment 1, we told participants of the upcoming memory test. We feared there would be floor effects in some conditions had we not told them. However, this approach with these two combined factors (pleasantness ratings and intentional encoding) resulted in ceiling effects in most conditions. Therefore, in our next wave of piloting, we shifted to completely incidental learning and did not warn participants of the upcoming memory test; although we still retained the pleasantness rating task. However, this approach still produced ceiling effects in most conditions. Finally, we retained the incidental learning setting, but shifted to a less semantic orienting task. We chose frequency ratings (i.e., rating the extent to which a word is used in daily speech). We chose this task because it has been shown to have
as making pleasantness ratings (Hyde & Jenkins, 1973). This approach resulted in intermediate levels of memory performance. As a result, we employed it for the duration of Experiment 2.
METHODS Participants.
The participants met the same inclusion criteria as those from Experiment 1. There were 72 participants total. Some were introductory psychology students given course credit in
exchange for participation, and some were young adults paid $10 in exchange for participation. Like Experiment 1, we first calculated study-phase response omissions to see if anyone met outlier criteria for exclusion and replacement. We excluded and replaced anyone whose study-phase response omissions were more than 2 standard deviations above the mean (the resulting cut-off was 5 omissions in this experiment as well). Five participants had to be replaced (3 in the Similar group and 2 in the Different group). Thus, our final sample, including the replacements, is based on 72 subjects who omitted responses on fewer than 5 study-phase trials.
Design.
All aspects of the current experiment’s design were identical to Experiment 1 except we did not assess study-phase retrieval. As such, we also did not collect confidence ratings during the study-phase and confidence was not included as a factor in our analyses.
Materials.
The materials were identical to those used in Experiment 1. The exact same study and test lists were used, only the orienting task was replaced.
Procedures.
test phases, except for those regarding the orienting task. Participants in the current experiment were told that they were to judge how often the word was used in daily speech. Their judgment was to be based on how often they used the word as well as how often they heard it used by others. They rated the word from being very uncommon to very common using the D, F, J, and K keys in ascending order. (An example study-phase trial is shown in Figure 8).
If a participant asked whether or not they should constrain their judgment to the meaning in the current sentence, we told them that they should. For example, if shown a sentence using the river-related meaning of bank, they should base their judgment on that meaning. If shown a sentence using the money-related meaning of bank, they should base their judgment on that meaning. Note that participants were only told this if they asked about it beforehand. We took this approach to avoid sensitizing all of our participants to homonymy before the experiment. Also note that, because this part of the instructions comes up before they are exposed to the words and meanings in their condition, this kind of inquisitiveness necessarily ended up being randomly assigned to the 2 conditions. Regardless, the majority of our participants did not ask about these aspects of the words and judgment task.
Figure 8. Example Study-Phase Trial Sequence for Experiment 2
Fig. 8 Notes: Depicted above is the example of a study-phase trial shown to all participants before the experiment began. After the frequency rating portion of a trial, a crosshair appeared in the middle of the screen for 500 msec (not depicted).
RESULTS Cued Recall Data
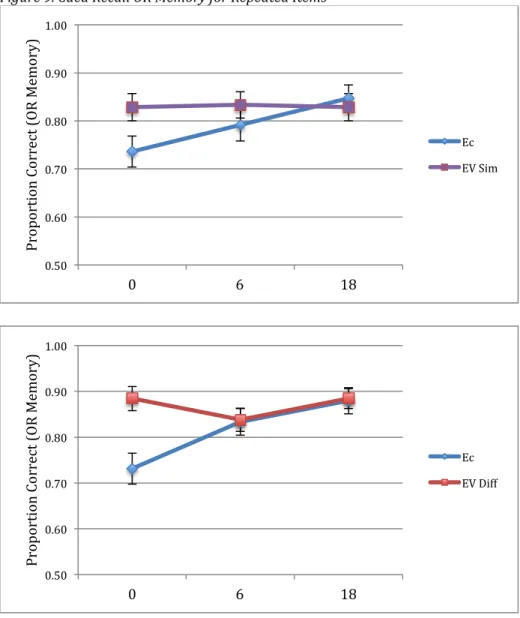
Cued Recall OR Memory. Our first wave of analyses of the cued recall data focused on comparing memory for the target word. As such, we analyzed cued recall OR memory (a metric previously described in Experiment 1). We first compared OR memory for 1P words between those assigned to the Similar and Different groups. We found no significant difference in 1P OR memory between the groups, t(70) = .04, p = .968. These results are displayed in Table 5. Next we analyzed OR memory for the repeated items using a 2 x 2 x 3 (Repetition Type: EC vs. EV by Group: Similar vs. Different by Lag: 0, 6, or 18) ANOVA. There was a significant main effect of repetition type, F(1,70) = 13.13, MSE = .23, p = .001, ηp2 = .16. There was no
significant main effect of group, F(1,70) = 1.69, MSE = .10, p = .198. There was a significant main effect of lag, F(2,140) = 5.75, MSE = .15, p = .004, ηp2 = .08. However, the main effects of
repetition type and lag were qualified by a significant repetition type by lag interaction, F(2,140) = 6.99, MSE = .17, p = .001, ηp2 = .09. We first evaluated the within-condition portion of this
interaction by analyzing the effect of lag within each repetition type. For EC repetition types, there was a significant, linear effect of lag, F(1,71) = 22.02, MSE = .61, p < .001, ηp2 = .24. As
remaining interactions, (repetition type by group; lag by group; or repetition type by lag by group) were significant (all F’s < 1). The OR memory results for the repeated items are displayed in Figure 9.
Table 5. Cued Recall OR Memory for 1P Items
Similar Group Different Group 1P OR Memory .67 (.16) .68 (.16)
Table 5 Notes. Cell values are means and standard deviations (in parentheses). Figure 9. Cued Recall OR Memory for Repeated Items
0.50 0.60 0.70 0.80 0.90 1.00
0 6 18
Pr op or ti on C or re ct ( O R M emo ry ) Ec EV Sim 0.50 0.60 0.70 0.80 0.90 1.00
0 6 18
Fig. 9 Notes: Error bars indicate +/- 1 standard error of the mean. Lag is plotted along the x-axis. EC = encoding constancy, EV Sim = encoding variability in the Similar condition, EV Diff = encoding variability in the Different condition.
Chunking Rates. The next wave of analyses examined the extent to which lag and associative distance affected the chunking of information across presentations of a target word. Our chunking rate analysis was based on the same chunking index described in Experiment 1. We analyzed the chunking index results with a 2 x 3 (EV Type: Similar vs. Different by Lag: 0, 6, or 18) ANOVA. There was a significant main effect of EV type, F(1,70) = 8.99, MSE = 1.16, p = .004, ηp2 = .11. Chunking rates were overall higher in the Similar EV condition than the
Different one. There was no significant main effect of lag, F(2,140) = 1.43, MSE = .06, p = .244 There was also no significant interaction between EV type and lag, F < 1 (although there was a trend such chunking declined with lag in the Similar condition and remained low and flat in the Different one). The results of the chunking analysis are displayed in Figure 10. Also, cued recall AND levels are shown in Table 6.
Figure 10. Chunking Levels by EV Type and Lag
Fig. 10 Notes: Error bars indicate +/- 1 standard error of the mean. EV Sim = encoding variability in the Similar condition, EV Diff = encoding variability in the Different condition.
-0.10 0.00 0.10 0.20 0.30 0.40
0 6 18