A R T I C L E
Intrinsic Subtype and Therapeutic Response Among
HER2-Positive Breast Tumors from the NCCTG
(Alliance) N9831 Trial
Edith A. Perez, Karla V. Ballman, Afshin Mashadi-Hossein,
Kathleen S. Tenner, Jennifer M. Kachergus, Nadine Norton,
Brian M. Necela, Jennifer M. Carr, Sean Ferree, Charles M. Perou,
Frederick Baehner, Maggie Chon U. Cheang, E. Aubrey Thompson
Affiliations of authors:Division of Hematology/Oncology, Department of Medicine (EAP), and Department of Cancer Biology (EAP, JMK, NN, BMN, JMC, EAT), Mayo Clinic Comprehensive Cancer Center, Mayo Clinic, Jacksonville, FL; Division of Biostatistics and Bioinformatics, Department of Health Science Research, Mayo Clinic Comprehensive Cancer Center, Mayo Clinic, Rochester, MN (KVB, KST); Nanostring, Inc., Seattle, WA (AMH, SF); Departments of Genetics and Pathology & Laboratory Medicine, Lineberger Comprehensive Cancer Center, University of North Carolina, Chapel Hill, NC (CMP, MCUC); Genonic Health, Inc., Redwood, CA (FB); Clinical Trials and Statistics Unit, The Institute of Cancer Research, London, UK (MCUC).
Correspondence to:E. Aubrey Thompson, PhD, Department of Cancer Biology, Griffin Cancer Research Bld., Rm 214, Mayo Clinic, 4500 San Pablo Rd, Jacksonville, FL 32224 (e-mail: [email protected]).
Abstract
Background:Genomic data from human epidermal growth factor receptor 2–positive (HER2þ) tumors were analyzed to assess the association between intrinsic subtype and clinical outcome in a large, well-annotated patient cohort.
Methods:Samples from the NCCTG (Alliance) N9831 trial were analyzed using the Prosigna algorithm on the NanoString platform to define intrinsic subtype, risk of recurrence scores, and risk categories for 1392 HER2þtumors. Subtypes were evaluated for recurrence-free survival (RFS) using Kaplan-Meier and Cox model analysis following adjuvant chemotherapy (n¼484) or chemotherapy plus trastuzumab (n¼908). All statistical tests were two-sided.
Results:Patients with HER2þtumors from N9831 were primarily scored as HER2-enriched (72.1%). These individuals received statistically significant benefit from trastuzumab (hazard ratio [HR]¼0.68, 95% confidence interval [CI]¼0.52 to 0.89,P¼.005), as did the patients (291 of 1392) with luminal-type tumors (HR¼0.52, 95% CI¼0.32 to 0.85,P¼.01). Patients with basal-like tu-mors (97 of 1392) did not have statistically significantly better RFS when treated with trastuzumab and chemotherapy compared with chemotherapy alone (HR¼1.06, 95% CI¼0.53 to 2.13,P¼.87).
Conclusions:The majority of clinically defined HER2-positive tumors were classified as HER2-enriched or luminal using the Prosigna algorithm. Intrinsic subtype alone cannot replace conventional histopathological evaluation of HER2 status because many tumors that are classified as luminal A or luminal B will benefit from adjuvant trastuzumab if that subtype is accompa-nied by HER2 overexpression. However, among tumors that overexpress HER2, we speculate that assessment of intrinsic subtype may influence treatment, particularly with respect to evaluating alternative therapeutic approaches for that subset of HER2-positive tumors of the basal-like subtype.
ARTICLE
Received:March 10, 2016;Revised:June 29, 2016;Accepted:August 17, 2016
©The Author 2016. Published by Oxford University Press. All rights reserved. For Permissions, please email: [email protected]
1 of 8 doi: 10.1093/jnci/djw207
With the advent of high-dimensional technologies for quantify-ing expression of large numbers of genes, it has become clear that breast tumors exhibit a considerable range of molecular/ge-nomic heterogeneity, both between and among the clinically defined cohorts of hormone receptor–positive, human epider-mal growth factor receptor 2 (HER2)–positive, and triple-negative tumors. The most thoroughly characterized classifier of molecu-lar heterogeneity is the PAM50 signature (1,2), which uses the ex-pression of 50 genes to stratify breast tumors into four major classes: basal-like, HER2-enriched, luminal A, and luminal B. There is a strong presupposition that these biological processes will prove to be informative of clinical/pathological features of breast tumors (2–6).
Our studies have focused upon defining molecular heteroge-neity among HER2-positive (HER2þ) breast tumors. We used the NanoString Prosigna algorithm and PAM50 genes to define in-trinsic subtypes and assess their distribution and association with outcome within tumors from the North Central Cancer Treatment Group (NCCTG [Alliance]) N9831 trial of patients with early-stage HER2þtumors (7,8) randomly assigned to receive adjuvant chemotherapy or chemotherapy plus trastuzumab. Our primary analytical focus was to test the hypothesis that benefit from adjuvant chemotherapy combined with trastuzu-mab, compared with benefit from adjuvant chemotherapy alone, varies as a function of intrinsic subtype.
Methods
Patients
The NCCTG (Alliance) N9831 trial enrolled 3505 patients who were randomly assigned to three study arms: arm A— chemotherapy (doxorubicin and cyclophosphamide followed by weekly paclitaxel); arm B—chemotherapy followed by 52 weeks of weekly trastuzumab; and arm C—chemotherapy with 12 weeks of trastuzumab concurrent with paclitaxel, followed by 40 more weeks of weekly trastuzumab alone, as previously described in detail (7). Patients in both trastuzumab-treated arms (B and C) received 52 weeks of trastuzumab and showed statistically significant improvement in relapse-free survival (7,8), compared with patients who received chemotherapy alone (arm A). We therefore combined patients from arms B and C into a single trastuzumab-treated group (arm B/C) for subse-quent analysis. All patients included in this analysis were as-sessed for central HER2 immunohistochemistry (IHC) and/or fluorescence in situ hybridization (FISH) as part of the N9831 parent study, as previously described (7). Informed written con-sent to these studies was obtained from all patients. Studies were carried out under Mayo Clinic Institutional Review Board protocols 954-00 and 13-000290.
Statistical Analysis
The main objective of the analysis was to determine whether the effect of trastuzumab qualitatively differed for any of the intrinsic subtypes. If differing treatment effects were observed among the subtypes, a test for interaction was to be performed to determine whether this observation was statistically significant. The pri-mary endpoint for outcome analysis was recurrence-free survival (RFS), defined as the time from random assignment to breast cer recurrence (local, regional, or distant recurrence of breast can-cer or breast cancan-cer–related death). The time to event for patients who died without recurrence was considered censored at the
time of death. Cox proportional hazard models were used to gen-erate point estimates of hazard ratios (HRs) and corresponding 95% confidence intervals (CIs) to assess the benefit of trastuzu-mab for RFS comparisons. The assumption of proportional haz-ards was verified with a Cox proportional hazard model containing the treatment indicator and the interaction of the indi-cator with the log of time. The test of proportionality involves a likelihood ratio test of the model containing the interaction term against the model that contains the treatment variable only. A nonsignificantPvalue of this test suggests there is not sufficient evidence to reject the assumption of proportional hazards. TheP
value of this test was .88, suggesting that there is not sufficient evidence to reject the assumption of proportional hazards. Wald Chi-squaredPvalues were calculated for the Cox hazard ratios. Comparisons were made both within and between treatment arms. The interaction term of basal-like vs non-basal-like by treatment arm was determined using a Cox model that also in-cluded the main effects; this interaction was tested because the effect of trastuzumab appeared qualitatively different in this sub-type. Kaplan-Meier plots were used to depict the proportion of pa-tients free from breast cancer recurrence as a function of time. Chi-squared tests for nominal categories or Cochran-Mantel-Haenszel tests for ordered categories were performed to ascertain differences in eligible N9831 patients included in the analysis with those that were excluded. All statistical tests were two-sided, and aPvalue of less than .05 was considered statistically significant.
Assignment of Intrinsic Subtype
We constructed a NanoString custom CodeSet that includes the PAM50 genes plus appropriate housekeeping genes (B2M, GAPDH, POLR2A, UBC, YWHAZ) for normalization purposes. The Prosigna subtyping algorithm is trained for use with Prosigna CodeSet. To use this algorithm for subtyping N9831 data, adjust-ment factors that account for differences between the custom CodeSet used in the N9831 study and the Prosigna CodeSet were estimated and applied to the data. To this end, 30 samples, which were processed with the custom CodeSet, were recessed using the Prosigna CodeSet. For each probe, this pro-vided 30 pairs of counts (corresponding to the two CodeSets), which were then used to estimate the adjustment factor be-tween the two CodeSets. Specifically, for each of the PAM50 probes, first the ratio of the normalized counts from the custom CodeSet relative to their corresponding normalized counts from the Prosigna CodeSet were calculated, resulting in 30 ratios for each of the probes. Then, for each probe, the median of the 30 ratios was taken as the adjustment factor. Subsequently, the re-sultant 50 adjustment factors (one for each PAM50 gene) were applied to the PAM50 counts in the original data set and subtyp-ing was performed on the adjusted counts per standard Prosigna algorithm. Quantitative real-time polymerase chain re-action data on mRNA abundance, proliferative scores, and mi-totic indices were abstracted from a published study on the OncotypeDX analysis of N9831 samples (9).
Results
Assignment of Risk Scores and Intrinsic Subtype Using Prosigna
Samples from 1426 eligible patients had sufficient RNA for test-ing and were analyzed on the NanoStrtest-ing platform to measure
ARTI
the abundance of mRNAs that define the intrinsic subtype pat-terns. Thirty-four samples were excluded for quality control is-sues, mostly low total gene counts; 1392 remaining samples (arm A: 484, arm B: 494, arm C: 414) were analyzed for intrinsic subtype in a blinded fashion. Patient demographics for samples that were included, as well as those from whom RNA was not available, are given inSupplementary Table 1(available online).
Distributions of intrinsic subtypes, risk of recurrence scores (ROR), and risk categories (high, intermediate, low) as a function of treatment arm are given inTable 1, and clinical/pathological features of the tumors by treatment are inSupplementary Table 2 (available online). There were small but statistically significant differences in nodal status between the two arms (P ¼ .04). However, the observed increase in node 0 and node 1–3 patients in arm B/C did not translate into differences in risk category (Table 1).
The patients enrolled in N9831 were centrally confirmed as HER2þ. The majority of the tumors (1004 of 1392, 72.1%) were classified by Prosigna as HER2-enriched. The remaining tumors were more or less equally distributed among the basal-like (97 of 1392, 7.0%), luminal A (132 of 1392, 9.5%), or luminal B (159 of 1392, 11.4%) subtypes.
Association Between Risk of Recurrence Score, Risk Category, and RFS
The Prosigna algorithm reports a risk of recurrence score that combines intrinsic subtype, tumor size, and proliferation score into a single metric. The majority of the N9831 samples (1045/ 1392) had ROR scores above 70, where low risk is considered 1– 40, intermediate risk 40–60, and high risk above 60. We did not observe a statistically significant association between RFS and ROR, expressed as a discontinuous, quantile score, among pa-tients who received chemotherapy alone (arm A,P¼.40) (Figure 1A) or patients who received chemotherapy plus trastuzumab (arms B/C,P¼.37) (Figure 1B).
Tumor size is incorporated into ROR to stratify tumors into high-, intermediate-, and low-risk categories. Almost all of the N9831 samples were classified as high risk (1335/1392) (Table 1). The Kaplan-Meier analysis suggested a quantitative tendency toward improved RFS in the few low-/intermediate-risk patients who received chemotherapy alone; however, this tendency did not achieve statistical significance (arm A,P¼.13) (Figure 1C).
Low-/intermediate-risk patients who received trastuzumab ap-peared to receive statistically significant benefit (arm B/C,
P¼.01) (Figure 1D). Among the tumors with low/intermediate risk, those classified as estrogen receptor– and/or progester-one receptor–positive seldom recurred. Among 30 such pa-tients, only one recurrence was reported, compared with the overall recurrence rate of about one in four (317/1392) for all patients in this study (Chi-squaredP¼.01).
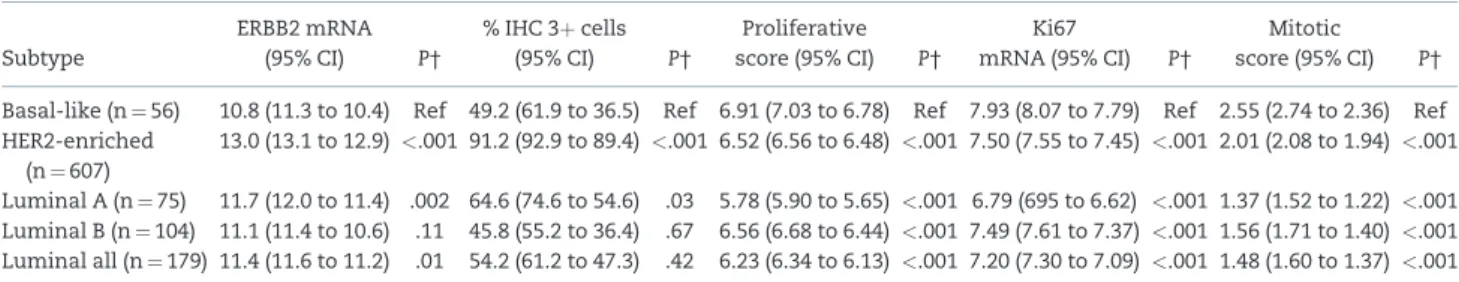
A subset of the N9831 patients (445 from arm A and 397 from arm C) has previously been analyzed using the 21-gene OncotypeDX panel (9). As with the Prosigna analysis, almost all of the patients were classified as high risk (763/842). A number of molecular features associated with subtype were derived from the 21-gene signature, including ERBB2 mRNA, prolifera-tive score, and Ki67 mRNA. Percent cells staining 3þfor HER2 was extracted from the clinical record, and mitotic index was assessed by histological examination, as shown inTable 2. The proliferative markers associated with each subtype were ranked basal-like>HER2-enrichedluminal B>luminal A. HER2 ex-pression generally followed the pattern HER2-enriched> lumi-nal A>luminal B>basal-like. Among the four subtypes, the basal-like tumors exhibited the lowest HER2 expression and the highest proliferation, features that might be expected to influ-ence outcome following HER2-targeted therapy.
Association Between Intrinsic Subtype and RFS
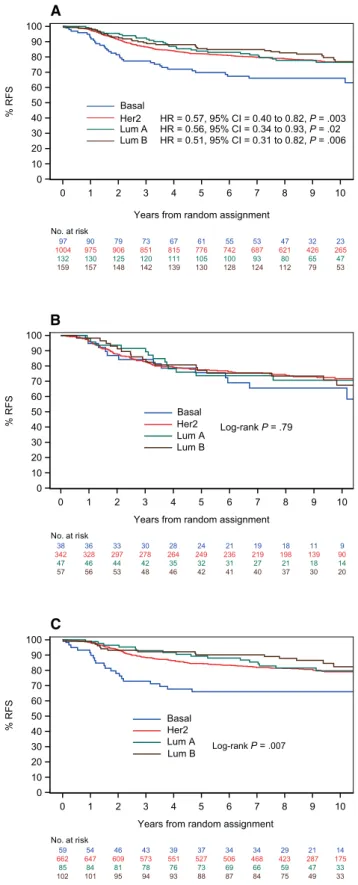
A statistically significant association between RFS and intrinsic subtype was observed when all patients (irrespective of therapy) were evaluated (Figure 2A). Patients with basal-like tumors ex-hibited statistically significantly worse RFS compared with pa-tients with HER2-enriched, luminal A, or luminal B subtypes. When intrinsic subtype was evaluated within each treatment arm, there was no statistically significant association between subtype and RFS in the patients who received chemotherapy alone (HRbasal¼reference, log-rankP¼.79; HRHER2¼0.75, 95% CI¼0.42 to 1.33,P¼.32; HRlumA¼0.76, 95% CI¼0.35 to 1.64,P¼.32; HRlumB¼0.83, 95% CI¼0.41 to 1.69,P¼.61) (Figure 2B). However, a statistically significant association was observed be-tween outcome and intrinsic subtype among patients who re-ceived trastuzumab (HRbasal ¼reference, log-rank P ¼ .007; HRHER2¼0.49, 95% CI¼0.30 to 0.78,P¼.003; HRlumA¼0.47, 95% CI¼0.25 to 0.90,P¼.02; HRlumB¼0.35, 95% CI¼0.18 to 0.68,P¼.002) (Figure 2C).
RFS as a Function of Treatment and Subtype
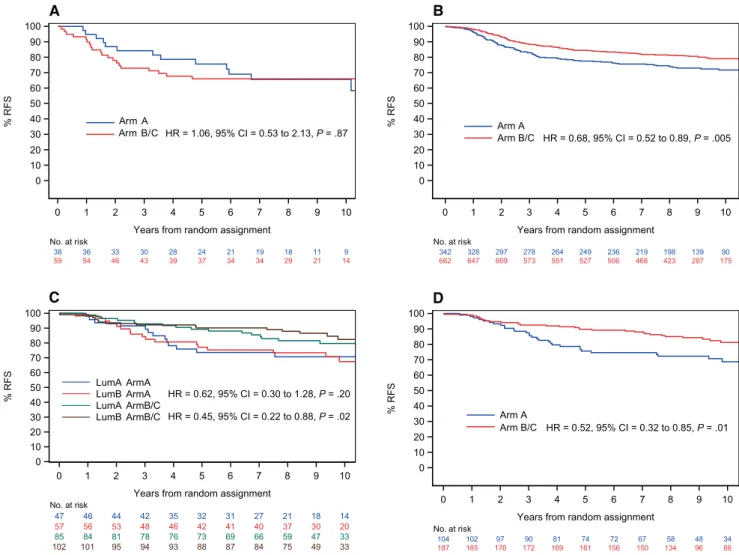
The data inFigure 2suggest that there is a relationship between intrinsic subtype and outcome and that this relationship resides primarily in those patients who received adjuvant trastuzumab. We therefore evaluated the relationship between RFS and treat-ment within each subtype. Trastuzumab appeared to have little or no statistically significant association with RFS in HER2þ pa-tients of the basal-like subtype (HR¼1.06, 95% CI¼0.53 to 2.13,
P¼.87) (Figure 3A). Patients with HER2-enriched genomic pro-files received statistically significant benefit from trastuzumab, compared with chemotherapy alone (HR¼0.68. 95% CI¼0.52 to 0.89,P¼.005) (Figure 3B). Patients with luminal A profiles ex-hibited a quantitative trend towards improved RFS, although this trend did not achieve statistical significance (HR¼0.62, 95% CI¼0.30 to 1.26,P¼.20) (blue curve vs green curve inFigure 3C). HER2þtumors with luminal B profiles benefitted statistically significantly (HR¼0.45, 95% CI¼0.22 to 0.88,P¼.02) (red curve vs brown curve inFigure 3C). Because of the small number of
Table 1.Comparison of Prosigna intrinsic subtype, risk of recurrence, and risk category in arm A (chemotherapy alone) and arm B/C (che-motherapy plus trastuzumab) of N9831
Subtype Arm A No. (%) Arm B/C No. (%) P*
Basal 38 (7.9) 59 (6.5) .76
HER2 342 (70.7) 662 (72.9)
Luminal A 47 (9.7) 85 (9.4)
Luminal B 57 (11.7) 102 (11.2)
ROR
1. <70 140 (28.9) 207 (22.8) .03
2. 70–81 116 (23.9) 220 (24.2)
3. 82–91 108 (22.3) 240 (26.4)
4. 92–100 120 (24.7) 241 (26.5)
Risk category
High 462 (95.4) 873 (96.1) .54
Intermediate/low 22 (4.5) 35 (3.8)
*Pvalue from Chi-squared test for nominal categories or Cochran-Mantel-Haenszel test for ordered categories. All statistical tests were two-sided. HER2¼ human epidermal growth factor receptor 2; ROR¼risk of recurrence.
events in patients with luminal-type tumors, we combined the luminal A and B tumors into a single cohort of luminal-type tumors for subsequent analyses. Trastuzumab provided statistically significant benefit in patients whose tumors
exhibited luminal profiles (HR¼0.52, 95% CI¼0.32 to 0.85,P¼
.01) (Figure 3D).
A Cox model was used to evaluate RFS among basal and nonbasal tumors. The hazard ratios for RFS of basal-like tumors
140 135 126 118 112 106 101 93 82 54 36
116 114 103 94 89 86 81 74 69 51 34
108 103 95 89 86 79 71 65 58 46 35
120 114 103 97 86 76 76 73 65 47 28
No. at risk
0 1 2 3 4 5 6 7 8 9 10
Years from random assignment 0
10 20 30 40 50 60 70 80 90 100
% RFS ROR < 70 ROR = 70–81 ROR = 82–91 ROR = 92–100
Log-rank P = .40
A
207 203 196 191 181 173 167 160 141 93 65
220 213 197 181 177 171 164 152 140 105 60
240 235 218 208 201 191 180 168 150 104 67
241 235 220 208 200 190 185 172 155 102 63
No. at risk
0 1 2 3 4 5 6 7 8 9 10
Years from random assignment 0
10 20 30 40 50 60 70 80 90 100
% RFS
ROR < 70 ROR = 70–81 ROR = 82–91 ROR = 92–100
Log-rank P = .37
B
462 444 405 377 353 328 311 287 260 189 127
22 22 22 21 20 19 18 18 14 9 6
No. at risk
0 1 2 3 4 5 6 7 8 9 10
Years from random assignment 0
10 20 30 40 50 60 70 80 90 100
% RFS Risk = High Risk = Interm/low Log-rank P = .13
C
873 851 797 754 726 692 664 620 561 388 244
35 35 34 34 33 33 32 32 25 16 11
No. at risk
0 1 2 3 4 5 6 7 8 9 10
Years from random assignment 0
10 20 30 40 50 60 70 80 90 100
% RFS Risk = High
Risk = Interm/low Log-rank P = .01
D
Figure 1.Risk of recurrence (ROR) scores and RISK categories among human epidermal growth factor receptor 2–positive (HER2þ) tumors. The Prosigna algorithm re-ports two scores, ROR and RISK. The associations between ROR scores and relapse-free survival (RFS) after chemotherapy(A)or chemotherapy plus trastuzumab(B)are shown. The majority of the HER2þtumors were assigned as high risk. The associations between RISK category and RFS after chemotherapy(C)or chemotherapy plus trastuzumab(D)are given. Kaplan-Meier log-rank survival analysis (two-sided) was used to calculatePvalues. RFS¼relapse-free survival; ROR¼risk of recurrence score, according to the Prosigna algorithm.;
Table 2. Basal-like HER2þtumors exhibit lower ERBB2 expression and higher proliferation*
Subtype
ERBB2 mRNA
(95% CI) P†
% IHC 3þcells
(95% CI) P†
Proliferative
score (95% CI) P†
Ki67
mRNA (95% CI) P†
Mitotic
score (95% CI) P†
Basal-like (n¼56) 10.8 (11.3 to 10.4) Ref 49.2 (61.9 to 36.5) Ref 6.91 (7.03 to 6.78) Ref 7.93 (8.07 to 7.79) Ref 2.55 (2.74 to 2.36) Ref
HER2-enriched
(n¼607)
13.0 (13.1 to 12.9)<.001 91.2 (92.9 to 89.4) <.001 6.52 (6.56 to 6.48) <.001 7.50 (7.55 to 7.45) <.001 2.01 (2.08 to 1.94) <.001
Luminal A (n¼75) 11.7 (12.0 to 11.4) .002 64.6 (74.6 to 54.6) .03 5.78 (5.90 to 5.65) <.001 6.79 (695 to 6.62) <.001 1.37 (1.52 to 1.22) <.001
Luminal B (n¼104) 11.1 (11.4 to 10.6) .11 45.8 (55.2 to 36.4) .67 6.56 (6.68 to 6.44) <.001 7.49 (7.61 to 7.37) <.001 1.56 (1.71 to 1.40) <.001
Luminal all (n¼179) 11.4 (11.6 to 11.2) .01 54.2 (61.2 to 47.3) .42 6.23 (6.34 to 6.13) <.001 7.20 (7.30 to 7.09) <.001 1.48 (1.60 to 1.37) <.001
*Data are summarized from 842 samples from arm A (445) and arm C (397 that were analyzed using the OncotypeDX 21-gene signature (9). Proliferative score is the av-erage of five proliferative marker genes in this panel. Mitotic score was determined by histological examination by F. Baehner. All mRNA abundance data were normal-ized and scaled to log base 2. Immunohistochemistry staining for human epidermal growth factor receptor 2 abundance (%3þcells) were extracted from the clinical record, as previously described. % IHC 3þ ¼percent of tumor cells with membrane scoring 3þby clinical pathology; Ki67¼mRNA encoded byMKI67.
† Mann-Whitney U test, two-sidedPvalue for comparison with basal-like tumors.
ARTI
in arm A did not appear to be statistically significantly different from those of nonbasal tumors after chemotherapy (arm A basal-like vs arm A nonbasal: HR¼0.76, 95% CI¼0.43 to 1.34,
P¼.34) (Table 3). In addition, RFS was not statistically signifi-cantly different between basal-like tumors after chemotherapy vs after chemotherapy plus trastuzumab (arm A basal-like vs arm B/ C basal-like: HR¼1.06, 95% CI¼0.53 to 2.13,P¼.87) (Table 3). As expected, RFS among the nonbasal cohort was statistically signifi-cantly improved by trastuzumab (arm A nonbasal vs arm B/C nonbasal: HR¼0.65, 95% CI¼0.51 to 0.82, P < .001) (Table 3). Moreover, RFS after trastuzumab was statistically significantly better among non-basal-like tumors (arm B/C basal-like vs arm B/ C non-basal-like: HR¼0.47, 95% CI¼0.29 to 0.74, P ¼ .001) (Table 3). However, the test for interaction of treatment arm (A vs B/C) by tumor subtype (basal vs nonbasal) did not achieve statisti-cal significance (P¼.20), which may or may not be because of the small number of basal-like tumors in our sample cohort.
Hormone Receptor Status and Outcome Among Nonbasal Tumors
Because basal-like tumors are generally estrogen receptor (ER)– and/or progesterone receptor (PR)–negative, we evaluated the association between subtype, outcome, and ER/PR status. Patients with ER/PR-positive or ER/PR-negative non-basal-like tumors had similar RFS after chemotherapy (arm A ER/PR-neg vs arm A ER/PR-pos: HR¼0.90, 95% CI¼0.63 to 1.28, P ¼.55) (Table 3). Likewise, ER/PR status was not statistically signifi-cantly associated with outcome after trastuzumab treatment of nonbasal tumors (arm B/C ER/PR-neg vs arm B/C ER/PR-pos: HR¼0.84, 95% CI¼0.62 to 1.14,P¼.27) (Table 3). Moreover, both patients with ER/PR-positive and -negative tumors with nonbasal features appeared to benefit from trastuzumab (arm A ER/PR-neg vs arm B/C ER/PR-neg: HR¼0.67, 95% CI¼0.47 to 0.85,
P¼.02; arm A ER/PR-pos vs arm B/C ER/PR-pos: HR¼0.62, 95% CI¼0.45 to 0.85,P¼.003) (Table 3).
Discussion
Intrinsic subtype, defined by abundance of transcripts that cor-respond to the PAM50 cohort of genes, has gained wide accep-tance as a tool for stratifying breast tumors based on the extent to which these tumors exhibit expression profiles that corre-spond to basal-like, HER2-enriched, luminal A, or luminal B samples. All of the samples included in this analysis were cen-trally evaluated for HER2 protein or gene copy number at the Mayo Clinic (7). Thus, our data reflect molecular heterogeneity within clinically well-defined HER2þtumors, such that some HER2þtumors exhibit basal-like or luminal gene expression profiles. These results are consistent with others published elsewhere (10,11). Evaluation of several molecular features asso-ciated with subtype suggests that there are statistically signifi-cant differences in HER2 expression and proliferation. Most notably, the basal-like tumors exhibited statistically signifi-cantly lower HER2 mRNA and percent of cells staining 3þfor HER2, coupled with high proliferative markers. Both of these features might plausibly be associated with outcome.
To our knowledge, this is the first report of the use of the Prosigna algorithm to define intrinsic subtype distribution and outcome following adjuvant trastuzumab therapy of HER2þ tu-mors. Our data are broadly consistent with analyses of intrinsic
subtype among HER2þtumors from The Cancer Genome Atlas
(10), the NOAH neoadjuvant (11), and the NSABP B31 adjuvant
97 90 79 73 67 61 55 53 47 32 23
1004 975 906 851 815 776 742 687 621 426 265
132 130 125 120 111 105 100 93 80 65 47
159 157 148 142 139 130 128 124 112 79 53
No. at risk
0 1 2 3 4 5 6 7 8 9 10
Years from random assignment 0
10 20 30 40 50 60 70 80 90 100
% RFS Her2
Lum A Lum B
HR = 0.57, 95% CI = 0.40 to 0.82, P = .003 HR = 0.56, 95% CI = 0.34 to 0.93, P = .02 HR = 0.51, 95% CI = 0.31 to 0.82, P = .006 Basal
A
38 36 33 30 28 24 21 19 18 11 9
342 328 297 278 264 249 236 219 198 139 90
47 46 44 42 35 32 31 27 21 18 14
57 56 53 48 46 42 41 40 37 30 20
No. at risk
0 1 2 3 4 5 6 7 8 9 10
Years from random assignment 0
10 20 30 40 50 60 70 80 90 100
% RFS
Lum B Lum A Her2 Basal
Log-rank P = .79
B
59 54 46 43 39 37 34 34 29 21 14
662 647 609 573 551 527 506 468 423 287 175
85 84 81 78 76 73 69 66 59 47 33
102 101 95 94 93 88 87 84 75 49 33
No. at risk
0 1 2 3 4 5 6 7 8 9 10
Years from random assignment 0
10 20 30 40 50 60 70 80 90 100
% RFS
Lum B Lum A Her2 Basal
Log-rank P = .007
C
Figure 2Intrinsic subtype and relapse-free survival (RFS) among patients in the N9831 trial. The relationship between RFS and time, evaluated as a function of Prosigna subtype in all arms of the N9831 trial, is shown in(A). The relationship between RFS and subtype in patients enrolled in arm A, chemotherapy alone, is shown in(B), whereas RFS as a function of subtype in patients enrolled in arm B/C, chemotherapy plus trastuzumab, is given in(C). Kaplan-Meier log-rankP values (two-sided) were calculated. The Cox model (two-sided) was used to esti-mate hazard ratios.
trastuzumab trials (12), in which the research PAM50 algorithm was used to assess molecular heterogeneity among tumors that are clinically defined as HER2þ. The key question is to what ex-tent this molecular heterogeneity is associated with clinical out-come following trastuzumab. As reported in the NOAH and
NSABP B31/PAM50 analysis, we observed that HER2þtumors
with HER2-enriched profiles are generally responsive to trastu-zumab. Thus, the HER2-enriched profile is predictive of better outcome following adjuvant trastuzumab. The data with the HER2þluminal subtypes are somewhat more difficult to evalu-ate. These patients tend to do very well, and few events were re-corded. We observed a qualitative trend toward increased RFS in trastuzumab-treated patients with both luminal A and lumi-nal B tumors, although statistical significance was not achieved with the luminal A subgroup. Nevertheless, the data suggest that HER2þpatients whose tumors express luminal signatures likely receive additional benefit from trastuzumab, above and beyond that received from chemotherapy alone.
The majority of the HER2þtumors were classified as high risk by both Prosigna and OncotypeDX. It is unclear if the small subset of patients with low/intermediate risk, estrogen and/or
progesterone receptor–positive early-stage HER2þ tumors
require adjuvant trastuzumab. The number of such patients en-rolled in N9831 was small. Additional studies will be required to assess the relationship between risk category and RFS among patients with hormone receptor–positive tumors.
The data indicate that nonbasal HER2þtumors (ie, those tu-mors with HER2-enriched, luminal A, or luminal B profiles) are responsive to trastuzumab, irrespective of hormone receptor status. A subset, about 7%, of HER2þtumors in the N9831 study exhibited gene expression profiles that resemble those of basal-like tumors. Similar results were observed in analysis of 1225 samples from The Cancer Genome Atlas Network and METABRIC databases (14.1% basal-like) (13) and 1579 samples from the NSABP B31 trial (6.5% basal-like) (12). The data pre-sented here suggest that HER2þtumors with basal-like features may benefit less from adjuvant trastuzumab. This suggestion is consistent with the molecular features of these tumors, which express low levels of HER2 and appear to be highly proliferative. However, the conclusion that patients with such tumors will not benefit from trastuzumab is not warranted by the data. Although the hazard ratio for RFS following trastuzumab is not statistically significantly different from that observed with
che-motherapy alone (HR¼1.06, P ¼ .87), the 95% confidence
38 36 33 30 28 24 21 19 18 11 9
59 54 46 43 39 37 34 34 29 21 14
No. at risk
0 1 2 3 4 5 6 7 8 9 10
Years from random assignment 0
10 20 30 40 50 60 70 80 90 100
% RFS
Arm B/C Arm A
HR = 1.06, 95% CI = 0.53 to 2.13, P = .87
A
342 328 297 278 264 249 236 219 198 139 90
662 647 609 573 551 527 506 468 423 287 175
No. at risk
0 1 2 3 4 5 6 7 8 9 10
Years from random assignment 0
10 20 30 40 50 60 70 80 90 100
% RFS
Arm B/C Arm A
HR = 0.68, 95% CI = 0.52 to 0.89, P = .005
B
47 46 44 42 35 32 31 27 21 18 14 57 56 53 48 46 42 41 40 37 30 20
85 84 81 78 76 73 69 66 59 47 33
102 101 95 94 93 88 87 84 75 49 33
No. at risk
0 1 2 3 4 5 6 7 8 9 10
Years from random assignment 0
10 20 30 40 50 60 70 80 90 100
% RFS
LumA ArmA LumB ArmA LumA ArmB/C LumB ArmB/C
HR = 0.62, 95% CI = 0.30 to 1.28, P = .20
HR = 0.45, 95% CI = 0.22 to 0.88, P = .02
C
104 102 97 90 81 74 72 67 58 48 34
187 185 176 172 169 161 156 150 134 96 66
No. at risk
0 1 2 3 4 5 6 7 8 9 10
Years from random assignment 0
10 20 30 40 50 60 70 80 90 100
% RFS
Arm B/C Arm A
HR = 0.52, 95% CI = 0.32 to 0.85, P = .01
D
Figure 3.Human epidermal growth factor receptor 2–positive (HER2þ) tumors with basal-like expression profiles compared with tumors with HER2-enriched or lumi-nal-type expression profiles. Relapse-free survival, plotted as Kaplan-Meier curves was compared for arm A (chemotherapy alone) vs arm B/C (chemotherapy plus tras-tuzumab) for N9831 tumors with basal-like(A)or HER2-enriched(B)Prosignal subtype profiles. Log-rank statistics were used to calculatePvalues for relapse-free survival (RFS) as a continuous variable. Hazard ratios on the basis of % RFS 10 years following random assignment. Survival analysis was also carried out for luminal A and luminal B subtypes, individually(C)and combined into a luminal-type category(D). All statistical tests were two-sided.
ARTI
intervals are very large (95% CI¼0.53 to 2.13), and the test for in-teraction between treatment and subtype (basal vs nonbasal) was not statistically significant. Moreover, Pogue-Geile et al. re-ported that basal-like tumors in the NSABP B31 trial received statistically significant benefit from adjuvant trastuzumab (12). There are some differences in the algorithms used to call intrin-sic subtype in our study and the study by Pogue-Geile et al. They reported disease-free survival, whereas we report breast cancer relapse–free survival. Perhaps more importantly, they used a modified version of the PAM50 algorithm, rather than the Prosigna algorithm used in our studies. These two algo-rithms use different normalization strategies, and they called 47% of the HER2þtumors in B31 HER2-enriched, whereas we
called 73% of the N9831 HER2þ samples HER2-enriched.
Furthermore, both studies were limited in power by the relative small number of basal-like tumors that were identified. Given these considerations, we are inclined to the most conservative conclusion: that additional studies will be required to sort out the role of intrinsic subtype in predicting response to HER2-targeted therapy in the adjuvant setting.
There are a couple of limitations of this study. The first is that it is a retrospective analysis of samples from less than half of the patients enrolled on N9831. This because of the fact that the sub-mission of patient samples was optional for this study and some samples were dropped due to poor quality. It is recognized that this could bias the results. A comparison of patients with samples used in this analysis to patients not included in the analysis only showed some clinical-pathological differences (eg, patients with larger tumors are included in this analysis), but there was no dif-ference observed in the treatment effect between the patients in-cluded in this study and patients not inin-cluded in this study. Another limitation is that some of the identified intrinsic subtype groups had a relatively small number of patients and events. This
limits the power of the analyses in these subgroups, which makes statistically nonsignificant results hard to interpret: They could be reflective of no real difference between the groups or could be because of lack of power to detect a difference of interest.
Finally, our data indicate that evaluation of HER2 status by IHC and/or FISH is an essential component of clinical management of breast cancer patients. Intrinsic subtype alone cannot replace con-ventional histopathological evaluation of HER2 status because many tumors that are classified as luminal A or luminal B will ben-efit from adjuvant trastuzumab if that subtype is accompanied by HER2 overexpression. However, among tumors that overexpress HER2, we speculate that assessment of intrinsic subtype may guide further treatment development, particularly with respect to evalu-ating alternative therapeutic approaches for that subset of HER2þ
tumors of the basal-like subtype. Given the relative rarity of such tumors, additional studies will be required to evaluate this idea.
Funding
These studies were supported in part by grants from the National Cancer Institute (NCI; CA129949), the Breast Cancer Research Foundation, the 26.2 with Donna Foundation, and NCI Breast SPORE CA58223 (to CMP). Additional support for
infrastructure was derived from the Mayo Clinic
Comprehensive Cancer Center support grant CA15083 and the Mayo Foundation.
Notes
The funders had no role in the design of the study; the collection, analysis, or interpretation of the data; the writing of the manu-script; or the decision to submit the manuscript for publication.
Table 3.HER2þtumors with basal-like signatures have different outcomes than HER2þtumors with nonbasal signatures*
Arm Subtype or hormone receptor status No. Events (%) HR (95% CI) P
RFS as a function of subtype (basal vs nonbasal) by treatment arm
A Basal-like 38 13 (34.2) 1.0 (Ref)
A Non-basal-like 446 123 (27.5) 0.76 (0.43 to 1.34) .34
B/C Basal-like 59 20 (33.8) 1.0 (Ref)
B/C Non-basal-like 849 161 (19.0) 0.47 (0.29 to 0.74) .001
RFS as a function of treatment (arm A vs arm B/C) by subtype
A Basal-like 38 13 (34.2) 1.0 (Ref)
B/C Basal-like 59 20 (33.8) 1.06 (0.53 to 2.13) .87
A Non-basal-like 446 123 (27.5) 1.0 (Ref)
B/C Non-basal-like 849 161 (19.0) 0.65 (0.51 to 0.82) <.001
RFS by ER/PR status as a function of arm within nonbasal tumors
A ER/PR-negative 192 54 (28.1) 1.0 (Ref)
A ER/PR-positive 254 69 (27.2) 0.90 (0.63 to 1.28) .55
B/C ER/PR-negative 381 76 (19.9) 1.0 (Ref)
B/C ER/PR-positive 468 85 (18.2) 0.84 (0.62 to 1.14) .27
RFS by treatment arm and ER/PR status with nonbasal tumors
A ER/PR-negative 192 54 (28.1) 1.0 (Ref)
B/C ER/PR-negative 381 76 (19.9) 0.67 (0.47 to 0.95) .02
A ER/PR-positive 254 69 (27.2) 1.0 (Ref)
B/C ER/PR-positive 468 85 (18.2) 0.62 (0.45 to 0.85) .003
*Cox model analysis was carried out to compare relapse-free survival between basal-like and nonbasal tumors in arm A or in arm C. In addition, the Cox model was used to compare outcome as a function of treatment (arm A vs arm B/C) as a function of basal-like or nonbasal subtype. Test for interaction of arm and basal subtype statusP¼.20. A Cox model analysis was used to define hazard ratio (HR) for recurrence as a function of estrogen receptor/progesterone receptor (ER/PR) status and treatment. Wald Chi-squaredPvalues were calculated from the Cox model data. The effect of treatment (arm A vs arm B/C) is shown as a function of ER/PR status. Test for interaction of arm and HR statusP¼.79. All statistical tests were two-sided. ER¼estrogen receptor–alpha, the product ofESR1; HER2¼human epidermal growth factor receptor; PR¼progesterone receptor, the product ofPGR; Ref¼referent; RFS¼relapse-free survival, as defined in “Methods.”
Drs. Edith A. Perez, E. Aubrey Thompson, and Karla V. Ballman had full access to all the data in the study, and these individuals take full responsibility, jointly and severally, for the integrity of the data and the accuracy of the data analysis.
Potential conflicts of interest include Nanostring employment for Drs. Mashadi-Hossein and Ferree. Dr. Perou is a board of direc-tor’s member, consultant, and stock holder in Bioclassifier LLC, as well as a patent applicant on PAM50 assay with royalties paid to Nanostring Technologies. Dr. Cheang has a patent, “Gene expres-sion profiles to predict breast cancer outcomes (PAM50 classifier),” issued. Dr. Baehner is an employee of Genomic Health, Inc. All other authors declare no conflicts of interest.
Dr. Perez was involved in the conception and design of the manuscript, as well as provision of the study material or pa-tients. Collection and assembly of data were provided by Drs. Ballman and Perez. Dr. Thompson had overall responsibility for data accumulation, analysis, and interpretation. All authors contributed to the analysis and interpretation of data, as well as drafting and final approval of the manuscript, and all authors agree to be accountable for all aspects of the work.
REFERENCES
1. Perou CM, Sorlie T, Eisen MB, et al. Molecular portraits of human breast tumours.Nature.2000;406(6797):747–752.
2. Parker JS, Mullins M, Cheang MC, et al. Supervised risk predictor of breast cancer based on intrinsic subtypes.J Clin Oncol.2009;27(8):1160–1167. 3. Perou CM, Parker JS, Prat A, Ellis MJ, Bernard PS. Clinical implementation of
the intrinsic subtypes of breast cancer. Lancet Oncol.2010;11(8):718–719; author reply 720-711.
4. Chia SK, Bramwell VH, Tu D, et al. A 50-gene intrinsic subtype classifier for prognosis and prediction of benefit from adjuvant tamoxifen.Clin Cancer Res. 2012;18(16):4465–4472.
5. Dowsett M, Sestak I, Lopez-Knowles E, et al. Comparison of PAM50 risk of recurrence score with oncotype DX and IHC4 for predicting risk of dis-tant recurrence after endocrine therapy. J Clin Oncol. 2013;31(22): 2783–2790.
6. Esserman LJ, Berry DA, Cheang MC, et al. Chemotherapy response and recur-rence-free survival in neoadjuvant breast cancer depends on biomarker pro-files: results from the I-SPY 1 TRIAL (CALGB 150007/150012; ACRIN 6657).
Breast Cancer Res Treat.2012;132(3):1049–1062.
7. Perez EA, Romond EH, Suman VJ, et al. Four-year follow-up of trastuzumab plus adjuvant chemotherapy for operable human epidermal growth factor receptor 2-positive breast cancer: joint analysis of data from NCCTG N9831 and NSABP B-31.J Clin Oncol.2011;29(25):3366–3373.
8. Perez EA, Romond EH, Suman VJ, et al. Trastuzumab plus adjuvant chemo-therapy for human epidermal growth factor receptor 2-positive breast can-cer: planned joint analysis of overall survival from NSABP B-31 and NCCTG N9831.Journal of clinical oncology: official journal of the American Society of Clinical
Oncology.2014;32(33):3744–3752.
9. Perez EA, Baehner FL, Butler SM, et al. The relationship between quantitative human epidermal growth factor receptor 2 gene expression by the 21-gene reverse transcriptase polymerase chain reaction assay and adjuvant trastu-zumab benefit in Alliance N9831.Breast Cancer Res.2015;17(1):133.
10. Network TCGA. Comprehensive molecular portraits of human breast tumours.Nature.2012;490(7418):61–70.
11. Prat A, Bianchini G, Thomas M, et al. Research-based PAM50 subtype predic-tor identifies higher responses and improved survival outcomes in HER2-positive breast cancer in the NOAH study.Clinical cancer research: an official
journal of the American Association for Cancer Research.2014;20(2):511–521.
12. Pogue-Geile KL, Song N, Jeong JH, et al. Intrinsic Subtypes, PIK3CA Mutation, and the Degree of Benefit From Adjuvant Trastuzumab in the NSABP B-31 Trial.Journal of clinical oncology: official journal of the American Society of Clinical
Oncology. 2015.
13. Prat A, Carey LA, Adamo B, et al. Molecular features and survival outcomes of the intrinsic subtypes within HER2-positive breast cancer.Journal of the
National Cancer Institute.2014;106(8).
ARTI