FACTORS REGULATING METHANE PRODUCTION AND OXIDATION IN TWO SHALLOW ARCTIC ALASKAN LAKES
Dendy Diane Lofton
A dissertation submitted to the faculty of the University of North Carolina at Chapel Hill in partial fulfillment of the requirements for the degree of Doctor of Philosophy in the
Department of Environmental Sciences and Engineering.
Chapel Hill 2012
Approved by: Stephen C. Whalen Larry K. Benninger Anne E. Hershey Rachel T. Noble
iii ABSTRACT
Dendy Diane Lofton: Factors Regulating Methane Production and Oxidation in Two Shallow Arctic Alaskan Lakes
(Under the direction of Dr. Stephen C. Whalen)
Methane (CH4) is second only to CO2 as a greenhouse gas and is produced in the terminal step of organic matter decomposition in anaerobic environments, including lake sediments. Given the widespread distribution of lakes in Arctic Alaska, CH4 emission from these lakes may significantly contribute to the atmospheric CH4 budget. Aerobic methane oxidizing bacteria consume CH4 diffusing from anaerobic zones of production, thereby modulating the flux of CH4 to the atmosphere. Multiple research efforts indicate a significant source strength for arctic environments in the atmospheric CH4 budget. Predicted climate induced alterations to the arctic landscape include increased organic matter loading from the terrestrial
environment and increased temperature. These environmental changes can influence both
rates of CH4 production and oxidation, possibly altering rates of CH4 exchange between shallow arctic lakes and the atmosphere.
iv
in one lake only. However, there was no consistent relationship between rates of methanogenesis and depth of the overlying water as labile organic matter in the shallow sediments are likely resuspended and deposited unevenly by wind action. Under extant conditions, rates of methanogenesis responded positively to increases in temperature, while rates of CH4 oxidation remained unchanged. The former were controlled by substrate x
v
vi
ACKNOWLEDGEMENTS
Years of dedication, perseverance, and an unquenchable desire for knowledge and adventure have led to the culmination of the work presented in this dissertation. I am fortunate to have been advised by Dr. Steven C. Whalen throughout this journey.I am grateful for his
patience, his realistic approach to scientific inquiry and his professional candor. Through his guidance and instruction, I have grown as a scientist and as a writer, for which I am forever indebted.
My career would not have advanced to this point without the direction of Dr. Anne E. Hershey. I have always found her excitement for scientific research to be admirable and
contagious, and I am thankful for her advice, encouragement and mentoring over the course of my graduate career. I would also like to thank my committee members who have provided me with countless advice in an effort to improve my dissertation project. My most sincere
appreciation is extended to Drs. Larry K. Benninger, Rachel T. Noble and Michael F. Piehler. Conducting field work in Arctic Alaska has been the most challenging and rewarding accomplishment of my life. The work presented in this dissertation would not have been possible without the help of several people. Specifically, I would like to thank Tim Yarborough, Gabe McGowan, Amy Strohm, Melissa Saunders and Kristen Bretz for their indefatigable efforts in the field and in the lab to help me accomplish these objectives. Additional support,
vii
Undoubtedly, this work would not have been possible without the help of many. Further field and laboratory assistance was provided by Drs. Cody R. Johnson and Kenneth Fortino. As my colleagues, they have each contributed in immeasurable ways to my project and to the progression of my professional growth as a scientist. More importantly, I am forever grateful for their friendship that was strengthened during our times at Toolik Field Station and beyond. Our nighttime jam sessions full of strings and songs certainly made the long arduous workdays seem more relaxing and the stressful times seem more enjoyable.
Spending five summers at the Toolik Field Station facilitated the creation of a surrogate family for me. Because of Elissa Schuett, Julia LaRouche, Angela Allen and Jennifer Kostzrewski, I always joyfully awaited our summer reunions. I want to thank them for keeping a smile on my face and for being the foundation of my Toolik family. I have leaned on each of them in a myriad of ways and am thankful for the advice, the inexhaustible laughter and the lifelong friendships. Further appreciation is extended to Jennifer Kostrzewski. She has been my lighthouse in the storm and I am eternally grateful for her support and encouragement. Undoubtedly, I am a better person because of her presence in my life.
Without the unending encouragement and assurance from my family and friends, this dissertation would not have been possible. The unconditional love and support that I have received from each of them has carried me through all the peaks and valleys of my career. I would not be the person I am today, without their love and support.
viii
This study was funded in part by two National Science Foundation grants (0807094 and 0516043) as well as an award from the North Carolina Association of Environmental
ix
TABLE OF CONTENTS
LIST OF TABLES ...xiii
LIST OF FIGURES ... xv
LIST OF ABBREVIATIONS AND SYMBOLS ... xviii
CHAPTER 1: INTRODUCTION ... 1
1.1 Methane ... 1
1.2 Methanogenesis ... 1
1.3 Spatial Variation in Sediment Methane Production ... 4
1.4 Effect of Temperature on Methanogenesis ... 5
1.5 Methane Oxidation ... 5
1.6 Effect of Temperature on Mox Rates ... 6
1.7 Methane Oxidation Kinetics ... 7
1.8 Arctic Lakes and Future Climate Change... 8
1.9 Research Objectives ... 9
1.10 Dissertation Structure ... 10
REFERENCES ... 11
CHAPTER 2: VERTICAL DISTRIBUTION OF METHANOGENIC PATHWAYS IN THE SEDIMENTS OF TWO SHALLOW ARCTIC LAKES ... 16
x
2.2 Materials and Methods ... 18
2.2.1 Field Sites ... 18
2.2.2 Field Sampling ... 19
2.2.3 Laboratory Studies ... 19
2.2.4 Calculations and Statistics ... 22
2.3 Results ... 23
2.4 Discussion ... 27
2.4.1 Total Methanogenesis ... 27
2.4.2 Unamended Treatments ... 27
2.4.3 Substrate Additions... 32
2.4.4 Pathway Delineation ... 32
2.5 Conclusion ... 35
REFERENCES ... 37
TABLES AND FIGURES ... 43
CHAPTER 3: SPATIAL VARIATION OF METHANOGENESIS AMONG LAKE ZONES ... 59
3.1 Introduction ... 59
3.2 Materials and Methods ... 60
xi
3.2.2 Field Sampling ... 61
3.2.3 Laboratory Studies ... 62
3.2.4 Calculations and Statistics ... 65
3.3 Results ... 68
3.4 DISCUSSION ... 72
3.4.1 Rates of Methanogenesis Among Zones ... 72
3.4.2 Environmental Controls on Rates of MG ... 74
3.4.3 Estimation of Methane Flux from Zones ... 75
3.5 Conclusion ... 76
REFERENCES ... 79
TABLES AND FIGURES ... 83
CHAPTER 4: THE INFLUENCE OF TEMPERATURE ON METHANE PRODUCTIONAND OXIDATION AND EVALUATION OF KINETIC CONSTANTS FOR METHANEOXIDATION ... 99
4.1 Introduction ... 99
4.2 Materials and Methods ... 102
4.2.1 Field Sites ... 102
4.2.2 Field Sampling ... 103
4.2.3 Laboratory Studies ... 104
xii
4.3 Results ... 109
4.3.1 Rates of CH4 Production as a Function Temperature ... 109
4.3.2 Rates of CH4 Oxidation as a Function of Temperature ... 110
4.3.3 Methane Production versus Methane Oxidation ... 110
4.3.4 Kinetics of CH4 Oxidation ... 111
4.4 Discussion ... 112
4.4.1 Influence of Temperature on Methanogenesis ... 112
4.4.2 Influence of Temperature on Methane Oxidation ... 113
4.4.3 Kinetics of Methane Oxidation ... 115
4.4.4. Methane Production versus Methane Oxidation ... 118
4.5 Conclusion ... 119
REFERENCES ... 121
TABLES AND FIGURES ... 126
CHAPTER 5: CONCLUSION ... 137
xiii LIST OF TABLES
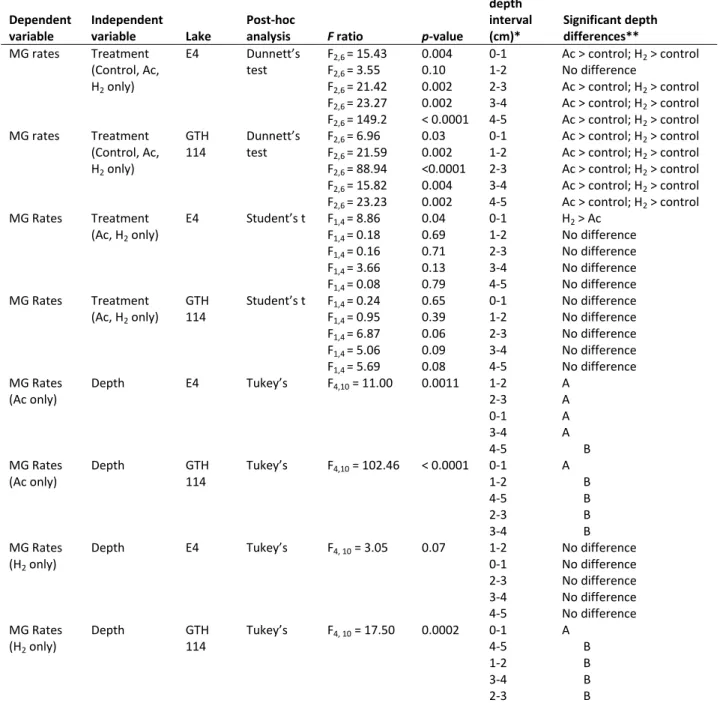
Table 2.1. Morphological characteristics of study lakes. ... 43 Table 2.2. Results of individual One-way ANOVA’s evaluating the effect of sediment
depth increment or substrate additions on unamended rates of methanogenesis in E4 and GTH 114. ... 44
Table 2.3. Results of individual One-way ANOVA’s evaluating the effect of acetate or hydrogen (H2) substrate additions on rates of methanogenesis ... 45 Table 2.4. Results of individual One-way ANOVA’s evaluating the effect of sediment
xiv
Table 3.9. Results of One-Way ANOVA analyzing the main effect of sediment zone on sediment temperature in GTH 114. ... 86 Table 3.10. Spearman’s rank correlation coefficients (rs) for the association between
log-transformed rates of methanogenesis and environmental variables in E4 and GTH 114 ... ………...………….87 Table 3.11. Results of One-Way ANOVA analyzing the effect of zone on sediment
porewater CH4 profiles in E4. ... 88 Table 3.12. Results of One-Way ANOVA analyzing the effect of zone on sediment
porewater CH4 profiles in GTH 114. ... 88 Table 3.13. Potential methane flux from surficial sediments into the overlying water column in the lake zones in E4 and GTH 114. ... 89 Table 4.1. Mean CH4 production ± 1 SEM (µmol CH4 L-1 d-1) in sediment slurries ... 126 Table 4.2. Results of the Analysis of Covariance (ANCOVA) evaluating the effects
of lake and temperature (°C) on log-transformed rates of methanogenesis ... 127 Table 4.3. Mean CH4 consumption ± 1 SEM (µmol CH4 L-1 d-1) in sediment slurries ... 128 Table 4.4. Results of the Analysis of Covariance (ANCOVA) evaluating the effects of lake and temperature on rates of methane oxidation ... 129 Table 4.5. Results of the Analysis of Covariance (ANCOVA) comparing log-transformed
methane production to log-transformed methane oxidation after controlling
for the influence of the covariate temperature in E4 from 2010 ... 130 Table 4.6. Results of the Analysis of Covariance (ANCOVA) comparing log-transformed methane production to log-transformed methane oxidation after controlling
xv
LIST OF FIGURES
Figure 2.1. Dissolved oxygen and temperature profiles in the water column of E4
taken during the summer of 2008.. ... 49 Figure 2.2. Dissolved oxygen and temperature profiles in the water column of GTH 114
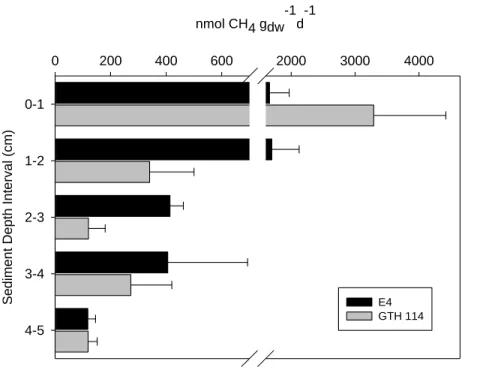
taken during the summer of 2008. ... 50 Figure 2.3. Depth distribution of unamended rates of methanogenesis in E4 and
GTH 114. ... 51 Figure 2.4. Depth distribution of rates of methanogenesis in E4 in response to
amendments with methanogenenic substrates ... 52 Figure 2.5. Depth distribution of rates of methanogenesis in GTH 114 in response to amendments with methanogenenic substrate ... 52 Figure 2.6. Percent increase in rates of methanogenesis in response to methanogenic
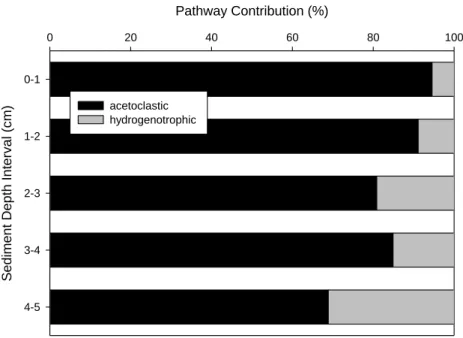
substrate additions relative to unamended treatments in E4 and GTH 114 ... 53 Figure 2.7. Depth distribution of the relative proportion of acetoclastic and
hydrogenotrophic pathways in in E4 in 2008. ... 54 Figure 2.8. Depth distribution of the relative proportion of acetoclastic and
hydrogenotrophic pathways in GTH 114 in 2008. ... 54 Figure 2.9. Dissolved organic carbon concentrations plotted at the midpoint of each
sampling interval for sediment samples in E4 and GTH 114 porewater taken
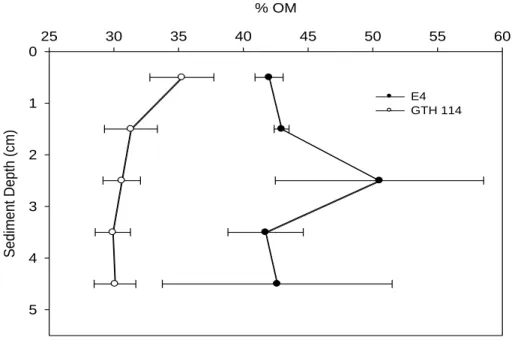
from the deepest point in each lake in July 2008. ... 55 Figure 2.10. Organic matter profiles plotted at the midpoint of each sampling interval
for sediment samples taken from the deepest point of lakes E4 and GTH 114 ... 56 Figure 2.11. Scatterplot of unamended rates of methanogenesis versus organic
matter content at a corresponding depth interval in E4 and GTH 114 ... 57 Figure 2.12. Scatterplot of the rates of methanogenesis from the acetoclastic or
hydrogenotrophic pathways versus organic matter at the corresponding
depth interval in E4. ... 58 Figure 2.13. Scatterplot of the rates of methanogenesis from the acetoclastic or
hydrogenotrophic pathways versus organic matter at the corresponding
xvi
Figure 3.1. Distribution of rates of methanogenesis among sediment zones
in E4 in 2010. ... 90 Figure 3.2. Distribution of rates of methanogenesis among sediment zones in
GTH 114 in 2010 ... 91 Figure 3.3. Water column dissolved organic carbon concentrations in the
epilimnion and hypolimnion of E4 and GTH 114 across multiple days ... 92 Figure 3.4. Dissolved organic carbon concentrations in E4 porewater taken from
profundal and epilimnetic sediments in E4 in July 2008 ... 93 Figure 3.5. Dissolved organic carbon concentrations in GTH 114 porewater
taken from profundal and epilimnetic sediments in July 2008 ... 93 Figure 3.6. Percent organic matter content plotted at the midpoint of each sampling
interval for sediment samples collected from defined lake zones
in E4 and GTH 114 in July 2009 ... 94 Figure 3.7. Sediment temperature profiles taken in July 2009 from profundal, epilimnetic and littoral sediments in E4 ... 95 Figure 3.8. Sediment temperature profiles taken in July 2009 from profundal, epilimnetic and littoral sediments in GTH 114 ... 95 Figure 3.9. The relationship between mean rates of methanogenesis and mean
percent organic content among sediment zones in E4 ... 96 Figure 3.10. The relationship between mean rates of methanogenesis and mean
percent organic content among sediment zones in GTH 114 ... 96 Figure 3.11. The relationship between mean rates of methanogenesis and mean
sediment temperature among sediment zones in E4 ... 97 Figure 3.12. The relationship between mean rates of methanogenesis and mean
sediment temperature among sediment zones in GTH 114 ... 97 Figure 3.13. Sediment CH4 profiles taken in July 2009 from profundal, epilimnetic
and littoral sediments in E4 and GTH 114. ... 98 Figure 4.1. Simple linear regression of log-transformed rates of methanogenesis
xvii
Figure 4.2. Simple linear regression of log-transformed rates of methanogenesis on
incubation temperature in GTH 114 in 2010. ... 131 Figure 4.3. Water column methane profiles taken from zone of maximum water
depth in 2008. ... 132 Figure 4.4. Simple linear regression of methane oxidation rate on temperature
in E4 in 2010. ... 133 Figure 4.5. Simple linear regression of methane oxidation rate on temperature in
GTH 114 in 2010. ... 133 Figure 4.6. Mean rates of CH4 loss from the headspace in serum vials containing
hypolimnetic water from E4 and GTH 114 and incubated at varying
temperatures under substrate-limiting conditions in 2009 ... 134 Figure 4.7. Mean log-transformed rates of methanogenesis vs. log-transformed rates of methane oxidation in 2010. ... 135 Figure 4.8. The effect of methane concentration (µM) on water column methane
oxidation rates in E4 in 2010. ... 136 Figure 4.9. The effect of methane concentration (µM) on water column methane
xviii
LIST OF ABBREVIATIONS AND SYMBOLS
MG methanogenesis
MOB methane oxidizing bacteria Mox methane oxidation
OM organic matter
DOC dissolved organic carbon
dw dry weight
Js flux of CH4 (µmol CH4 m-2 s-1) sediment porosity (unitless)
c/x change in CH4 concentration with depth (µmol CH4 cm-3 cm-1)
Ds effective diffusivity (cm2 s-1)
D0 diffusivity of CH4 at 10°C (1.25 x 10⁻⁵ cm2 s-1 tortuosity (unitless)
Q10 change in rate associated with a 10°C temperature increase Vmax maximum rate of CH4 oxidation (µmol CH4 L-1 d-1)
CHAPTER 1: INTRODUCTION 1.1 Methane
Methane (CH4) is a radiatively and chemically important trace atmospheric constituent that is over twenty times more influential in terms of radiative forcing than CO2 on a per molecule basis (Whalen 2005). Production of methane results from multiple natural and anthropogenic sources with wetlands comprising roughly 20% of total atmospheric emissions (Whalen and Reeburgh 2000). Global atmosphere concentrations of CH4 have been increasing in recent decades (Whalen 2005) with the highest observed concentrations appearing over the arctic and subarctic regions due to the high concentration of wetlands (Semiletov 1999). Tundra environments encompass approximately 7% of earth’s surface (Whalen and Reeburgh 1992) with up to 50% of that areal coverage comprised of shallow ponds in some regions. On a global basis, shallow arctic lakes may occupy approximately 2% of total land surface (Sheath 1986). Although arctic lakes have been studied less frequently than terrestrial tundra environments in terms of CH4 efflux to the atmosphere, their contribution to the global CH4 cycle is likely
significant due to shallow depth and broad areal coverage (Bastviken et al. 2004; Semiletov 1999).
1.2 Methanogenesis
2
the decomposition of OM through a series of reduction-oxidation reactions with each step providing substrate(s) for the next phase. Physiologically, microbes carrying out these
processes utilize the energy obtained from redox reactions for cellular growth and maintenance (Zehnder and Stumm 1988). Energy yield for microbial oxidation of OM is greatest when O2 is an oxidant, while the least amount of energy is available through fermentative CH4 producing pathways. Consequently, methanogens are outcompeted for substrates by other microbial groups (Capone and Kiene 1988; Schink 1997). Direct competition with methanogens for substrates is most likely with groups capable of synthesizing acetate (acetogens) and/or
reducing sulfate (SO42-) and iron (Fe3+) (Zinder 1993). Sulfate concentrations are typically low (< 200 µM) in freshwater sediments (Capone and Kiene 1988), so direct substrate competition with SO42- reducers should be minimal compared to acetogens and Fe3+ reducers.
Methanogens are Archaeobacteria that exhibit a relatively large substrate range,
although most species can only utilize one or two substrates (Zinder 1993). The three catabolic pathways are acetoclastic, hydrogenotrophic and methylotrophic, which enable production of CH4 from acetate, formate, H2/CO2, methanol, carbon monoxide and methylated amines (Zinder 1993). Energy yields for each substrate vary with the highest availability from utilization of acetate followed by H2/CO2 (Oremland 1988). Consequently, these two pathways are dominant in freshwater sediments with most studies reporting a 2:1 ratio of acetoclastic to
hydrogenotrophic pathways (Nusslein and Conrad 2000).
3
and Conrad 1996). Substrate availability depends largely on the presence and activity of the microbial consortium leading to the terminal stages of OM degradation. The variation in the relative proportion of the two dominant pathways has rarely been examined in lake sediments. However, Conrad (2005) found that sediments characterized by younger OM often show higher activity of the acetoclastic pathway whereas sediments characterized by older, more
recalcitrant OM are typically dominated by the hydrogenotrophic pathway. In addition, the hydrogenotrophic pathway may be enhanced in higher temperatures due to the increased activity of the bacterial consortium responsible for H2/CO2 generation required by
hydrogenotrophic methanogens (Schulz et al. 1997). Temperature will control rates of both processes, but may differentially influence the relative contribution of each pathway to total MG by increasing availability of direct substrates at different rates.
Terrestrial inputs of dissolved organic carbon (DOC) to a lake system may also influence rates of MG. Houser et al. (2003) found a positive correlation between epilimnetic DOC
concentrations (allochthonous origin) and hypolimnetic CH4 accumulation. In their study, hypolimnetic concentration of DOC decreased proportionally with increases in dissolved inorganic carbon (DIC) + CH4 in 19 of 21 lakes, suggesting hypolimnetic metabolism was supported by incoming DOC (Houser et al. 2003). Autochthonous DOC resulting from
decomposition of algal biomass also strongly influence rates of MG, particularly the acetoclastic pathway (Schulz and Conrad 1996; Schwarz et al. 2008). DOC within a lake system may be derived from allochthonous or autochonous sources; however, a large portion of the
4
OM, particularly during snowmelt and precipitation events (Michaelson et al. 1998). Several studies suggest that melting permafrost and elevated terrestrial plant productivity will increase OM loading to arctic lakes as a result of ongoing climate change (Neff and Hooper 2002; Rouse et al. 1997; Shaver et al. 1992). Consequently, increased inputs of terrestrially derived OM may lead to higher rates of CH4 production in shallow Arctic Alaskan lakes.
1.3 Spatial Variation in Sediment Methane Production
Sediment methane flux varies spatially and temporally within a lake ecosystem. Most studies of MG have historically focused on the profundal regions of the lake. However, the proportion of OM (quantity and quality), disturbance frequency (e.g., sediment resuspension), sediment temperature and composition can vary significantly among habitats within a lake (Bastviken et al. 2008; Bussman 2005; Casper 1996) and all are known to influence
methanogenic activity. Higher sediment temperatures along lake margins can also contribute to higher rates of MG in comparison to profundal zones (Murase et al. 2005). Therefore, any extant variation of these characteristics within a lake ecosystem can result in variations in CH4 production rates among lake zones. Consequently, targeted research centered on one region of a lake may not capture the range of methanogenic activity in that water body.
5
within a lake ecosystem is imperative for adequate estimation of a lake’s potential CH4 productivity although incorporation of all these factors into a single study is challenging and costly.
1.4 Effect of Temperature on Methanogenesis
Several studies have reported the positive influence of temperature on rates of MG (Zeikus and Winfrey 1976; Thebrath et al. 1993; Schulz and Conrad 1996; Schulz et al. 1997; Segers 1998; Duc et al. 2010). The individual pathways leading to MG may be differentially altered by fluctuations in temperature. Schulz et al. (1997) reported an increase in the hydrogenotrophc pathway relative to the acetoclastic pathway with increased sediment temperature. In general, however, it is not clear if increased temperature specifically impacts the activity of the methanogens and/or the bacterial consortium responsible for MG substrate generation (Schulz et al. 1997). Methanogenic response to temperature varies considerably across ecosystems with higher values occurring in regions with higher quantities and qualities of OM (Segers 1998; Duc et al. 2010). Thus, predicted increases in surface air temperatures and OM delivery to the lakes as a consequence of a changing climate may significantly stimulate rates of MG in shallow arctic lakes. Consequently, measurement of the effect of temperature on MG rates in shallow arctic lakes under the present climactic conditions may provide insight into the future response of MG in lake sediment.
1.5 Methane Oxidation
6
larger group, the methylotrophs, which utilize one-carbon compounds as their carbon and energy source for cellular growth and maintenance (Hanson and Hanson 1996). Oxidation of CH4 (Mox) is most common in aerobic habitats with highest rates generally proceeding at the oxic-anoxic interface (Kankaala et al. 2006). Methane oxidizing bacteria also represent an important ecological linkage between benthic and pelagic food webs (Bastiviken et al. 2003; Kankaala et al. 2006; Sundh et al. 2005). Consumption of methanotrophs by pelagic
invertebrates (e.g., zooplankton) functions to transfer CH4 derived carbon to higher trophic levels (Bastiviken et al. 2003). Similarly, methanotrophy may also fuel benthic invertebrate metabolism. Hershey et al. (2006) found that off-shore macroinvertebrates, particularly, chironomids, were depleted in δ13C, indicating utilization of MOB as a food resource. Consequently, MOB play a major role in the food web of some arctic lake ecosystems. The importance of methane derived carbon in foodwebs is likely to be most important in smaller oligotrophic lakes with well oxygenated bottom waters where MOB are abundant at the sediment water interface (Hershey et al. 2006). Consequently, increased CH4 consumption induced by greater rates of MG may significantly alter lake food web ecology. Furthermore, increased rates of MG without a proportional increase in Mox in lacustrine arctic environments may increase their relative contribution to the global atmospheric CH4 budget.
1.6 Effect of Temperature on Mox Rates
7
adaptation to different temperatures may occur (Hanson and Hanson 1996). Considerable activity below 7˚C suggesting the presence of psychrophilic methanotrophs (Sundh et al. (2005). Methanotrophic response to temperature can be explained by a Q10 value which reflects the change in Mox rates associated with a 10°C increase in temperature (Duc et al. 2010). The literature values of Q10 for CH4 oxidation in northern peatlands range from 1.4 to 2.1 (Dunfield et al. 1993) although temperature is likely to be a more important driver of Mox rates at higher CH4 concentrations as activity shifts from substrate limitation to enzyme-activity limitation, particularly if populations prove to be pychrophillic (Sundh et al. 2005; Whalen and Reeburgh 1996). The role of temperature as a regulator of Mox rates is poorly understood in freshwater lakes and determinations of the temperature-dependence of Mox rates in arctic lakes is non-existent. Therefore, evaluation of the influence of temperature on rates of Mox is essential to understanding how this regulatory process may be impacted by rising mean air temperatures in the arctic region as increasing lake water temperatures will likely follow (Overpeck et al. 1997; Christoffersen et al. 2008; Post et al. 2009; Flury et al. 2010).
1.7 Methane Oxidation Kinetics
Oxidation of CH4 in lakes is controlled largely by substrate concentration, O2 availability and temperature to a lesser degree in most cases (Liikanen et al. 2002). The maximum CH4 uptake rate (Vmax) is dependent upon substrate concentration and is indicative of the
8
1997; Knief and Dunfield 2005) while the Km for atmospheric CH4 oxidizers is much lower (10 to 280 nM CH4) (Knief and Dunfield 2005). This lower Km is generally accompanied by low Vmax as well (Bender and Conrad (1992). Comparison of these constants will indicate differences in community structure and physiology which may lend insight into the ability for Mox
communities in arctic lakes to accommodate higher CH4 concentrations that may be associated with ongoing climate change.
1.8 Arctic Lakes and Future Climate Change
9
key role in the carbon cycling of lakes (den Heyer and Kalff 1998). Further, the extensive areal coverage of lakes across the arctic landscape dramatically increases their relative contribution to the global atmospheric budget in a disproportionate manner. Consequently, continued climate change may augment the magnitude of CH4 emitting from arctic lakes if microbial consumption of CH4 does not mediate increased CH4 flux from the sediments. Therefore, increased OM loading from the terrestrial landscape has the potential to significantly impact CH4 cycling in these shallow lakes with ramifications for positive feedback to lake CH4 emissions in the arctic.
1.9 Research Objectives
The overall goal of this research was to evaluate the landscape and within-lake scale factors regulating microbial production and consumption of methane in two representative Arctic Alaskan lakes under current climatic conditions in an effort to better understand the response of these communities to predicted changes in environmental variables that control their activities. Specific research objectives are as follows:
1. Determine the relative importance of dominant methanogenic pathways in arctic lakes, the factors regulating vertical distribution of methanogenic activity and the
community response to added substrates;
2. Quantify within lake spatial variability of CH4 production in three major lake zones (maximum water depth, ½ maximum water depth and littoral zone);
10
conducted for MG due to community involvement in production of methanogenic precursors and the presence of multiple pathways of microbial CH4 production.
1.10 Dissertation Structure
11 REFERENCES
Bartlett K.B., Crill P.M., Sass R.L., Harriss R.C. and N.B. Dise. 1992. Methane emissions from tundra environments in the Yukon-Kuskokwim Delta, Alaska.Journal of Geophysical Research 97(D15): 16645-16660.
Bastviken D., Cole J., Pace M. and L. Tranvik. 2004. Methane emissions from lakes: Dependence of lake characteristics, two regional assessments, and a global estimate. Global
Biogeochemical Cycles 18(4): doi: 10.1029/2004GB002238.
Bastviken D., J.J. Cole, M.L. Pace, and M.C. Van de Bogert. 2008. Fates of methane from different lake habitats: connecting whole-lake budgets and CH4 emissions. Journal of Geophysical Research 1113, G02024,doi: 10.1029/2007JG000608.
Bender M. and R. Conrad. Kinetics of CH4 oxidation in oxic soils exposed to ambient air or high CH4 mixing ratios. FEMS Microbiology Ecology 101: 261-270.
Buchholz L.A., J.V. Klump, M.L.P. Collins, C.A. Brantner and C.C. Remsen. 1995. Activity of methanotrophic bacteria in Green Bay sediments. FEMS Microbiology Ecology 16: 1-8. Bussman, I. 2005. Methane release through resuspension of littoral sediment. Biogeochemistry
74: 283-302.
Capone D.G. and R.P. Kiene. Comparison of microbial dynamics in marine and freshwater sediments: Contrasts in anaerobic carbon catabolism. Limnologyand Oceanography 33(4): 725-749.
Casper P. 1996. Methane production in littoral and profundal sediments of an oligotrophic and a eutrophic lake. Archiv fur Hydrobiologie: Special Issues in Advanced Limnology
48: 253-259.
Chapin III. F.S., McGuire A.D., Randerson J., Pielke Sr. R., Baldocchi D. Hobbie SE. Roulet N., Eugster W., Kasischke E., Rastetter E.B., Zimov S.A. and S.W. Running. 2000. Arctic and boreal ecosystems of western North America as components of the climate system.
Global Change Biology 6(Supplement 1):211-223.
Christoffersen K.S., S.L. Amsinck, F. Landkildehus, T.L. Lauridsen, and E. Jeppesen. 2008. Lake flora and fauna in relation to ice-melt, water temperature and chemistry at Zackenberg.
Advances in Ecological Research 40:371-389.
12
den Heyer C. and J. Kalff. 1998. Organic matter mineralization rates in sediments: a within- and among-lake study. Limnology and Oceanograpy 43(3): 695-705.
De Visscher A., M. Schippers and O. Van Cleemput. 2001. Short-term kinetic response of
enhanced methane oxidation in landfill cover soils to environmental factors. Biology and Fertility of Soils 33: 231-237.
Dlugokencky E.J., L Bruhwiler, J.W.C. White, L.K. Emmons, P.C. Novelli, S.A. Montzka, K.A. Masarie, P.M. Lang, A.M. Crotwell, J.B. Miller and L.V. Gatti. 2009. Observational
constraints on recent increases in the atmospheric burden. Geophysical Research Letters
36, L18803, doi:10.1029/2009GL039780.
Duc N.T., P. Crill and D. Basviken. 2010. Implications of temperature and sediment
characteristics on methane formation and oxidation in lake sediments. Biogeochemistry
100: 185-196.
Flury S., D.F. McGinnis, and M.O. Gessner. 2010. Methane emissions from a freshwater marsh in response to experimentally simulated global warming and nitrogen
enrichment. Journal of Geophysical Research 115, G01007, doi: 10.1029/2009JG001079. Hanson R.S. and T.E. Hanson. 1996. Methanotrophic Bacteria. Microbiological Reviews
60(2): 439-471.
Hershey A.E., S. Beaty, K. Fortino, S. Kelly, M. Keyse, C. Luecke, W.J. O’Brien and S.C. Whalen. 2006. Stable Isotope signatures of benthic invertebrates in arctic lakes indicate limited coupling to pelagic production. Limnology and Oceanography 51(1): 177-188.
Houser J.N., Bade D.L., Cole J.J. and M.L. Pace. 2003. The dual influences of dissolved organic carbon on hypolimnetic metabolism: organic substrate and photosynthetic reduction. Biogeochemistry 64: 247-269.
Isaksen I.S.A., M. Gauss, G. Myhre, K.M. Walter Antony and C. Ruppel. 2011. Strong
atmospheric chemistry feedback to climate warming from Arctic methane emissions.
Global Biogeochemical Cycles 25, GB2002, doi: 10.1029/2010GB003845.
Kankaala P., Juotari J., Peltomaa E., Saloranta T. and A. Ojala. 2006. Methanotrophic activity in relation to methane efflux and total heterotrophic bacterial production in a stratified, humic, boreal lake. Limnology and Oceanography 51(2): 1195-1204.
Kankaala P., G. Eller and R.I. Jones. 2007. Could bacterivorous zooplankton affect lake pelagic methanotrophic activity? Archiv fur Hydrobiologie 169(3): 203-209.
13
Kling G.W., Kipphut W.G. and M.C. Miller. 1992. The flux of CO2 and CH4 from lakes and rivers in Arctic Alaska. Hydrobiologia 240: 23-36.
Liikanen A., J.T. Huttunen, K. Valli, and P.J. Martikainen. 2002. Methane cycling in the sediment and water column of mid-boreal hyper-eutrophic Lake Kevaton, Finland. Archiv Fur Hydrobiologie 154(4): 585-603.
Maxfield P.J., E.R.C. Hornibrook and R.P. Evershed. 2009. Substantial high-affinity methanotroph populations in Andisols effect high rates of atmospheric methane oxidation. Environmental Microbiology Reports 1(5): 450-456.
Michaelson G.J., Ping C.L., Kling G.W. and J.E. Hobbie. 1998. The character and bioactivity of dissolved organic matter at thaw and in the spring runoff waters of the arctic tundra north slope, Alaska. Journal of Geophysical Research 103(D22): 28,939-28,946.
Murase J., Y. Sakai, A. Kametani and A. Sugimoto. 2005. Dynamics of methane in mesotrophic Lake Biwa, Japan. Ecological Research 20: 377-385.
Nusslein B. and R. Conrad. 2000. Methane production in eutrophic Lake Plubsee: seasonal change, temperature effect and metabolic processes in the profundal sediment. Archiv fur Hydrobiologie 149(4): 597-623.
Oremland, R.S. 1988. Biogeochemistry of Methanogenic Bacteria, in Biology of Anaerobic Microorganisms. ed. A.J.B. Zehnder, pp. 641-705, John Wiley & Sons, Inc., New York. Overpeck J., K. Hughen, D. Hardy, R. Bradley, R. Case, M. Douglas, B. Finney, K. Gajewski, G.
Jacoby, A. Jennings, S. Lamoureux, A. Lasca, G. MacDonald, J. Moore, M. Retelle, S. Smith, A. Wolfe, and G. Zielinski. 1997. Arctic environmental change of the last four centuries. Science 278: 1251-1256.
Post E., MC. Forchhammer, M.S. Bret-Harte, T.V. Callaghan, T.R. Christensen, B. Elberling, A.D. Fox, O. Gilg, D.S. Hik, T.T. Hoye, R.A. Ims, E. Jeppesen, D.R. Klein, J. Madsen, A.D. McGuire, S. Rysgaard, D.E. Schindler, I. Stirling, M.P. Tamstorf, N.J.C. Tyler,
R. van der Wal, J. Welker, P.A. Wookey, N.M. Schmidt, and P. Aastrup. 2009. Ecological dynamics across the Arctic associated with recent climate change. Science
325: 1355-1358.
Rouse W.R., Douglas M.S.V., Hecky R.E., Hershey A.E., Kling G.W., Lesack L., Marsh P., McDonald M., Nicholson B.J., Roulet N.T. and J.P. Smol. 1997. Effects of climate change on the freshwaters of Arctic and subarctic North America. Hydrological Processes 11: 873-902. Schink, B. 1997. Energetics of Syntrophic Cooperation in Methanogenic Degradation.
14
Schulz, S. and R. Conrad. 1996. Influence of temperature on pathways to methane production in the permanently cold profundal sediment of Lake Constance. FEMS Microbiology Ecology 20: 1-14.
Schulz S., Matsuyama H. and R. Conrad. 1997. Temperature dependence of methane
production from difference precursors in a profundal sediment (Lake Constance) FEMS Microbiology Ecology 22: 207-213.
Schwarz J.I.K., W. Eckert and R. Conrad. 2008. Response of the methanogenic microbial community of a profundal lake sediment (Lake Kinneret, Israel)to algal deposition.
Limnology and Oceanography 53(1): 113-121.
Segers R. 1998. Methane production and methane consumption: a review of processes underlying wetland methane fluxes. Biogeochemistry 41: 23-51.
Semiltov I.P. 1999. Aquatic sources and sinks of CO2 and CH4 in the polar regions. Journal of the Atmospheric Sciences 56: 286-306.
Sheath, R.G. 1986. Seasonality of plankton in northern tundra ponds. Hydrobiologia 138: 75-83. Sundh I., D. Bastviken, and L. J. Tranvik. 2005. Abundance, Activity, and Community Structure of
Pelagic Methane-Oxidizing Bacteria in Temperature Lakes. Applied and Environmental Microbiology 71(11): 6746-6752.
Thebrath B., F. Rothfuss, M. J. Whiticar and R. Conrad. 1993. Methane production in littoral sediment of Lake Constance. FEMS Microbiology Ecology 102: 279-289.
Valentine, D.L. 2002. Biogeochemistry and microbial ecology of methane oxidation in anoxic environments: a review. Antonie van Leeuwenhoek 81: 271-282.
Walter K.M., S.A. Zimov, J.P. Chanton, D. Verbyla and F.S. Chapin III. 2006. Methane bubbling as a positive feedback to climate warming. Nature 443: doi: 10.1038/nature05040.
Walter K.M., Smith L.C. and F.S. Chapin III. 2007. Methane bubbling from northern lakes: present and future contributions to the global methane budget. Philosophical Transactions of the Royal Society 365: 1657-1676.
Wetzel, R.G. 2001. Limnology: Lake and river ecosystems, 3rd edition. Academic Press. Whalen S.C. 2005. Biogeochemistry of methane exchange between natural wetlands and
the atmosphere. Environmental Engineering Science 22(1): 73-94.
15
Whalen S.C. and W.S. Reeburgh. 1992. Interannual variations in tundra methane emission: a 4- year time series at fixed sites. Global Biogeochemical Cycles 6(2): 139-159.
Whalen S.C. and W.S. Reeburgh. 1996. Moisture and temperature sensitivity of CH4 oxidation in boreal soils. Soil Biology and Biochemistry 28(10/11): 1271-1281.
Whalen, S.C. and W.S. Reeburgh. 2000. Methane oxidation, production, and emission at contrasting sites in a boreal bog. Geomicrobiology Journal 17: 237-251.
Wrona F.J., Prowse T.D., Reist J.D., Hobbie J.E., Levesque L.M.J. and W.F. Vincent. 2006. Climate change effects on aquatic biota, ecosystem structure and function. Ambio
35(7): 359-369.
Zehnder A.J.B. and W. Stumm. 1988. Geochemistry and Biogeochemistry of Anaerobic Habitats, in Biology of Anaerobic Microorganisms. ed. A.J.B. Zehnder, pp. 1 – 35, John Wiley & Sons, Inc., New York, NY.
Zeikus J.G. and M.R. Winfrey. 1976. Temperature limitation of methanogenesis in aquatic sediments. Applied and Environmental Microbiology 31(1): 99-107.
Zimov S.A., Voropaev Y.V., Semiletov I.P., Davidov S.P., Prosiannikov S.F., Chapin III F.S., Chapin M.C., Trumbore S. and S. Tyler. 1997. North Siberian lakes: A methane source
fueled by Pleistocene carbon. Science 277: 800-802.
Zinder, S.H. 1993. Physiological Ecology of Methanogens, in MG: Ecology,Physiology,
CHAPTER 2: VERTICAL DISTRIBUTION OF METHANOGENIC PATHWAYS IN THE SEDIMENTS OF TWO SHALLOW ARCTIC LAKES
2.1 Introduction
Methane (CH4) is produced in the terminal step of organic matter (OM) degradation in anaerobic sediments. A consortium of microorganisms is responsible for decomposition of OM through a series of reduction-oxidation reactions with each step providing substrate(s) for the next phase. Physiologically, microbes carrying out these processes utilize the energy obtained from redox reactions for cellular growth and maintenance (Zehnder and Stumm 1988). Energy yield for microbial oxidation of OM is greatest when O2 is an oxidant, while the least amount of energy is available through fermentative CH4 producing pathways. Consequently, methanogens are outcompeted for substrates by other microbial groups (Capone and Kiene 1988; Schink 1997). Direct competition with methanogens for substrates is most likely with groups capable of synthesizing acetate (acetogens) or reducing sulfate (SO42-) or iron (Fe3+) (Zinder 1993). Sulfate concentrations are typically low (< 200 µM) in freshwater sediments (Capone and Kiene 1988), so direct substrate competition with SO42- reducers should be minimal compared to competition with acetogens and Fe3+ reducers.
17
and methylotrophic, which enable production of CH4 from acetate, formate, H2/CO2, methanol, carbon monoxide and methylated amines (Zinder 1993). Energy yields for each substrate vary with the highest availability from utilization of acetate followed by H2/CO2 (Oremland 1988). Consequently, these two pathways are dominant in freshwater sediments with most studies reporting a 2:1 ratio of acetoclastic to hydrogenotrophic pathways (Nusslein and Conrad 2000).
Many factors can influence both rates of methanogenesis (MG) and the ratio of these processes. The most notable factors influencing methanogenic activity are availability of direct substrates, quantity and quality of methanogenic precursors as well as temperature (Schulz and Conrad 1996; Conrad 2005). Substrate availability depends largely on the presence and activity of the microbial consortium leading to the terminal stages of OM degradation. The variation in the relative proportion of the primary methanogenic pathways has rarely been examined in lake sediments. However, Conrad (2005) found that sediments characterized by younger OM often show higher activity of the acetoclastic pathway whereas sediments characterized by older, more recalcitrant OM are typically dominated by the hydrogenotrophic pathway. Temperature will control rates of both pathways, but may differentially influence the relative contribution of each pathway to total MG. Activity of the bacterial consortium responsible for H2/CO2 generation increases with sediment temperature (Schulz et al. 1997), and may play a larger role in controlling MG activity in the future due to climate induced warming (McGuire et al. 2009; Meuller et al. 2009). Further, increased air temperature in the Arctic is expected to release large amounts of stored organic carbon through permafrost degradation (Weller et al. 1995; Pastor et al. 2003; Finlay et al. 2006; Guo et al. 2007). Consequently, both major
18
terrestrial OM as well as increased temperature as a function of climate change (Michaelson et al. 1996; Roehm et al. 2009; Mazeas et al. 2009). Characterization of these pathways and the factors controlling their distribution has not been examined in Arctic Alaskan lakes. Therefore, experiments were conducted to determine: (a) the relative proportion of these pathways in shallow arctic lakes and its distribution with depth below the sediment surface, and (b) the response of the methanogenic community to substrate additions.
2.2 Materials and Methods 2.2.1 Field Sites
My study site is located in the Arctic Foothills province of Alaska which is a region of the Arctic that is characterized by a tundra landscape underlain with 18ontinuous permafrost (Whalen et al. 2006). Mean annual temperatures range from – 7 to – 11°C with annual precipitation ranging from 140 to 267 mm (Bowden et al. 2008). The trophic state of most of the lakes in this region ranges from ultraoligotrophic to oligotrophic with heavy reliance on spring snowmelt for terrestrial subsidies of dissolved organic matter (Kling 1995; Whalen and Cornwell 1985). A full description of the region including vegetation characteristics and glacial geology can be found in Ping et al. (1998) and Hamilton (2002).
19
polymictic mixing patterns, thermally stratifying on an intermittent basis during the summer growing season (Figures 2.1 and 2.2).
2.2.2 Field Sampling
Sediments for CH4 production studies were collected from GTH 114 on 4 July 08 and from E4 on 18 July 08. Sediment cores were extracted from the lakes using a KB gravity corer (Wildlife Supply Company) deployed from an inflatable raft. Polycarbonate sleeves (4.8 cm inside diameter x 50 cm length) were inserted into the KB corer which was then lowered carefully into the sediments. Once removed from the sediments, sleeves were capped on each end with rubber stoppers. Additional sediments were similarly collected for dissolved organic carbon (DOC) and %OM analysis. Intact sediment cores were transported undisturbed via foot, vehicle, or helicopter to TFS for processing.
Samples for DOC analysis were also taken from temporary water tracks entering E4 (n = 1) on 3 July 2009 and GTH 114 (n = 2) on 17 June 2009. Additional water samples were collected in 2010 for fluorescence index (FI) determination, which is an index of whether the precursor material was autochthonous or allochthonous (McKnight et al. 2001; Cory et al. 2007; Cory et al. 2010). Single samples were collected from the epilimnion and hypolimnion of E4 on 4 July 2010 and similarly from GTH 114 on 25 June 2010 using a Van Dorn water sampler (Wildlife Supply Company) deployed from an inflatable raft.
2.2.3 Laboratory Studies
20
deionized water (Dh2O) was prepared in separate polycarbonate beakers by purging with ultra pure helium (He) and an air stone affixed to the end of tygon tubing. The uppermost sediment interval (0 – 1 cm) contained a visibly higher proportion of water relative to deeper sediment intervals. Therefore, 50 ml of anoxic Dh2O were added to the surface layer (0 – 1 cm interval) while 100 ml of anoxic Dh2O were added to subsequent depth intervals in an effort to
approximate similar water: sediment ratios among samples. To account for any variation in the water: sediment ratios among depths intervals, rates of MG were based on sediment dry mass. Following addition of Dh2O, all homogenized sediment slurries were continually purged with He. A polycarbonate syringe with a bored tip was used to measure 20 ml of anoxic sediment slurry that was then placed into 160 ml serum bottles. Serum bottles were sealed with butyl rubber stoppers and capped with aluminum crimp seals. Each serum bottle was evacuated and purged with He a minimum of 5 times to ensure anoxia, filled to 1 atm with He then placed in a 10˚C water bath to acclimate for approximately 12 h prior to treatment additions (i.e.,
methanogenic substrates or a pathway inhibitor). Substrate additions included acetate and H2 while methyl fluoride (CH3F) was used as a specific inhibitor of the acetoclastic pathway. One of the following amendments were added to triplicate sediment slurries to obtain a final concentration for each treatment: acetate (1 Mm), H2 (4% v/v), CH3F (1% v/v). The selected concentrations for each amendment have been previously found to be effective for this type of study (Nusslein and Conrad 2000; Nozhevnikova et al. 2007) and thus, were similarly
21
Analysis of CH4 was conducted by a gas chromatograph equipped with a flame ionization detector (FID-GC; Shimadu GC-8A) and was completed within 2 h of headspace sampling. Operating conditions for the FID-GC were as follows: Column = ⅛” diameter x 1 m length mol sieve 5A (60/80); column temperature = 90°C; injector and detector temperatures = 140°C; carrier gas = ultra-high purity N2 at 33 ml min-1 flow rate. Vial headspaces were sampled 4 times over 10 d, resulting in the linear production of CH4. Rates were calculated using linear
regression of CH4 production versus time and were normalized to 1 g dry sediment matter. Methods were adapted from Nusslein and Conrad (2000).
Triplicate cores for porewater analysis of DOC were carefully sliced in 1 cm increments, which were then added to 15 ml glass centrifuge tubes and sealed with rubber septa without a headspace. Tubes were centrifuged at < 2000 rpm for 30 min. The supernatant for each core section was filtered (ashed Whatman GF/F filter) and acidified (0.1 ml of 0.1N HCl). Water track samples were similarly filtered and acidified for DOC analysis. All DOC samples were stored at 4˚C, and transported to UNC-CH for analysis. DOC was measured on a Shimadzu TOC-VCPH Combustion-Infrared instrument (Shimadzu Corp., Kyoto, Japan) using Standard Method 5310B (Standard Methods for the Examination of Water and Wastewater1998). Solid phase sediments (in 1 cm increments) were weighed, dried for 2-3 d at 45°C and reweighed. Dry sediments were ashed at 550°C for 4 h.
22 2.2.4 Calculations and Statistics
Headspace CH4 in serum vials as a mixing ratio was converted to a moles per liter basis. Methane concentration in the aqueous phase at each sampling point was calculated from temperature corrected solubility coefficients (Yamamoto et al. 1976) and Henry’s law (Stumm and Morgan 1996). The total amount of CH4 produced in each bottle at each time point was computed as the sum of the aqueous phase and headspace masses.
The rates of MG from the unamended slurries (control) provided an estimate of total MG. Since CH3F inhibits the acetoclastic pathways, any CH4 produced in the presence of CH3F was assumed to be produced via the hydrogenotrophic pathway. Thus, the relative proportion of MG attributed to the acetoclastic pathway was calculated as the difference between the mean rate of MG in the control treatments and the mean rate of MG in the CH3F treatments for each lake at each depth.
The effect of sediment depth increment on unamended rates (controls) of MG was evaluated using separate One-way ANOVAs. Post-hoc comparison of means was conducted using Tukey’s Honestly Significant Difference (HSD) for within-lake comparisons and Student’s t-test for between-lake comparisons. The effect of substrate addition (acetate or hydrogen) on MG rates was also evaluated using One-way ANOVA followed by Dunnett’s test for direct comparison with the control. The effect of sediment depth increment on amended rates of MG was assessed using One-way ANOVA following by Tukey’s HSD for comparison of multiple means (Sokal and Rohlf 1995; Zar 1996; McDonald 2009).
23
relationships in all profiles among sediment zones were not found (see Results), or some regression assumptions were violated preventing use of linear regression. Therefore, One-way ANOVAs were used to compare within-lake and between-lake differences in DOC and % OM with respect to sediment depth increment. Post-hoc comparisons of means were conducted with Tukey’s HSD for within lake evaluations or Student’s t-test for between lake evaluations. The % OM was arcsine transformed for all statistical analyses (Sokal and Rohlf 1995; Zar 1996; McDonald 2009).
Due to the non-normal distribution of environmental variables, the relationship
between rates of MG and DOC, or MG rates and % OM were evaluated using Spearman’s rank correlation (rs) (Sokal and Rohlf 1995; Zar 1996; McDonald 2009).
Organic content (%) was calculated from the difference in mass between oven dried sediments (40-60°C) and sediments combusted at 550°C for 4 h (den Heyer and Kalff 1998; Wetzel and Likens 2000).
2.3 Results
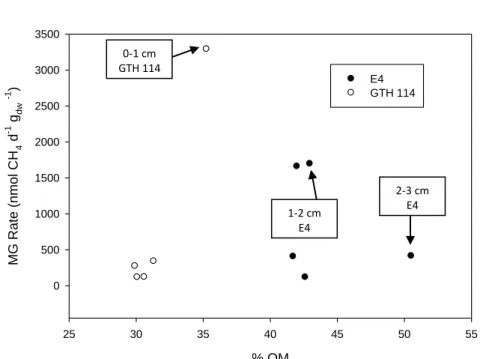
24
ranged from 118 to 3291 nmol CH4 gdw -1 d-1 with the rate in the 0-1 cm depth interval
significantly higher than rates in deeper sediments. Between lake comparisons showed some significant differences in rates of MG at comparable depth intervals. Rates of MG in the 1-2 cm and 2-3 cm depth intervals were higher in E4 than in GTH 114. No other pairs of sediment depth intervals differed significantly with respect to rates of MG.
Substrate additions generally enhanced MG rates relative to controls at all depths in both lakes, but not all rate increases were significant. A complete list of statistical tests
evaluating the effect of substrate additions on rates of MG can be found in Table 2.3. Briefly, in E4, H2 significantly stimulated MG relative to the control in the 0-1 cm interval, but showed no significant difference relative to the control in the 1-2 cm interval (Figure 2.4). Hydrogen and acetate both significantly increased rates of MG compared to controls at depths below 2 cm. Rates of MG increased significantly in the 0-1 cm interval in response to the addition of H2 when compared to acetate. No other significant differences between acetate or H2 treatments were found at subsequent depth intervals in E4. In GTH 114, H2 significantly stimulated rates of MG at all depths relative to unamended controls whereas acetate significantly increased CH4 production only at depths below the 0-1 cm depth interval (Figure 2.5). No significant
differences were found at any depth interval in GTH 114 when comparing MG rates for samples supplemented with acetate versus hydrogen. In comparison to unamended treatments,
25
The acetoclastic and hydrogenotrophic pathways were inversely distributed with depth in E4, with the importance of the acetoclastic pathway generally decreasing with increasing depth below the sediment surface (Figure 2.7). A similar but less clear trend was observed in GTH 114 (Figure 2.8). The ratio of the acetoclastic: hydrogenotrophic pathway transitioned in E4 from 17:1 in the 0-1 cm depth interval to 2:1 in the 4-5 cm interval. In contrast, the 0-1 cm depth interval in GTH 114 displayed a 6:1 ratio for the acetoclastic: hydrogenotrophic pathway, but showed a slightly greater than even contribution by the hydrogenotrophs in the 2-3 and 4-5 cm sediment depth intervals. Interestingly, only the 1-2 cm interval showed a 2:1 ratio of acetoclastic: hydrogenotrophic MG in GTH 114.
26
Neither lake exhibited a significant change in % OM with increasing sediment depth (Table 2.4; Figure 2.10). In E4, the surficial sediment layer (0-1 cm) was comprised of
approximately 42 ± 1.08 % OM ( ̅ ± SE) with the 4-5 cm interval comprising 43 ± 8.9 % OM ( ̅ ± SE). No clear pattern was observed between unamended rates of MG and % OM in each sediment depth interval in E4, but the highest unamended rate of MG in GTH 114 occurred in the surficial sediment interval (0-1 cm) which also coincided with the depth interval containing the greatest % OM (Figure 2.11). Despite the lack of a significant difference in % OM among depth intervals, GTH 114 had a higher organic content in the 1-2 and the 3-4 cm depth intervals than E4 (Table 3.4). There was a significant linear relationship between % OM and sediment depth increment in GTH 114, but not in E4 (Table 2.5). Therefore, the overall mean % OM content between lakes was compared by One-way ANOVA (Table 2.4). The mean % OM content of 45% in the solid phase (0-5 cm) of E4 sediment was significantly higher than the value of 32% in GTH 114 (paired t-test), although considerably more variability was evident in E4 sediments relative to GTH 114 sediments.
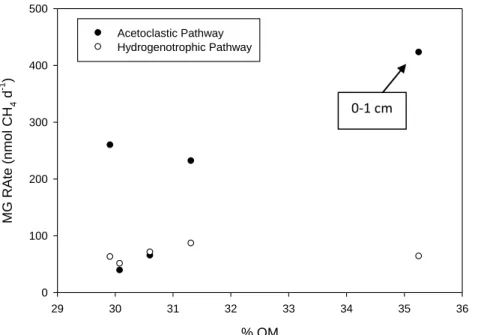
In E4, no clear pattern was observed between rates of MG attributed to the acetoclastic or hydrogenotrophic pathways versus % OM at the corresponding sediment depth intervals (Figure 2.12). Rates of MG via the acetoclastic pathway in GTH 114 occurred in the depth interval (0-1 cm) that contained the highest observed % OM (Figure 2.13). However, no other clear pattern between MG rates and % OM in the discrete depth intervals was observed.
27
in E4. Sediment DOC, however, was not significantly correlated to pooled rates of MG for E4 and GTH 114. No significant relationship was found between pooled % OM and rates of MG, but rates of MG were strongly correlated to % OM in GTH 114.
2.4 Discussion
2.4.1 Total Methanogenesis
Rates of methanogenesis in freshwater lake sediments are somewhat scarce and vary globally (Tranvik et al. 2009). Rates of total MG observed in lakes E4 and GTH 114 generally fall within the range of other reported studies worldwide. Duc et al. (2010) measured MG rates in lakes of the temperate and boreal areas of Sweden and found a wide range (2 – 3990 nmol CH4 gdw-1 d-1). In contrast, rates in soil slurries from unflooded rice fields in Italy depended on temperature regimes (4 – 30°C) and agricultural impacts, with values varying from 264 – 552 nmol CH4 gdw-1 d-1 (Dannenberg et al. 1997). Rates in slurries from Lake Biwa in Japan were considerably lower than rates found in my lakes at < 2 nmol CH4 gdw-1 d-1 (Dan et al. 2004). Conrad et al. (2010) reported rates between 1092 – 1519 nmol CH4 gdw-1 d-1 in sediments from two clear-water Amazonian lakes.
2.4.2 Unamended Treatments
28
showed rates of MG that were significantly different between lakes. High variability and few replications limit statistical power making trends difficult to identify.
Although the difference was not significant, the higher rates of MG observed in the uppermost sediment layer of GTH 114 compared to E4 could be attributed to several factors. As oxygen inhibits growth of methanogens (Zinder 1993), intermittent oxic conditions in the
uppermost surficial sediments in E4 likely suppress growth of methanogenic communities in contrast to the favorable environment provided by consistently anoxic surficial sediment layer in GTH 114 (Figures 2.1 and 2.2). Yuan et al. (2009) found methanogens in rice field soils repeatedly exposed to oxygen for 72 h did not resume production of CH4 until 23 days after cessation of oxygen exposure. In contrast, the deepest zone in GTH 114 is approximately 2 m deeper than that of E4 and covers approximately 3 times less surface area (668 vs. 2309 m2, respectively). It is likely that this small surface area of sediments at maximum water depth (Zmax) in GTH 114 is somewhat buffered from wind driven sediment resuspension events thereby promoting consistently anoxic conditions in the surficial sediment layer. Furthermore, the surficial sediments of Zmax in GTH 114 are much more flocculent than those found in E4. Highly flocculent material, derived from autochthonous and allochthonous sources, overlying sandy sediments can increase sediment oxygen demand, thereby depleting oxygen
concentrations at the sediment surface (Sweerts et al. 1986).
29
sediments (i.e., down to 20 cm). Concomitant reductions in total numbers of Bacteria with increasing sediment depth were also observed. Consequently, the authors suggested that the decline in total Bacteria likely drive the lower overall rates of MG in those sediments as Bacteria
can regulate the availability of MG substrates. Given that a host of symbiotic bacterial
processes regulate the availability of methanogenic substrates (Glissman et al. 2004) a similar mechanism may explain the depth distribution of MG pathways in E4 and GTH 114.
Pelagic primary production in shallow lakes characteristic of the Alaskan Arctic is limited significantly by nutrient availability (Levine and Whalen 2001). Benthic primary production can be an important component of whole-lake primary productivity in shallow lakes due to high light availability to the epipelic algae in close proximity to nutrient rich sediments
(Vadeboncoeur et al. 2001; Whalen et al. 2008; Rautio et al 2011). To supplement these autochthonous limitations, whole-lake metabolism currently depends heavily on terrestrial inputs of nutrients and OM occurring in snowmelt and periodic flushing from storm events (Whalen and Cornwell 1985; Kling 1995; Michaelson et al. 1998; Cory et al. 2007). Increases in the magnitude and frequency of nutrient and OM delivery to aquatic systems from the
30
lentic systems will depend on vegetation composition, precipitation, hydrological flow paths and localized permafrost thaw depths (Prowse et al. 1996; Rouse et al. 1997; Michaelson et al. 1998; Post et al. 2009; Kittel et al. 2011). Collectively, my results and these previous reports suggest that increased nutrient delivery from the terrestrial landscape in response to climate change may indirectly fuel MG through stimulation of autochthonous production in shallow arctic lakes.
Terrestrial OM inputs to shallow arctic lakes under current climatic conditions may also influence MG activity through photodegradation of recalcitrant DOM into labile substrates (Moran and Zepp 1997; Judd et al. 2007; Zhang et al. 2009; Rautio et al. 2011). In the present study, FI values of DOC samples collected from the epilimnion and hypolimnion of E4 and GTH 114 indicated a high degree of terrestrial source material (Cory et al. 2010) and were consistent with measurements from Toolik Lake, a large, deep lake in the region of my study (Cory et al. 2007). Terrestrially derived OM typically shows FI indices of < 1.4 while FI values > 1.4 are indicative of autochthonous OM (Cory et al. 2010). In GTH 114, the FI values did not differ significantly between the epilimnion and hypolimnion. However, in E4, epilimnetic FI values were significantly lower than FI values for the hypolimnion. Bacterial processing of terrestrial OM can increase the FI value relative to the source material (Cory et al. 2007). Similarly, photobleaching can lower the FI value (Cory et al. 2007) which is likely why the epilimnetic samples in E4 and GTH 114 exhibited lower FI values than the respective hypolimnetic samples, a result that is consistent with observations in nearby surface waters (Dr. Rose M. Cory,
31
Consequently, photodegradation of DOM may represent an important linkage between MG substrate supply and terrestrial OM inputs to shallow arctic lakes.
Increased frequency and magnitude of terrestrial DOC inputs to arctic lakes may lead to alterations in lake-ecosystem function. Under current conditions, E4 and GTH 114 periodically exhibit intermittent and weak thermal stratification throughout the open water season (Figures 2.1 and 2.2). Allochthonous OM differs substantially from autochthonous DOM in its capacity to absorb light (Rautio et al 2011). Terrestrially derived OM absorbs more light than
autochthonous OM (Reche et al. 2001; Pace and Cole 2002; Sobek et al. 2007). Thus, high inputs of allochthonous OM can affect the thermocline structure and depth of the mixed layer in response to light absorption and heat retention (Houser et al. 2003; Sobek et al. 2007; Fortino 2010). In a 2008 survey of 15 lakes near Toolik Field Station, Fortino (2010) found a significant correlation between light attenuation and DOC, and between light attenuation and thermocline depth. The results of that study indicated that shallower thermoclines develop in response to greater light attenuation as a function of higher DOC concentrations. Increased light attenuation by terrestrial DOC also results in reduced light availability to the benthos which can be particularly important in shallow lakes where benthic primary production is a major contributor to whole-lake primary production (see above). Additionally, deeper
32 2.4.3 Substrate Additions
The stimulatory effect of acetate or hydrogen relative to the unamended treatments generally increased with increasing sediment depth (Figure 2.4). However, in the deeper sediment intervals (i.e., 3-4 and 4-5 cm), H2 exerted a much stronger influence on MG rates than acetate supplementation compared to the controls in GTH 114 than in E4. Two possible mechanisms could be driving this observation. Methanogens are capable of dormancy for extended periods (Rothfuss et al. 1997; Watanabe et al. 2007), but could be readily stimulated by substrate additions. Alternatively, compositional differences in methanogenic communities could be driving the observed patterns if hydrogenotrophic methanogens are more densely populated at these depth intervals than acetoclastic methanogens.
2.4.4 Pathway Delineation
Although the acetoclastic pathway appeared to dominate the upper sediment layers in each lake, the down core shift in pathway importance in each lake was not parallel. The data suggest that the acetoclastic pathway was the dominant mechanism for CH4 production in all depth intervals measured in E4, but two sediment depth intervals (i.e., 2-3 and 4-5 cm) in GTH 114 indicated a slightly higher importance of the hydrogenotrophic pathway than the
33
synthesize acetate directly from fermentation products, effectively bypassing the degradation step by syntrophic bacteria that typically produces alcohols and fatty acids which are then degraded into methanogenic substrates (i.e., acetate, H2/CO2) (Conrad 1999). Because the acetoclastic pathway shows nearly complete dominance in the upper sediment layers of E4, high rates of homoacetogenesis could be causing the observed ratios in the MG pathway with increasing sediment depth in E4, but the factors controlling the overall higher contribution of the hydrogenotrophic pathway in GTH 114 and at comparable depths is not clear.
The predominance of the hydrogenotrophic pathway over acetoclastic fermentation is typically only found in marine systems (Crill and Martens 1986) or in peat bogs (Horn et al. 2003; Prater et al. 2007; Rooney-Varga et al. 2007). Occurrence of a higher contribution from the hydrogenotrophic pathway than the acetoclastic pathway in lake sediments is uncommon and not very well understood. Potential reasons for the importance of the hydrogenotrophic pathway to exceed acetate fermentation in freshwater lake sediments could be attributed to excessively high concentrations of acetate, which inhibit acetoclastic MG (Nozhevnikova et al. 1997), or additional sources of H2 (Conrad 1999). Substantial differences in acidity and
34
vegetation composition, and consequently the quality of DOC entering the lakes influences the relative proportion of MG pathways in these shallow lakes.
The functional linkage between arctic lakes and their surrounding landscapes will likely be altered in the future as a consequence of global and regional climate change. Some of the most notable predictions contend that terrestrial OM delivery to the lakes will be amplified due to widespread thawing of permafrost (Weller et al. 1995; Mazeas et al. 2009; Karlsson et al. 2010). Mobilization of the previously sequestered OM into arctic lake sediments will likely enhance production of CH4 in these environments (Zimov et al. 1997; Walter et al. 2007; Mazeas et al. 2009; Karlson et al. 2010). The degree of influence on individual MG pathways is not yet clear. Given the widespread distribution of these lakes across the arctic landscape, increased CH4 production without complementary offsets by CH4 oxidation will considerably impact the atmospheric CH4 budget, serving as positive feedback to climate warming. This study suggests that methanogenic communities in these two shallow arctic lakes are currently substrate limited. Consequently, increased OM loading to arctic lakes will in all probability positively impact rates of MG in these lake sediments. While the relative ratio of the
35 2.5 Conclusion
36
37 REFERENCES
Bowden W.B., M.N Gooseff, A. Balser, A. Green, B.J. Peterson, and J. Bradford. 2008.
Sediment and nutrient delivery from thermokarst features in the foothills of the North Slope, Alaska: potential impacts on headwater stream systems. Journal of Geophysical Research 113, G02026, doi: 10.1029/2007JG000470.
Capone D.G. and R.P. Kiene. Comparison of microbial dynamics in marine and freshwater sediments: Contrasts in anaerobic carbon catabolism. Limnology and Oceanography
33(4): 725-749.
Chan O.C., P. Claus, P. Casper, A. Ulrich, T. Lueders and R. Conrad. 2005. Vertical distribution of structure and function of the methanogenic archaeal community
In Lake Dagow sediment. Environmental Microbiology 7(8): 1139-1149.
Conrad R. 1999. Contribution of hydrogen to methane production and control of hydrogen concentrations in methanogenic soils and sediments. FEMS
Microbiology Ecology 28: 193-202.
Conrad R. 2005. Quantification of methanogenic pathways using stable carbon isotopic signatures: a review and a proposal. Organic Geochemistry 26: 739-752.
Conrad R, M. Klose, P. Claus, and A. Enrich-Prast. 2010. Methanogenic pathway, 13C Isotope fractionation, and archaeal community composition in the sediment of two clear-water lakes of Amazonia. Limnology and Oceanography
55(2): 689-702.
Cory R.M., D.M. McKnight, Y.P. Chin, P. Miller and C.L. Jaros. 2007. Chemical characteristics of fulvic acids from Arctic surface waters: Microbial contributions and photochemical transformations. Journal of Geophysical Research 112: doi:10.1029/2006JG000343. Cory R.M, M.P. Miller, D.M. McKnight, J.J. Guerard, and P.L. Miller. 2010. Effect of
instrument-specific response on the analysis of fulvic acid fluorescence spectra.
Limnology and Oceanography: Methods 8: 67-78.
Crill P.M and C.S. Martens. 1986. Methane production from bicarbonate and acetate in in an anoxic marine sediment. Geochimica et Cosmochimica Acta 50: 2089-2097. Dan J., T. Kumai, A. Sugimoto and J. Murase. 2004. Biotic and abiotic methane releases from
Lake Biwa sediment slurry. Limnology. 5: 149-154.
Dannenberg S., J. Wudler and R. Conrad. 1997. Agitation of anoxic paddy soil slurries affects the performance of the methanogenic microbial community.