COMPARING THE EFFECTIVENESS OF “INDIVIDUAL-LOSS” AND “FAMILY-LOSS” MESSAGES IN PROMOTING MAMMOGRAPHY
Xiaokun Qian
A thesis submitted to the faculty at the University of North Carolina at Chapel Hill in partial fulfilment of the requirements for the degree of Master of Arts in the School of Journalism and
Mass Communication (Interdisciplinary Health Communication).
Chapel Hill 2014
Approved by: Brian G. Southwell
ABSTRACT
Xiaokun Qian: Comparing the effectiveness of “individual-loss” and “family-loss” messages in promoting mammography
(Under the direction of Brian Southwell)
The study compared the effectiveness of two loss-framed messages, namely, graphics and text therein with individual-loss or family-loss theme, in increasing women’s intention to take and talk about mammogram, and level of negative emotions such as sadness. Moderating effect of number of children living in the family, age of the youngest child, and women’s marital status was also assessed.
ACKNOWLEDGEMENT
TABLE OF CONTENTS
CHAPTER 1: INTRODUCTION………1
CHAPTER 2: LITERATURE REVIEW……….4
2.1 Message framing………4
2.2 Framing and couple-focused message………...6
2.3 Women and family………7
2.4 Screening intention and family size………...8
2.5 Dependent children and health behavior………9
CHAPTER 3: HYPOTHESES……….………..10
CHAPTER 4: METHODS……….12
4.1 Participants……….……..12
4.2 Study Design………13
4.3 Conditions………13
4.4 Procedure……….14
4.5 Measures………..14
4.6 Statistical Analysis……….………..17
CHAPTER 5: RESULTS………...19
5.1 Sample characteristics………...………...19
5.2 Manipulation check………...………...22
5.3 Hypothesis-specific results………..22
5.4 Probing of the interaction……….………...30
5.5 Supplementary analysis………...35
CHAPTER 7: CONCLUSION………..42
APPENDIX A: SURVEY QUESTIONNAIRE………43
APPENDIX B: MECHANICAL TURK RECRUITMENT POST………..…….50
APPENDIX C: INTERVENTION MATERIALS………51
LIST OF TALBES
Table 5.1 Summary of demographic variables by study group……….21 Table 5.2 Estimated mean outcome measures by study group adjusting for race, education,
income, and mammogram history.………..………25 Table 5.3 Moderating effect of having children in the family unit on the group
difference….………29 Table 5.4 Moderating effect of marital status on the group
LIST OF FIGURES
Figure 5.1 Moderating effect of having children living in the family unit on group
CHAPTER 1: INTRODUCTION
Breast cancer is the second most common cause of cancer death among women of all races in the United States (Centers for Disease Control and Prevention [CDC], 2013). Although mammography is one of the most effective screening tests to reduce breast cancer mortality (Mandelblatt et al., 2009) , in 2010 up to 30% of American women aged 50 to 74 did not have the screening over the past two years (CDC, 2012). Message framing (i.e., loss frame and gain frame) may be a strategy to increase mammography utilization (Banks et al., 1995). Loss frame focuses on the negative consequences by not taking a particular behavior whereas gain frame focuses on the benefits by taking a particular behavior (Abood, Black, & Coster, 2005). Although prior studies show the advantage of loss frame over gain frame in motivating illness detection behavior like mammography (Abood, Coster , Mullis, & Black, 2002; Abood et al. 2005; Banks et al., 1995; Cox & Cox, 2001; Salovey & Williams-Piehota, 2004; Schneider et al., 2001), little is known about how different themes within loss frame would affect message
effectiveness.
In the real world, two themes of loss-framed messages (i.e., individual loss and family loss) are widely used in health promotion. However, the specific relative effects of the two have not been sufficiently studied. Individual loss refers to the negative outcome imposed on the person him/herself. For example, in CDC’s Tips from Former Smokers Campaign, a woman lost her throat by not being able to quit smoking (CDC, 2013). Family loss refers to the negative
to that loss, e.g. CDC’s Screen for Life Campaign, a son talking about his emotional stress from losing his mother to colon cancer (CDC, 2014).
In the context of mammography, these two themes (individual-loss vs. family-loss) are of interest for further examination, especially considering women’s strong attachment to their family (Van Honk et al., 2011). It is reasonable to assume that women want to avoid the negative consequences on their family members caused by themselves not taking a particular preventive behavior.
The messages tested in this study were adapted from direct mailing materials used by Minnesota Department of Health (see appendix). The materials were originally designed for SAGE, a program that offers free mammogram to un- and under-insured women in Minnesota (MDH, 2013). These materials present clear themes of both individual-loss and family-loss according to the definition given before.
The questions guiding our present investigation are whether family-loss message is more effective than individual-loss message in a) increasing intention to take mammogram b) increasing intention to talk with family members or healthcare provider about taking
mammogram or c) evoking higher level of negative emotion, among U.S. women aged 40 to 74. Answers to these questions can help fill the gap of literature and has implications on future material design.
The reasons to select the above outcomes to assess effectiveness are briefly described as follows. Screening intention is a primary outcome as it is a strong predictor of behavior,
CHAPTER 2: LITERATURE REVIEW
2.1 Message Framing
A large amount of work on message framing is based on Prospect Theory (Kahneman & Tversky, 1979). Prospect Theory suggests that when gain is salient, people are risk averse; when loss is prominent, people are risk seeking. Level of perceived risk is associated with different types of behaviors. Health prevention behavior such as wearing a seat belt or applying sunscreen is perceived to have low or no risk. Therefore gain frame is more effective in encouraging prevention behaviors, a low-risk choice (Rothman, Salovey, Antone, Keough, & Martin, 1993). Disease detection behavior such as having breast self-exam or cancer screening is perceived to be risky, as there is a possibility of detecting life-threatening tumor. Therefore loss frame is more effective in promoting detection behaviors, a riskier choice (Meyerowitz & Chaiken, 1987).
Salovey and Williams-Piehota (2004) further confirmed the findings in their review on gain- and loss-framed messages. They found that gain-framed messages are generally more effective at promoting prevention behaviors such as mouthwash and sun screen use, whereas loss-framed messages are more effective at promoting detection behaviors such as cancer screening.
within 12 months of intervention is marginally significantly higher in women exposed to a loss-framed video than in women exposed to a gain-loss-framed video.
Cox and Cox (2001) conducted a 2 by 2 randomized controlled experiment on 174 women over the age of 50 from a Midwestern metropolitan area to investigate the effect of anecdotal and statistical messages as well as positive (gain) and negative (loss) anecdotal messages on promoting breast cancer detection behaviors. They authors found that anecdotal messages are more involving than statistical messages and that negative anecdotes are more persuasive than positive anecdotes. Moreover, the authors showed that the predicted behavioral change is mediated by the belief and attitude changes.
Schneider et al. (2001) designed an experiment to assess the effect of gain or loss framed as well as ethnic group-specific or multicultural mammogram promoting videos in 752 low-income women over 40 years of age from community health clinics and public housing
developments. It was shown that loss-framed multicultural messages were the more persuasive. The advantage of loss-framed multicultural messages was more prominent among Anglo and Latino women than African American women.
Abood et al. (2005) compared the effect of loss-framed telephonic message to the “usual” telephonic message among women of age 50 to 64 who were un- or under-insured from 17 counties in rural area of Florida. Catchment areas were randomly selected within counties to serve as the experimental and comparison groups. The authors found that women received the loss-framed message were twice more likely to obtain a mammogram than those received the usual message.
behaviors. However, in mammography screening, loss-framed message was still found to have a small but significant advantage over gain-framed message. The author hypothesized that males and females maybe differently susceptible to loss-framed messages. After a further examination on the association of proportion-of-female-participants and effect size among all cases, the hypothesis was not supported.
2.2 Framing and Couple-focused Message
There is only one study that is close to the current study that examined a family-focused message on smoking cessation.
consumption in the former condition than the latter one. Although this study is different from my study in that couples rather than women (including married and unmarried) were exposed to the interventions, the evidence that couple-focused messages are more effective than individual-focused messages still provides some support and basis that family-individual-focused message may potentially have a larger effect than individual-focused message.
2.3 Women and Family
Given the focus of the family-loss message on the potential impact on the mother, it is necessary to review the literature on women and family.
Although the women’s role in a family has changed drastically over the past several decades, they remain to take on great responsibilities in domestic activities such as childcare and homemaking (De Coster & Zito, 2013) and share some of the characteristics in their traditional-role such as being nurturing, supportive, and directed to family (Harway & Nutt, 2006). This further explains why women struggle to find balance between family and work (Perrone, Wright, & Jackson, 2009).
In addition, women nowadays join labor force and make important contribution to family income (Perrone et al., 2009). In other words, the family has become more dependent on
woman’s ability to work and to generate income. Consequently, the family would financially suffer ever more from the loss of the woman. This might also account for a negative impact on families that women would make every effort to avoid.
Thus, given the substantial potential contributions of women to the emotional and financial well-being of the family, there is a potential effect of family-loss message on women.
2.4 Screening Intention and Family Size
The literature above showed that there is some association between family size and screening intention. The current study further tested the moderating effect of family size on group difference in screening intention.
Although having children may serve as a blocking factor to breast cancer screening, the above studies did not use “family-loss” materials as stimuli to prime women into thinking about the negative consequences on family. The current study intended to fill the gap.
2.5 Dependent Children and Health Behavior
CHAPTER 3: HYPOTHESIS
Besides assessing the outcome variables such as the intention to take or talk about mammogram and negative emotion, the moderating effect of family size, age of the youngest child is also of interest, based on previously reviewed literature (Stimpson et al., 2009; Jarvis, 1996; Brown et al., 2013). In addition, marital status is also of interest. A very important reason to identify the aforementioned moderators is that the family-loss message originally developed by Minnesota Department of Health and tested in this study presented a theme which includes a married couple and two young children (see appendix). It is natural to see if women under similar situation can relate to the characters in the family-loss message more easily, that is, the family-loss message can potentially have a larger effect for women who are married, have bigger family size and younger children. The hypotheses are listed below.
Primary Hypothesis
1. The intention to get mammography will be higher among those exposed to a “family-loss” message than among those exposed to an “individual-loss” message.
Secondary Hypotheses
3. The degree of negative emotion in the “family-loss” group will be significantly higher than that in the “individual-loss” group.
4. The difference between the two study groups in the outcomes specified in hypothesis 1, 2, and 3 above will increase as the number of children goes up.
5. The difference between the two study groups in the outcomes specified in hypothesis 1, 2, and 3 will be larger in married women than that in single women.
6. The difference between the two study groups in the outcomes specified in hypothesis 1, 2, and 3 will increase as the age of the youngest child decreases.
CHAPTER 4: METHODS
4.1 Participants
Two hundred female participants aged 40 to 74 years old were recruited on Amazon’s Mechanical Turk (MTurk) for this study. MTurk is a crowdsourcing Internet marketplace for getting work done by others (Buhrmester, Kwang, & Gosling, 2011). Previous studies in the field of social sciences found that MTurk provides a source for inexpensive yet quality data
(Buhrmester, Kwang, & Gosling, 2011; Berinsky, Huber, & Lenz, 2012; Paolacci, Chandler, & Ipeirotis, 2010). To be eligible for the study, participants also had to be able to read English, live in the US but outside the state of Minnesota, and have no breast cancer history.
The reasons to set the starting age at 40 instead of 50 recommended by the U.S.
ensure consistency, I want to stick with this age group. Finally, having a sample of women aged 40 to 49 is important to this study as they have a higher probability of having younger children. Participants were outside Minnesota since the intervention materials were originally from Minnesota Department of Health and were distributed there. The purpose of pre-screening is to reduce the effect of repeated exposure, as literature suggested that messages presented repeatedly tend to lose their impact (Bornstein, 1989). Participants who have breast cancer history were excluded because mammography may become a routine test to check progression or
reoccurrence rather than a preventive screening, which is against the purpose of this study to examine the effectiveness in motivating preventive behavior.
4.2 Study Design
The study used a post-only between-subjects experiment design. Participants were evenly randomized to one of the conditions to view either an individual loss message or a family loss message. The study was approved by University of North Carolina Institutional Review Board.
4.3 Conditions
The intervention materials were adapted from direct mailing materials used by Minnesota Department of Health. The materials were originally designed for SAGE, a program that offers free mammogram to un- and under-insured women in Minnesota (MDH, 2013). The adapted versions contained half graphic and half text. MDH’s logo was removed and so was program-specific information such as program phone number.
checks were run. Other checks on appearance and quality of the ad were also run to ensure equivalence on other variables besides theme difference.
4.4 Procedure
Survey was developed in Qualtrics and was distributed through Amazon Mechanical Turk (MTurk). Two criteria were set on MTurk before the task was posted. First, task takers should live in the U.S. Second, they must have a record of 95% approval rate of previous tasks. A short description on this task was posted (see appendix).
The first page of survey served as a consent form. After participants gave consent, they were pre-screened using criteria listed in the “participant” section (see survey questionnaire in appendix). Eligible participants who also completed the survey were given an incentive of one dollar paid to their MTurk account, however, due to the limited funding situation, the latter half (n=100) of the participants were given 0.5 dollar each as incentive to complete the task. Details of sample characteristics between the two batches were described in results section.
At the very beginning of the survey, participants viewed the promotional materials and then completed questions based on the materials. Questions about the number of children and marital status were assessed after the completing material-related questions. The purpose is to eliminate any influence of family-related questions on processing of materials and also to avoid the possible feeling of being manipulated before viewing materials.
4.5 Measures
this study. The one item scale assessed “intention” by asking participants “how likely it is that you will get a mammogram done within the next two years”. A seven-point bipolar scale was used with end points labeled “extremely likely” and “extremely unlikely”, with ‘neither’ as the midpoint.
Intention to talk/discuss mammography (Southwell & Yzer, 2007) is the secondary
outcome variable. It was assessed by asking participants “After viewing the material, how likely are you going to talk with your family members or your healthcare providers about
mammography over the next two weeks?” A seven-point scale from “not likely at all” to “extremely likely” was used.
Negative emotion was the secondary outcome variable. It was assessed by three
variables “sad”, “fearful” and “guilty” (Dillard & Peck, 2001; Dillard & Nabi, 2006). Emotions were treated separately since existing literature indicates that discrete emotions perspective has greater power in predicting message effectiveness than the dual-systems approach (negative and positive affects) (Dillard & Peck, 2001; Dillard & Nabi, 2006). Also statistical analysis in previous studies reveals a diversity of effects among negative emotions on attitude toward advertisement or message effectiveness (Dillard & Peck, 2001; Dillard, Plotnick, Godbold, Freimuth, & Edgar, 1996; Huang, 1997). In the current study, participants were asked to rate the above three variables (sad, fearful and guilty) discretely on a five-point scale ranging from “not at all” on the left end to “a lot” on the right end.
Positive emotion was also assessed to make sure there was no such unintended emotion
Number of children was a moderator and was defined as number of own children living
in the family unit, including adopted and step-children and will be scored as a continuous variable, starting from “0”. The definition comes from Jarvis’ study (1996) which examined the relationship between family size and smoking cessation.
The age of the (youngest) child was a moderator and was measured by asking
participants “what is the age of your child? (If more than one, write down the age of your youngest child) and was scored as a continuous variable.
Marital status was a moderator and was accessed by asking “are you currently married?”
A dichotomous “yes” and “no” option will be given.
Other demographic and socioeconomic variables including age, race, income level, education level and whether having health insurance was accessed using the same items in
CDC’s Behavioral Risk Factor Surveillance System Questionnaire (BRFSS, 2013). Mammogram History was measured by asking participants “have you had a
mammogram in the past two years?” A dichotomous “yes/no” answer was given.
Attitude towards mammography was also assessed by asking participants “getting a
mammogram within the next two years would be…” Two five-point Semantic Differential Scales (Mitchell & Olson, 1981) bad/good, unimportant/important were used. Norm was assessed by asking participants to rate “people important to me would approve of me getting a mammogram in the next two years” on a five-point Likert scale with one indicating strongly disagree and fiving indicating “strongly agree”.
Appearance of the ad was assessed by asking participants “how do you like the
indicating “like very much”. Quality of the ad was assessed by asking participants to rate the following statement “I think the material is professionally designed” on a seven-point Likert Scale from “strong disagree” to “strongly agree”.
4.6 Statistical Analysis
Normally distributed continuous variables were summarized using mean and standard deviation. Non-normally distributed continuous variables were summarized using median and quartiles. Categorical variables will be summarized using frequency and percentage.
As shown in previous studies, age, race, income, education level and health insurance status, attitudes toward mammography and norms are associated with women’s intention to take mammogram (Champion, 1994; Katz & Hofer, 1994; Kim & Jang, 2008; Rauscher, Allgood, Whitman, & Conant, 2012). Therefore, they were considered as potential confounders in our study. Their distributions were described by intervention groups. Race, income, education, and mammogram history were distributed very differently between the two intervention groups despite the randomization process, they were included in a multiple linear regression model to control for their confounding effect, and the primary hypothesis was tested by testing the regression coefficient of intervention against 0.
CHAPTER 5: RESULTS
5.1 Sample characteristics
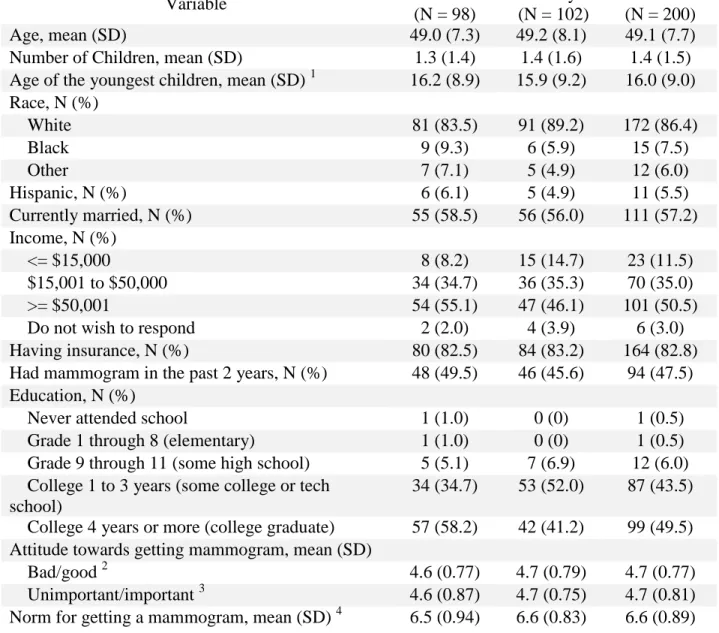
Two hundred subjects participated in the study, which random assignment to individual-loss group (n = 98) and family-individual-loss group (n = 102). The sample was predominantly White (86.4%) with an average age of 49.1. More than half of them were currently married (57.2%), and 62.5% had at least one child. Majority of the participants were covered by some type of health insurance (82.8%), and about half of them reported having a mammogram in the last two years (47.5%). The education level of the sample was high, with the vast majority reporting having at least some college (93.0%). In concordance with the education level, the income level was fairly high too, with half of the women having more than $50,000 per year and only 11.5% having less than $15,000 per year.
The group-specific characteristics are summarized in Table 5.1. It seems that the distribution of race, income, education, and mammogram history are slightly unbalanced between the two study groups while other demographic variables are well balanced. Therefore, these four variables were included in multiple regression models as covariates along with study group to control for their potential confounding effects. All four covariates were used as
Table 5.1. Summary of demographic variables by study group
Variable Individual
(N = 98)
Family (N = 102)
Overall (N = 200)
Age, mean (SD) 49.0 (7.3) 49.2 (8.1) 49.1 (7.7)
Number of Children, mean (SD) 1.3 (1.4) 1.4 (1.6) 1.4 (1.5) Age of the youngest children, mean (SD) 1 16.2 (8.9) 15.9 (9.2) 16.0 (9.0) Race, N (%)
White 81 (83.5) 91 (89.2) 172 (86.4)
Black 9 (9.3) 6 (5.9) 15 (7.5)
Other 7 (7.1) 5 (4.9) 12 (6.0)
Hispanic, N (%) 6 (6.1) 5 (4.9) 11 (5.5)
Currently married, N (%) 55 (58.5) 56 (56.0) 111 (57.2)
Income, N (%)
<= $15,000 8 (8.2) 15 (14.7) 23 (11.5)
$15,001 to $50,000 34 (34.7) 36 (35.3) 70 (35.0)
>= $50,001 54 (55.1) 47 (46.1) 101 (50.5)
Do not wish to respond 2 (2.0) 4 (3.9) 6 (3.0)
Having insurance, N (%) 80 (82.5) 84 (83.2) 164 (82.8)
Had mammogram in the past 2 years, N (%) 48 (49.5) 46 (45.6) 94 (47.5) Education, N (%)
Never attended school 1 (1.0) 0 (0) 1 (0.5)
Grade 1 through 8 (elementary) 1 (1.0) 0 (0) 1 (0.5) Grade 9 through 11 (some high school) 5 (5.1) 7 (6.9) 12 (6.0) College 1 to 3 years (some college or tech
school)
34 (34.7) 53 (52.0) 87 (43.5) College 4 years or more (college graduate) 57 (58.2) 42 (41.2) 99 (49.5) Attitude towards getting mammogram, mean (SD)
Bad/good 2 4.6 (0.77) 4.7 (0.79) 4.7 (0.77)
Unimportant/important 3 4.6 (0.87) 4.7 (0.75) 4.7 (0.81) Norm for getting a mammogram, mean (SD) 4 6.5 (0.94) 6.6 (0.83) 6.6 (0.89)
1. Based on 125 subjects with at least one child living in the family unit 2. See Item 5.1 of the questionnaire in the appendix
5.2 Manipulation check
Manipulation was successful. The paired t-test between scores of comprehension
question 2 (the message involves a family) and comprehension question 1 (the message involves an individual) in the individual-loss group is highly significant (mean score difference = -2.5, 95% confidence interval = (-3.1, -1.9), t(97) = -8.69, p < 0.001). Similarly, the paired t-test in the
family-loss group is also highly significant (mean score difference = 2.0, 95% confidence interval = (1.5, 2.4), t(101) = 8.4, p < 0.001). Therefore, there is strong evidence that the
participants correctly comprehended the main theme of the message they were assigned to view.
5.3 Hypothesis-specific results
Hypothesis 1: Intention to get screened
The first hypothesis predicted that the intention to get mammography will be higher among those exposed to a “family-loss” message than among those exposed to an “individual-loss” message. The average scores of intention to get mammogram are 5.78 (SD = 1.76) and 6.15 (SD = 1.41) for the individual-loss and family-loss group, respectively. The multiple regression analysis controlling for the aforementioned covariates shows no significant difference in the intention scores between the two groups (β = 0.35, 95% confidence interval = (-0.08, 0.79), t(180)=1.59, p = 0.112). The multiple regression gives an R2 of 0.1. Therefore, H 1 was not supported.
Hypothesis 2: Intention to talk about mammography
The second hypothesis predicted that the intention to talk with family member or
intention to talk about mammogram are 4.45 (SD = 2.01) and 4.58 (SD = 1.86) for the
individual-loss and family-loss group, respectively. The multiple regression analysis showed that there is no significant difference in the intention scores between the two groups (β = 0.18, 95% confidence interval = (-0.36, 0.71), t(180)=0.64, p = 0.517). The multiple regression gives an R2 of 0.1. Therefore, H2 was not supported.
Hypothesis 3: Level of negative emotion
The third hypothesis predicted that the degree of negative emotion in the “family-loss” group will be significantly higher than that in the “individual-loss” group.
As mentioned in the Dependent Variables section, negative emotions were measured by three variables: sad, guilty, and fearful. The mean scores of sad are 3.38 (SD = 1.27) and 3.65 (SD = 1.06) in the individual-loss and family-loss group, respectively. The mean scores of guilty are 2.16 (SD = 1.17) and 1.86 (SD = 1.07) in the individual-loss and family-loss group,
respectively. The mean scores of fearful are 2.84 (SD = 1.23) and 2.75 (SD = 1.36) in the individual-loss and family-loss group, respectively.
Multiple regression on emotional variable sad reveals significant difference between groups (β = 0.33, 95% confidence interval = (0.00, 0.66), t(180)=1.97, p = 0.049). The multiple regression gives an R2 of 0.07.Therefore there is evidence after controlling for potential
confounders that the participants who viewed the family-loss message felt sadder than those who viewed the individual-loss message.
Multiple regression on emotional variable guilty reveals no significant difference between groups (β = -0.19, 95% confidence interval = (-0.51, 0.12), t(180)=-1.22, p = 0.222). The
the level of guilty feeling is higher among those in the family-loss group than those in the individual-loss group.
Multiple regression on emotional variable fearful reveals no significant difference between groups (β = -0.03, 95% confidence interval = (-0.40, 0.34), t(180)=-0.16, p = 0.874). The multiple regression gives an R2 of 0.06. So there is no evidence that supports the hypothesis that the level of fearful feeling is higher among those in the family-loss group than those in the individual-loss group.
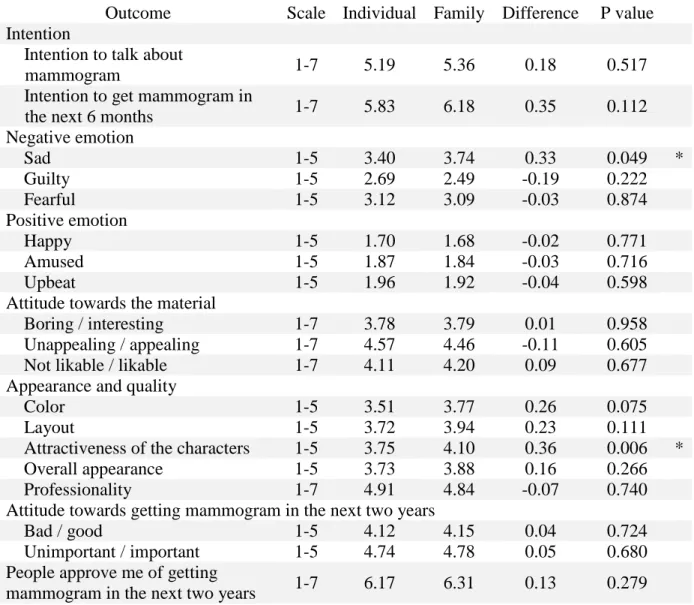
The confounder-adjusted mean of all outcomes for the two study groups as well as the between-group difference and corresponding p values are summarized in Table 5.2.
Table 5.2. Estimated mean outcome measures by study group adjusting for race, education, income, and mammogram history
Outcome Scale Individual Family Difference P value Intention
Intention to talk about
mammogram 1-7 5.19 5.36 0.18 0.517
Intention to get mammogram in
the next 6 months 1-7 5.83 6.18 0.35 0.112
Negative emotion
Sad 1-5 3.40 3.74 0.33 0.049 *
Guilty 1-5 2.69 2.49 -0.19 0.222
Fearful 1-5 3.12 3.09 -0.03 0.874
Positive emotion
Happy 1-5 1.70 1.68 -0.02 0.771
Amused 1-5 1.87 1.84 -0.03 0.716
Upbeat 1-5 1.96 1.92 -0.04 0.598
Attitude towards the material
Boring / interesting 1-7 3.78 3.79 0.01 0.958
Unappealing / appealing 1-7 4.57 4.46 -0.11 0.605
Not likable / likable 1-7 4.11 4.20 0.09 0.677
Appearance and quality
Color 1-5 3.51 3.77 0.26 0.075
Layout 1-5 3.72 3.94 0.23 0.111
Attractiveness of the characters 1-5 3.75 4.10 0.36 0.006 *
Overall appearance 1-5 3.73 3.88 0.16 0.266
Professionality 1-7 4.91 4.84 -0.07 0.740
Attitude towards getting mammogram in the next two years
Bad / good 1-5 4.12 4.15 0.04 0.724
Unimportant / important 1-5 4.74 4.78 0.05 0.680 People approve me of getting
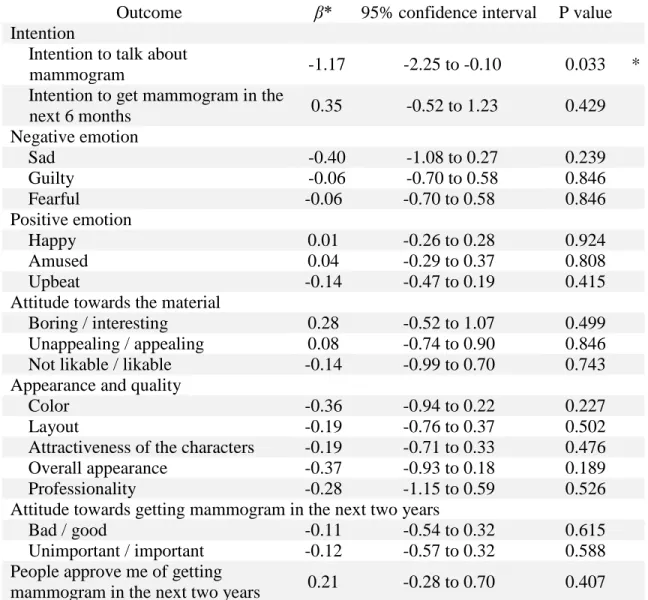
Hypothesis 4: Moderating effect of number of children living in the family unit
The fourth hypothesis predicted that difference between the two study groups in the
outcomes specified in hypothesis 1, 2, and 3 will increase as the number of children goes up. To investigate the moderating effect of number of children living in the family unit on the group difference for the above tested outcomes (intention to do mammogram, intention to talk about mammogram, level of sad, guilty, and fearful), a multiple regression with aforementioned confounders plus the main effect of number of children living in the family unit and the
interaction between it and study group was performed for each of the outcomes. The number of children was treated as a continuous variable in the analysis. None of the regression coefficients of the interaction terms is significant in the five regression models. Therefore, there is no
evidence that there is any moderating effect of number of children living in the family unit on the group difference. H4 was not supported.
Stimpson et al. (2009) classified women into three groups (having no children, having 1 child, having more than 1 child) and found that women with no children are significantly
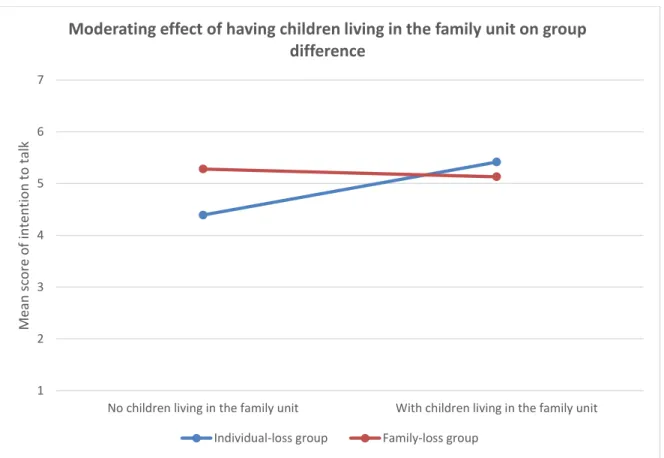
Figure 5.1. Moderating effect of having children in the family unit on group difference in intention to talk about mammogram.
1 2 3 4 5 6 7
No children living in the family unit With children living in the family unit
Me
an
sc
o
re
o
f
in
ten
tio
n
to
t
alk
Moderating effect of having children living in the family unit on group difference
Table 5.3. Moderating effect of having children in the family unit on the group difference
Outcome β* 95% confidence interval P value Intention
Intention to talk about
mammogram -1.17 -2.25 to -0.10 0.033 *
Intention to get mammogram in the
next 6 months 0.35 -0.52 to 1.23 0.429
Negative emotion
Sad -0.40 -1.08 to 0.27 0.239
Guilty -0.06 -0.70 to 0.58 0.846
Fearful -0.06 -0.70 to 0.58 0.846
Positive emotion
Happy 0.01 -0.26 to 0.28 0.924
Amused 0.04 -0.29 to 0.37 0.808
Upbeat -0.14 -0.47 to 0.19 0.415
Attitude towards the material
Boring / interesting 0.28 -0.52 to 1.07 0.499 Unappealing / appealing 0.08 -0.74 to 0.90 0.846 Not likable / likable -0.14 -0.99 to 0.70 0.743 Appearance and quality
Color -0.36 -0.94 to 0.22 0.227
Layout -0.19 -0.76 to 0.37 0.502
Attractiveness of the characters -0.19 -0.71 to 0.33 0.476
Overall appearance -0.37 -0.93 to 0.18 0.189
Professionality -0.28 -1.15 to 0.59 0.526
Attitude towards getting mammogram in the next two years
Bad / good -0.11 -0.54 to 0.32 0.615
Unimportant / important -0.12 -0.57 to 0.32 0.588 People approve me of getting
mammogram in the next two years 0.21 -0.28 to 0.70 0.407
5.4 Probing of the interaction
Since there is a significant moderating effect of having children in the family unit or not on the group difference in the outcome of intention to talk about mammogram, I conducted subgroup analysis on women living with children (N = 125) and women not living with children (N = 75) to assess the group effect in these two subgroups separately. Specifically, a multiple regression controlling for the same covariates as in the full sample analysis was performed for each subgroup. It is found that there is no significant difference in the intention to talk about mammogram between individual-loss and family-loss groups for those women living with children (β = -0.36, 95% confidence interval = (-1.03, 0.31), t(110)=-1.04, p = 0.298). The multiple regression gives an R2 of 0.12. However, there is a significant difference in the
intention to talk about mammogram between individual-loss and family-loss groups for women not living with children (β = 0.99, 95% confidence interval = (0.14, 1.83), t(61)=2.28, p = 0.022). The multiple regression gives an R2 of 0.18. Therefore, for women not living with children, those who viewed the individual –loss message are less likely to talk about mammogram with their family members than those who viewed the family-loss message.
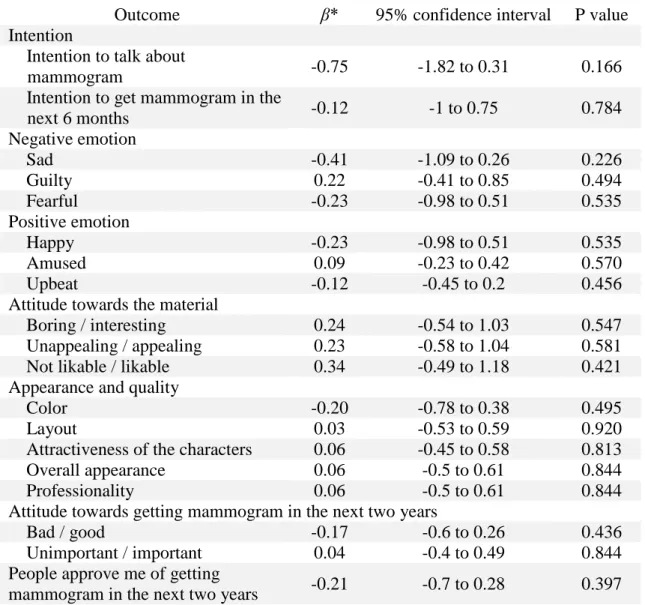
Hypothesis 5: Moderating effect of marital status
The fifth hypothesis predicted that the difference between the two study groups in the outcomes specified in hypothesis 1, 2, and 3 will be larger in married women than that in single women.
Table 5.4. Moderating effect of marital status on the group difference
Outcome β* 95% confidence interval P value Intention
Intention to talk about
mammogram -0.75 -1.82 to 0.31 0.166
Intention to get mammogram in the
next 6 months -0.12 -1 to 0.75 0.784
Negative emotion
Sad -0.41 -1.09 to 0.26 0.226
Guilty 0.22 -0.41 to 0.85 0.494
Fearful -0.23 -0.98 to 0.51 0.535
Positive emotion
Happy -0.23 -0.98 to 0.51 0.535
Amused 0.09 -0.23 to 0.42 0.570
Upbeat -0.12 -0.45 to 0.2 0.456
Attitude towards the material
Boring / interesting 0.24 -0.54 to 1.03 0.547
Unappealing / appealing 0.23 -0.58 to 1.04 0.581
Not likable / likable 0.34 -0.49 to 1.18 0.421
Appearance and quality
Color -0.20 -0.78 to 0.38 0.495
Layout 0.03 -0.53 to 0.59 0.920
Attractiveness of the characters 0.06 -0.45 to 0.58 0.813
Overall appearance 0.06 -0.5 to 0.61 0.844
Professionality 0.06 -0.5 to 0.61 0.844
Attitude towards getting mammogram in the next two years
Bad / good -0.17 -0.6 to 0.26 0.436
Unimportant / important 0.04 -0.4 to 0.49 0.844 People approve me of getting
mammogram in the next two years -0.21 -0.7 to 0.28 0.397
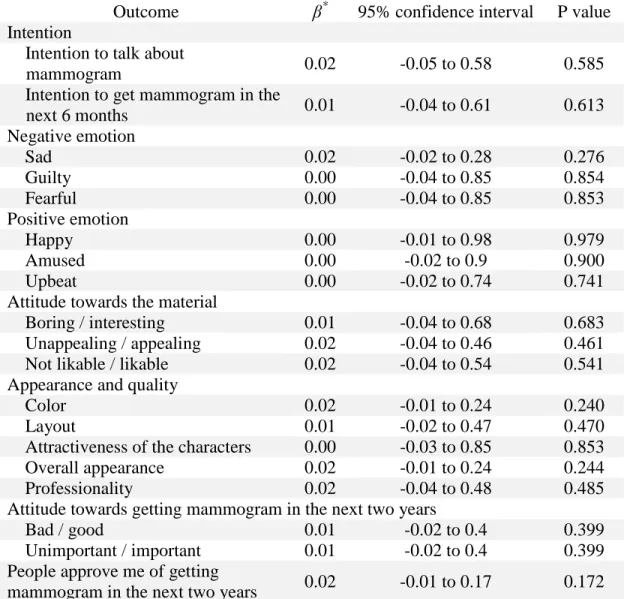
Hypothesis 6: Moderating effect of age of the youngest child
The sixth hypothesis predicted that the difference between the two study groups in the outcomes specified in hypothesis 1, 2, and 3 will increase as the age of the youngest child decreases.
Since the age of the youngest child is only available for participant living with children, the investigation on the moderating effect of the age of the youngest child living in the family unit on group difference as stated in hypothesis 6 is in effect a subgroup analysis on women living with children. A multiple regression was carried out for each of the five outcomes with adjustment for the same potential confounders as used in the full sample analyses plus the main effect of the age of the youngest child living in the family unit and the interaction between it and study group for those participants living with children. No significance is found in the regression coefficient of the interaction term for any of the five outcomes. The detailed results are
Table 5.5. Moderating effect of the age of youngest child on the group difference
Outcome β* 95% confidence interval P value Intention
Intention to talk about
mammogram 0.02 -0.05 to 0.58 0.585
Intention to get mammogram in the
next 6 months 0.01 -0.04 to 0.61 0.613
Negative emotion
Sad 0.02 -0.02 to 0.28 0.276
Guilty 0.00 -0.04 to 0.85 0.854
Fearful 0.00 -0.04 to 0.85 0.853
Positive emotion
Happy 0.00 -0.01 to 0.98 0.979
Amused 0.00 -0.02 to 0.9 0.900
Upbeat 0.00 -0.02 to 0.74 0.741
Attitude towards the material
Boring / interesting 0.01 -0.04 to 0.68 0.683 Unappealing / appealing 0.02 -0.04 to 0.46 0.461 Not likable / likable 0.02 -0.04 to 0.54 0.541 Appearance and quality
Color 0.02 -0.01 to 0.24 0.240
Layout 0.01 -0.02 to 0.47 0.470
Attractiveness of the characters 0.00 -0.03 to 0.85 0.853
Overall appearance 0.02 -0.01 to 0.24 0.244
Professionality 0.02 -0.04 to 0.48 0.485
Attitude towards getting mammogram in the next two years
Bad / good 0.01 -0.02 to 0.4 0.399
Unimportant / important 0.01 -0.02 to 0.4 0.399 People approve me of getting
mammogram in the next two years 0.02 -0.01 to 0.17 0.172
5.5 Supplementary analysis
Level of positive emotion
Supplementary analysis was run to check if there is any unintended positive emotion induced by the two ads and if there is any significant difference in positive emotion scores between the two groups.
Positive emotion was measured by happy, amused, and upbeat. The mean scores of happy
are 1.14 (SD = 0.54) and 1.09 (SD = 0.48) in the individual-loss and family-loss group, respectively. The mean scores of amused are 1.19 (SD = 0.71) and 1.13 (SD = 0.50) in the individual-loss and family-loss group, respectively. The mean scores of upbeat are 1.21 (SD = 0.68) and 1.14 (SD = 0.55) in the individual-loss and family-loss group, respectively.
Multiple regression on emotional variable happy reveals no significant difference between groups (β = -0.020, 95% confidence interval = (-0.15, 0.11), t(180)=-0.28, p = 0.771). The multiple regression gives an R2 of 0.06.Therefore there is no evidence after controlling for potential confounders that the participants who viewed the family-loss message felt happier than those who viewed the individual-loss message.
Multiple regression on emotional variable amused reveals no significant difference between groups (β = -0.030, 95% confidence interval = (-0.19, 0.13), t(180)=-0.36, p = 0.716). The multiple regression gives an R2 of 0.18. So there is no evidence that supports the hypothesis that the level of amused feeling is higher among those in the family-loss group than those in the individual-loss group.
that the level of upbeat feeling is higher among those in the family-loss group than those in the individual-loss group.
The confounder-adjusted mean of all outcomes for the two study groups as well as the between-group difference and corresponding p values are summarized in Table 5.2.
Appearance and quality of the material
CHAPTER 6: DISCUSSION
This paper sought to compare the effectiveness of an “individual-loss” message and “family-loss” message in influencing women’s intention to get mammogram, to talk about mammogram, and in evoking their negative emotions. The paper also examined the moderating effect of having children in the family unit or not, age of the youngest child and marital status on the group difference for screening and talking intention and level of negative emotions.
Overall, there is no evidence that family-loss message induces higher intention for
women to take or talk about mammogram compared to the individual loss message. Nevertheless, the direction is right in that the estimated mean differences are both positive (0.37 for intention to get mammogram and 0.13 for intention to talk about mammogram). In addition, the upper bounds of the 95% confidence intervals reached 0.8 and 0.73 for intention to take mammogram and to talk about mammogram, respectively, on a seven point scale, these figures are big enough to have some practical meaning. Therefore, family loss message is still potentially more effective than individual loss message in increasing women’s screening intention and willingness to talk about mammogram. A larger scale study with more participants is needed to confirm the effectiveness.
2010). However, what is worth noting is that the observed difference in the level of sadness may not be solely attributed to the theme difference but attractiveness of characters, as viewers consider the characters on “family-loss” message significantly more attractive than the one in “individual-loss” message, though no difference is found in the liking of color, layout, overall appearance and professional design. There is no evidence that family-loss message makes viewers feel more guilty or fearful in comparison to the individual loss message. These findings suggested that “family-loss” message can elicit more sadness among female viewers.
Group effect on intention to talk about mammogram is moderated by whether having children in the family unit or not, but no evidence that it is moderated by age of the youngest child and marital status. An individual subgroup analysis reveals somewhat surprising yet noteworthy findings that among participants with no children living with them, those in the individual-loss group are less likely to talk about mammogram than those in the family-loss group. Yet among participants that live with children this difference is not observed between the two study groups. Intuitively, one would expect that the effect of family-loss message in
comparison to individual-loss message would be more prominent in women living with children than those not living with children. But the observations suggest the opposite. Further research such as qualitative studies is needed to explain the in-depth reason behind it.
limitation of using real-world intervention material. In future studies, text only messages that are different in themes maybe considered for their easy-to-manipulate nature.
Second, in this study, the survey question on number of children is phrased as such that women who never have children in their life and women who have children but none of the children is living with them will give the same answer of “0”. Consequently, these two groups of women are considered as one category in the analyses and result interpretation. However, in future studies it may be of interest to categorize women by whether they ever have children or not regardless of whether their children are currently living with them, and examine the moderating effect of this categorical variable.
Third, participants assessed the web survey under non-lab setting. It is possible that they were not attentive to the promotion materials or the subsequent questions and therefore the assessment may not be accurate. To minimize the possibility of inattentiveness, an open-ended comprehension question was presented below the promotion material to elicit more in-depth processing and thinking.
Fourth, due to the social desirability issues, participants may want to be perceived as healthy or responsive to preventive behavior. As a result, the intention to take a mammogram was relatively high for both conditions, but in the real world it may not necessarily be the case. It is also possible that participants intend to satisfy the researcher.
Fifth, only behavioral intention, not the actual screening behavior, was assessed. Although the Theory of Planned Behavior suggests that intention is a strong predictor of
Sixth, a number of tests were run to examine the effect of the two themes, therefore there is a random chance of finding significance and the results maybe false positive. In another word, there might not have been a difference in effectiveness between both messages. However, it is not necessary a bad thing. If two messages are equally effective, that allows more options and diversity in messaging in the real world. Both themes can elicit discussions and thoughts. The family-loss theme makes women who have no children living in the family get the chance to talk about the family impact of getting breast cancer. And women who have children living in the family get the chance to think about the impact on themselves. Both are likely to amplify campaign effects.
CHAPTER 7: CONCLUSION
This study provides suggestive data that family-loss message may be more effective than individual-loss message in promoting intention to take or talk about mammogram. It provides evidence that family-loss message can evoke more sadness emotion than individual-loss message in women. Among women who do not live with any children (either because they have no
children or because their children do not live with them) the family-loss message significantly increases their intention to talk about mammogram with their family members than the
APPENDIX A: SURVEY QUESTIONNAIRE
Thank you for agreeing to participate in this study. You will be asked to view a health promotion advertisement and to complete a short survey based on what you see. Survey
completion will take about 10 minutes. For proper display, please do NOT take the survey on a smartphone. Please use only a desktop/laptop computer, tablet, or iPad. Participation is
voluntary. Your responses won't be linked to your name in the analysis and reporting of data. After completing the survey, you will receive your MTurk confirmation code. You will need to copy and paste the code into the MTurk HIT. If you need more information, please contact Xiaokun Qian, UNC Chapel Hill, at [email protected] By clicking "Next" at the lower right corner of the screen, you confirm that you:
are female are 40-74 years old
do NOT have breast cancer history
live in the U.S. but outside the state of Minnesota
have ability to read English
are using a desktop/laptop computer, tablet, or iPad give consent to participate
After you click "Next," you confirm the above information and will be able to see the questions. Pre-screening questions:
First, a couple of questions about you.
What is your age? Please type in a whole number.
Sex What is your gender?
Female (1)
Male (2)
State In what state do you currently reside? Options: 52 states and “do not live in the U.S.” History Do you have breast cancer history?
Yes (1)
No (2)
Next you will see a health promotion advertisement. It consists of three images. The ad will be displayed only ONCE. Please view it carefully. Then answer the questions that follow. Please note that the graphics may take a while to load. Click "Next" to see the ad.
1. Please explain in your own words what the main message of the ad is (within 200 words):
2. Looking at the ad made me FEEL...
Not at all (1) A little (2) Some (3) Quite a bit (4) A lot (5)
sad (1)
guilty (2)
fearful (3)
happy (4)
amused (5)
upbeat (6)
3. After viewing the ad, how likely are you to talk with your family members or your healthcare provider about mammogram over the next two weeks?
1 (1) 2 (2) 3 (3) 4 (4) 5 (5) 6 (6) 7 (7)
extremely unlikely:extremely
likely (1)
4. How likely is it that you will get a mammogram done within the next two years?
1 (1) 2 (2) 3 (3) 4 (4) 5 (5) 6 (6) 7 (7)
extremely unlikely:extremely
likely (1)
5. Getting a mammogram within the next two years would be...
1 (1) 2 (2) 3 (3) 4 (4) 5 (5)
bad:good (1)
unimportant:important
6.Please rate the following statement:
People important to me would approve of me getting a mammogram in the next two years.
1 (1) 2 (2) 3 (3) 4 (4) 5 (5) 6 (6) 7 (7)
strong disagree:strongly
agree (1)
7.Please say how much you agree or disagree with the following statements: The message involves an individual.
1 (1) 2 (2) 3 (3) 4 (4) 5 (5) 6 (6) 7 (7)
strongly disagree:strongly
agree (1)
8. The message involves a family.
1 (1) 2 (2) 3 (3) 4 (4) 5 (5) 6 (6) 7 (7)
strongly disagree:strongly
agree (1)
9. What do you think of the ad?
1 (1) 2 (2) 3 (3) 4 (4) 6 (6)
boring:interesting (1)
unappealing:appealing
(2)
10. How do you like the following elements of the ad?
Dislike very much (1)
Dislike a little (2)
Neither dislike nor
like (3)
Like a little (4)
Like very much (5)
color (1)
layout (2)
attractiveness of the character(s) (3) overall appearance of the material (4)
11. Please say how much you agree or disagree with the following statement: I think the material is professionally designed.
1 (1) 2 (2) 3 (3) 4 (4) 5 (5) 6 (6) 7 (7)
strongly disagree:strongly
agree (1)
12. Thank you for your feedback. Now a few more questions about you. Do you consider yourself Hispanic/Latina?
Yes (1)
No (2)
13. What is your race? (Check all that apply.)
White (1)
Black or African American (2)
American Indian or Alaska Native (4)
Asian (8)
Pacific Islander (9)
14. Are you currently married?
Yes (1)
No (2)
Do not wish to respond (3)
15. How many children do you have? (CHILDREN is defined as your own children living in the family unit, INCLUDING adopted and step-children.)
Option: 0-12+
16. What is the age of your youngest child? (If you have ONE child, please type in his/her age.)Please type in a whole number. (If he/she is less than one year old, please round it to 1) 17. What is the highest grade or year of school you completed?
Never attended school or only attended kindergarten (1)
Grades 1 through 8 (Elementary) (2)
Grades 9 through 11 (Some high school) (3)
College 1 year to 3 years (Some college or technical school) (4)
College 4 years or more (college graduate) (5)
18. What is your annual household income from all sources?
Less than $10,000 (1)
$10,001-$15,000 (2)
$15,001-$20,000 (3)
$20,001-$25,000 (4)
$25,001-$35,000 (5)
$35,001-$50,000 (6)
$50,001-$75,000 (7)
More than $75,000 (8)
Do not wish to respond (9)
19. Insurance Do you have any kind of health care coverage, including health insurance, prepaid plans such as HMOs, government plans such as Medicare, or Indian Health Service?
Yes (4)
No (5)
20. Mammogram Have you had mammogram in the past two years?
Yes (1)
No (2)
21. Device What device are you using to take this survey?
Computer (1)
iPhone (2)
iPod Touch (3)
Android Phone (4)
Blackberry (5)
iPad (6)
Tablet (7)
Other (please specify) (8) ____________________
22. These last two questions are optional. They provide a chance for you to share any thoughts with me about the survey. Is there anything you would like to say about the SUBJECT of the survey?
23. Is there anything you would like to say about the QUESTIONS in the survey?
24. Ok, that's it! If you need more information about mammogram, please visit the Centers for Disease Control and Prevention's
APPENDIX B: MECHANICAL TURK RECRUITMENT POST
Answer a short survey
We are conducting an academic study about health promotion advertisements. The survey will take about 10 minutes.
To take this survey, you must 1) be female, 2) be 40-74 years old, 3) do NOT have breast cancer history, 4) live in the U.S. but outside the state of Minnesota, 5) have ability to read English, and 6) have access to a desktop/laptop computer, tablet, or iPad. The survey should not be taken on a smartphone.
You will see a health promotion advertisement and provide your opinions on it. At the end of the survey, you will receive a code to paste into the box below to receive credit for taking the survey.
APPENDIX C: INTERVENTION MATERIALS
Theme 1: Individual loss
REFERENCES
Abood, D. A., Black, D. R., & Coster, D. C. (2005). Loss-framed minimal intervention increases mammography use. Women's Health Issues, 15(6), 258-264.
doi:10.1016/j.whi.2005.07.005
Abood, D. A., Coster, D. C., Mullis, A. K., & Black, D. R. (2002). Evaluation of a “loss-framed” minimal intervention to increase mammography utilization among medically un- and under-insured women. Cancer Detection & Prevention, 26(5), 394.
ACOG. (2011). Annual Mammograms Now Recommended for Women Beginning at Age 40. Retrieved from
http://www.acog.org/About_ACOG/News_Room/News_Releases/2011/Annual_Mammo grams_Now_Recommended_for_Women_Beginning_at_Age_40
ACS. (2013). Cancer Prevention & Early Detection Facts & Figures. Retrieved from
http://www.cancer.org/acs/groups/content/@epidemiologysurveilance/documents/docum ent/acspc-037535.pdf
Allen, S., & Pruthi, S. (2011). The mammography controversy: When should you screen?
Journal of Family Practice, 60(9), 524-29.
Azjen, I., Albarracín, D., & Hornick, R. (Eds.). (2007). Prediction and change of health behavior: Applying the reasoned action approach. Mahwah, NJ: Lawrence Erlbaum Associates.
Banks, S. M., Salovey, P., Greener, S., Rothman, A. J., Moyer, A., Beauvais, J., & Epel, E. (1995). The effects of message framing on mammography utilization. Health Psychology, 14(2), 178-184. doi:10.1037/0278-6133.14.2.178
Berinsky, A. J., Huber, G. A., Lenz, G. S., & Edited by R. Michael Alvarez. (2012). Evaluating online labor markets for experimental research: Amazon.com's mechanical turk. Political
Analysis, doi:10.1093/pan/mpr057
Bornstein, R. F. (1989). Exposure and affect: Overview and meta-analysis of research.
Psychological Bulletin, 106, 265–289.
BRFSS. (2013). 2013 Behavioral Risk Factor Surveillance System Questionnaire. Retrieved from http://www.cdc.gov/brfss/questionnaires/pdfques/2013%20BRFSS_English.pdf Brown, S. L., Gibney, T. M., & Tarling, R. (2013). Busy lifestyles and mammography screening:
Buhrmester, M., Kwang, T., & Gosling, S. D. (2011). Amazon's mechanical turk: A new source of inexpensive, yet high-quality, data? Perspectives on Psychological Science, 6(1), 3-5. doi:10.1177/1745691610393980
CDC. (2012). Cancer Screening — United States, 2010. Morbidity Mortality Weekly Report, 61(3).
CDC. (2013). Breast Cancer Statistics. Retrieved from http://www.cdc.gov/cancer/breast/statistics/ CDC. (2013). Tips from former smokers. Retrieved from
http://www.cdc.gov/tobacco/campaign/tips/resources/videos/terrie-videos.html#terrie CDC. (2014). Screen for Life. Retrieved from
http://www.cdc.gov/cancer/colorectal/sfl/tv_psa.htm
Champion, V. (1994). Relationship of Age to Mammography Compliance. CANCER Supplement, 74(1).
Cox, D., & Cox, A. D. (2001). Communicating the Consequences of Early Detection: The Role of Evidence and Framing. Journal Of Marketing, 65(3), 91-103.
De Coster, S., & Zito, R. (2013). Maternal roles and adolescent depression: Conditions and processes of influence. Sociological Perspectives, 56(1), 1-23.
Dillard, J., & Nabi, R. L. (2006). The Persuasive Influence of Emotion in Cancer Prevention and Detection Messages. Journal of Communication, 56S123-S139. doi:10.1111/j.1460-2466.2006.00286.x
Dillard, J. P., & Peck, E. (2001). Persuasion and the structure of affect. dual systems and discrete emotions as complementary models. Human Communication Research, 27(1) Retrieved from
https://auth.lib.unc.edu/ezproxy_auth.php?url=http://search.ebscohost.com/login.aspx?dir ect=true&db=bth&AN=5026004&site=ehost-live&scope=site
Dillard, J. P., Plotnick, C. A., Godbold, L. C., Freimuth, V. S., & Edgar, T. (1996). The multiple affective consequences of AIDS PSAs: Fear appeals do more than scare people.
Communication Research, 23, 44–72.
Ferriman, K., Lubinski D., & Benbow C. (2009). Work preferences, life values, and personal views of top math/science graduate students and the profoundly gifted: Developmental changes and gender differences during emerging adulthood and parenthood. Journal of
Personality and Social Psychology, 97, 517-532.
Huang, M. (1997). Is negative affect in advertising general or specific? A comparison of three functional forms. Psychology and Marketing, 14(3), 223-240. doi:10.1002/(SICI)1520-6793(199705)14:3<223::AID-MAR2>3.0.CO;2-D
Gender and well-being across the lifespan (pp. 200-207). New York, NY US: Oxford University Press.
Jarvis,. (1996). The association between having children, family size and smoking cessation in adults. Addiction, 91(3), 427-434. doi:10.1111/j.1360-0443.1996.tb02292.x
Kahneman, D., & Tversky, A. (1979). Prospect Theory: An Analysis of Decision under Risk.
Econometrica, 47 (2), 263-292.
Katz, S. J., & Hofer, T. P. (1994). Socioeconomic Disparities in Preventive Care Persist Despite Universal Coverage. JAMA, 272(7).
Kim, J., & Jang, S.N. (2008). Socioeconomic Disparities in Breast Cancer Screening among US Women: Trends from 2000 to 2005. J Prev Med Public Health, 41(3), 186–194.
Lipkus, I. M., Ranby, K. W., Lewis, M. A., & Toll, B. (2013). Reactions to framing of cessation messages: Insights from dual-smoker couples. Nicotine & Tobacco Research, 15(12), 2022-2028.
Mandelblatt, J. S., Cronin, K. A., Bailey, S., Berry, D. A., de Koning, H. J., Draisma, G., . . . , . (2009). Effects of mammography screening under different screening schedules: Model estimates of potential benefits and harms. Annals of Internal Medicine, 151(10), 738-747. doi:10.7326/0003-4819-151-10-200911170-00010
MDH. (2013). Breast and Cervical Cancer Screening - Sage Program. Retrieved from http://www.health.state.mn.us/divs/hpcd/ccs/screening/sage/
Meyerowitz, B. E., & Chaiken, S. (1987). The effect of message framing on breast self-examination attitudes, intentions, and behavior. Journal of Personality and Social
Psychology, 52(3), 500-510.
Mitchell, A.A., Olson, J.C. (1981), Are Product Attribute Beliefs the Only Mediator of
Advertising Effects on Brand Attitude? Journal of Marketing Research, 18 (3), 318-332. Montano, D. E., & Taplin, S. H. (1991). A test of an expanded theory of reasoned action to
predict mammography participation. Social Science & Medicine, 32(6), 733-741. doi:10.1016/0277-9536(91)90153-4
Paolacci, G., Chandler, J., & Ipeirotis, P. G. (2010). Running experiments on amazon mechanical turk. Judgment and Decision Making, 5(5), 411-419. doi:http://journal.sjdm.org
Perrone, K. M., Wright, S. L., & Jackson, Z. (2009). Traditional and Nontraditional Gender Roles and Work-Family Interface for Men and Women. Journal of Career Development, 36(1), 8-24.
Pew. (2013). Modern Parenthood - Roles of Moms and Dads Converge as They Balance Work and Family. Retrieved from
http://www.pewsocialtrends.org/files/2013/03/FINAL_modern_parenthood_03-2013.pdf Rauscher, G. H., Allgood, K. L., Whitman, S., & Conant, E. (2012). Disparities in Screening
Mammography Services by Race/Ethnicity and Health Insurance. Journal of Women's
Health (15409996), 21(2), 154-160. doi:10.1089/jwh.2010.2415
Rhoads, S. E., & Rhoads, C. H. (2012). Gender roles and infant/toddler care: Male and female professors on the tenure track. Journal Of Social, Evolutionary, And Cultural Psychology, 6(1), 13-31. doi:10.1037/h0099227
Rothman, A. J., Salovey, P., Antone, C., Keough, K., & Martin, C. D. (1993). The influence of message framing on intentions to perform health behaviors. Journal of Experimental Social Psychology, 29(5), 408-433. Retrieved from
https://auth.lib.unc.edu/ezproxy_auth.php?url=http://search.ebscohost.com/login.aspx?dir ect=true&db=psyh&AN=1994-10977-001&site=ehost-live&scope=site
Salovey, P., & Williams-Piehota, P. (2004). Field Experiments in Social Psychology. American
Behavioral Scientist, 47(5), 488-505. doi:10.1177/0002764203259293
Schneider, T. R., Salovey, P., Apanovitch, A., Pizarro, J., McCarthy, D., Zullo, J., & Rothman, A. J. (2001). The effects of message framing and ethnic targeting on mammography use among low-income women. Health Psychology, 20(4), 256-266. doi:10.1037/0278-6133.20.4.256
Southwell, B. G., & Yzer, M. C. (2007). The roles of interpersonal communication in mass media campaigns. In C. Beck (Ed.), Communication yearbook 31 (pp. 420–462). New York: Lawrence Erlbaum.
Stimpson, J., Wilson, F., & Reyes-Ortiz, C. (2009). Influence of number of children on cancer screening among adults in the United States. Journal Of Medical Screening, 16(4), 170-173. doi:10.1258/jms.2009.009056