EFFECTS OF MALARIA ENDEMICITY ON THE DEVELOPMENT OF IMMUNITY IN KENYAN CHILDREN
Cynthia Joy Snider
A dissertation submitted to the faculty of the University of North Carolina at Chapel Hill in partial fulfillment of the requirements for the degree of Doctor of Philosophy in
the Department of Epidemiology.
Chapel Hill 2011
Approved by:
Steve Meshnick, MD, PhD (Chair) Stephen Cole, PhD
ABSTRACT
CYNTHIA JOY SNIDER: Effects of Malaria Endemicity on the Development of Immunity in Kenyan Children
(Under the direction of Steve Meshnick, MD, PhD)
The heterogeneity of Plasmodium falciparum (Pf-) malaria endemicity affords an opportunity to explore the differential effects of Pf-malaria infections on the development of immunity. Focusing on two areas in western Kenya with disparate
ACKNOWLEDGEMENTS
My journey to earn a doctorate was under the guidance and with the support from a number of individuals I would like to acknowledge. First and foremost is my committee chair and advisor Steve Meshnick who was willing to take on an orphaned student whose only common interest was malaria. Steve epitomizes the graduate student advisor: direct, problem-solver, resourceful, patient yet persistent, and self-less. I am indebted to him for helping me accomplish a life-long goal.
I would also like to recognize Ann Moormann who generously shared her data and expertise, and was a constant resource throughout the process. Ann challenged me to think beyond the results and to examine the broader implications of our research. I am also grateful to Steve Cole and his students for their assistance in identifying appropriate methodological approaches to examine the Kisumu/Nandi cohort data. Nancy Raab-Traub’s expertise in Epstein-Barr virus proved to be an invaluable asset. Due to our shared passion for applied epidemiology, Pia MacDonald has been a mentor for me both in and out of the classroom. In particular, I appreciated her critical eye and exemplary writing style which has strengthened my own writing skills.
Training grant (2009-2010). The original Kisumu/Nandi cohort data were collected using funds from NIH grants (R01 CA134051 and K08 AI51535).
TABLE OF CONTENTS
LIST OF TABLES ... x
LIST OF FIGURES ... xi
LIST OF ABBREVIATIONS ... xii
CHAPTER ONE: SPECIFIC AIMS ... 1
CHAPTER TWO: BACKGROUND AND SIGNFICANCE ... 5
Malaria ... 5
Recurrent Pf-malaria and EBV Co-infection ... 6
Naturally Acquired Immunity to Pf-malaria Infection ... 18
Summary ... 31
CHAPTER THREE: DESCRIPTION OF DATA SOURCES ... 40
CHAPTER FOUR: METHODS ... 46
Specific Aim 1 ... 46
Specific Aim 2 ... 54
CHAPTER FIVE: Recurrent Plasmodium falciparum Malaria Infections in Kenyan Children Diminish T-cell Immunity to Epstein Barr Virus Lytic but not Latent Antigens . 62 ABSTRACT ... 62
INTRODUCTION ... 63
METHODS ... 64
CHAPTER SIX: Children’s Antibody Responses to Select Malaria Antigens
Differentially Develop and Wane by Malaria Transmission Intensity in Kenya ... 87
ABSTRACT ... 87
INTRODUCTION ... 88
METHODS ... 90
RESULTS ... 93
DISCUSSION ... 101
CONCLUSION ... 109
CHAPTER SEVEN: DISCUSSION ... 119
APPENDIX A: CWRU/KEMRI Blood Sample Collection and Questionnaire Form 1... 124
APPENDIX B: Calculation of Inverse Probability Weights ... 125
LIST OF TABLES
TABLE 2.1. Summary of Pf-malaria and EBV research related to T-cell response. 38 TABLE 3.1. Summary of children enrolled in the Kisumu/Nandi Cohort Study ... 44 TABLE 3.2. Summary of survey periods and corresponding number of participants. ... 45 TABLE 5.1. Summary of participants in the Kisumu/Nandi Cohort, Kenya 2002- 2004 ... 82 TABLE 5.2. Prevalence and magnitude of EBV-specific CD8+ T-cell IFN-γ
LIST OF FIGURES
FIGURE 2.1. The geographic distribution of malaria risk, 2010 ... 32
FIGURE 2.2. The lymphoma belt of Africa showing the approximate distribution of tumors. ... 33
FIGURE 2.3. Images of a girl and boy with eBL tumor manifestations in different areas of the body. ... 34
FIGURE 2.4. Chronology of proposed events in the carcinogenesis of eBL ... 34
FIGURE 2.5. The lifecycle of the malaria parasite. ... 35
FIGURE 2.6. The blood-stage lifecycle of Plasmodium ... 36
FIGURE 2.7. Population indices of immunity to malaria in Kilifi, Kenya ... 37
FIGURE 3.1. Map of Kisumu and Nandi districts by levels of malaria endemicity, Kenya. ... 44
FIGURE 4.1. Causal diagrams depicting the relationship between Pf-malaria and EBV-specific latent and lytic CD8+ T-cell IFN- response. ... 60
FIGURE 4.2. Power estimates for log-binomial regression using GEE to account for three repeated measures. ... 61
FIGURE 5.1. Malaria incidence in the highland area of Kipsamoite, 2001-2004. ... 78
FIGURE 5.2. Change in the prevalence of positive EBV lytic (A and C) and latent (B and D) antigen CD8+ T-cell IFN-γ response by age group at baseline, Kenya 2002-2004. ... 80
FIGURE 5.3. Prevalence of positive EBV lytic (A) and latent (B) antigen CD8+ T-cell IFN-γ response by age group and district of residence, Kenya 2002-2004. ... 81
FIGURE 6.1. Proportion of IgG positive malaria antibody responses ( >1 arbitrary units) by age group at baseline and six-month follow-up in Kisumu (A and B) and Nandi (C and D) in Kenya, 2002-2003 ... 111
LIST OF ABBREVIATIONS AIDS Acquired Immunodeficiency Syndrome AMA-1 Apical Membrane Antigen - 1
CI Confidence Interval
CIDR1α Cysteine-rich Interdomain Region 1α CTL Cytotoxic T-lymphocyte
eBL endemic Burkitt’s lymphoma EBNA Epstein-Barr Nuclear Antigen EBV Epstein-Barr Virus
EMM Effect Measure Modifier
EIR Entomological Inoculation Rates ELISPOT Enzyme-linked Immunospot Assay GEE Generalized Estimating Equations GLM Generalized Linear Model
Hb Hemoglobin (AS, SS = sickle cell trail; AA = not sickle cell trait) HIV Human Immunodeficiency Virus
IgG Immunoglobulin IFN-γ Interferon-gamma
IRB Institutional Review Board LSA-1 Liver Stage Antigen – 1 LLPC Long-lived Plasma Cells LCL Lymphoblastoid Cell Line
MTI Malaria Transmission Intensity MSP-1 Merozoite Surface Protein - 1 MBC Memory B-cells
NAI Naturally Acquired Immunity OR Odds Ratio
PfEMP1 Plasmodium falciparum Erythrocyte Membrane Protein 1
Pf-malaria Plasmodium falciparum malaria PBMC Peripheral Blood Mononuclear Cells PBS Phosphate Buffer Saline
PHA Phytohemmagglutinin PR Prevalence Ratio RBC Red Blood Cells
CHAPTER ONE: SPECIFIC AIMS
Malaria is one of the leading causes of morbidity and mortality around the world, causing an estimated 225 million illnesses in 2009, resulting in approximately 781,000 deaths.1 The global burden disproportionately affects those living in sub-Saharan Africa where 78% of illnesses and 91% of deaths were reported.1 Furthermore, children <5 years of age carry the highest burden of morbidity and mortality; globally 85% of deaths were in this age groups.1
What is clear is that the global burden of Pf-malaria infections reaches beyond the numbers. The incidence of malaria is decreasing in many parts of the world, but a need remains for an effective vaccine to supplement traditional control measures such as indoor residual spraying, insecticide treated bednets, and chemotherapy if reductions in morbidity and mortality are to be sustained.6 Differential patterns of naturally acquired immunity exist between areas with varying levels of malaria transmission and this may be partially explained by the short lifespan of antibody responses. Studies have attempted to identify immunological markers of Pf-malaria infections in areas of high malaria transmission, but few studies have been conducted in areas of low malaria transmission.
We exploited the heterogeneous malaria transmission intensities of two areas in western Kenya to examine the issues we have raised. First, we investigated the role of recurrent Pf-malaria exposure on EBV-specific cellular immunity. Building upon cross-sectional ecological studies that have examined the effect of district-level
Pf-malaria exposure on EBV infection, we incorporated additional time points to elucidate the longitudinal association of these two pathogens. We then explored the patterns of naturally acquired immunity in these two settings, describing the relative change in antibodies over time.
Specific Aim 1. To assess the effect of recurrent Pf-malaria exposure on
Hypothesis: Recurrent Pf-malaria infections deplete EBV-specific CD8+ T-cell IFN-γ responses.
Overview: We used data collected from a cohort of children 10 months to 15 years of age residing in two areas of disparate malaria transmission intensities to examine changes in EBV-specific CD8+ T-cell lytic and latent responses over a two-year time period. We used a district- and individual-level definition of recurrent Pf-malaria to explore if malaria transmission intensity (district-level definition) is an adequate surrogate for individual-level Pf-malaria exposure.
Specific Aim 2.
a. To describe malaria antibody responses among children in malaria holoendemic and hypoendemic areas, contrasting any differences between the areas.
Hypothesis: Children residing in holoendemic areas should have higher levels of antibodies to blood-stage antigens than children residing in hypoendemic areas. In addition, antibody responses to blood-stage antigens in the holoendemic area should show an age-trend whereas antibodies should be relatively evenly distributed across age groups in the hypoendemic area.
Hypothesis: Antibodies to blood-stage antigens are reportedly short-lived therefore antibodies should decrease over time. Yet children in holoendemic areas should have developed protective immunity such that the magnitude of their decrease should be less than children residing in malaria hypoendemic areas.
Overview: We used data from a cohort of children 10 months to 15 years of age residing in two areas characterized by heterogeneous malaria transmission intensities to describe the prevalence of positive antibody responses to select blood-stage antigens. We calculated the relative change in antibody responses over a six-month period to characterize the change over time.
CHAPTER TWO: BACKGROUND AND SIGNFICANCE
Areas of heterogeneous malaria transmission intensity (MTI) provide a natural setting to investigate the influence of malaria infection on the development of immunity in children. The unique geographic distribution of eBL cases in high Pf-malaria transmission areas of sub-Saharan Africa and Papua New Guinea led investigators to conclude that holoendemic Pf-malaria exposure played a role in the pathogenesis of eBL.7-9 Furthermore, differential patterns of naturally acquired immunity (NAI) to severe malaria between populations exposed to varying levels of malaria have been observed in a number of studies.10, 11 In this chapter, the role of
Pf-malaria infection in the development of eBL and Pf-malaria humoral immunity will be reviewed after a general introduction to malaria.
Malaria
There are five species of the Plasmodium parasite that infect humans; we will focus on Plasmodium falciparum which is responsible for the majority of human infections, including severe manifestations such as cerebral malaria, severe anemia, respiratory distress, and kidney failure.13 Plasmodium parasites are restricted in geography to the distribution of the Anopheles vector.13 Generally, these are areas where the temperatures ranges from 16-33oC and the altitude is less than 2,000 meters.14 Approximately 50% of the world’s population live in malarious areas of sub-Saharan Africa, Asia, Central and South America, and the Pacific Islands (Figure 2.1).13, 15 Areas of high malaria transmission are found predominantly in sub-Saharan Africa and Southeast Asia.15
The MTI depends on temperature, rainfall, vector, and the availability of infected humans. Historically, classification has been according to the proportion of children 2-9 years old with parasitemia or splenomegaly.14 Hypoendemic (<10%) and mesoendemic (11-50%) areas have seasonal or unstable malaria transmission whereas hyperendemic (50-75%) and holoendemic (>75%) areas have stable malaria transmission.14 In recent years, the use of entomological inoculations rates (EIR) has also been utilized to characterize MTI. Areas with an EIR < 10 have been used to describe areas of unstable and low transmission whereas areas with EIR > 10 typically have high and stable transmission.16
Recurrent Pf-malaria and EBV Co-infection
eBL.2 Yet the mechanism of interaction between the two pathogens remains
unknown. To appreciate why this is, an understanding of eBL and EBV is necessary. Evidence linking these two diseases will be discussed as well as evidence that links
Pf-malaria infections to eBL. Discussion about how Pf-malaria infection could affect EBV persistence will be followed by what is currently known about the interaction of the two pathogens as it relates to CD8+ T-cell response.
Endemic Burkitt’s Lymphoma
eBL is an aggressive B-cell non-Hodgkin’s lymphoma in which tumors double in size within 24-48 hours.17-19
eBL is ultimately caused by a chromosomal translocation of the c-myc oncogene on chromosome 8 with one of the heavy or light immunoglobulin (Ig) chains.17, 20, 21 The c-myc proto-oncogene regulates cell apoptosis, differentiation and proliferation and the translocation of this gene leads to deregulation of vital cellular control.17, 22 Translocation is believed to be due to a very rare occurrence during gene rearrangement or class switching.23, 24
eBL was first characterized in 1958 by Denis Burkitt when he published his observations on 32 Ugandan children between the ages of 2-14 who presented with a sarcoma of the jaw.20 Additional findings and reports determined eBL was commonly observed in equatorial Africa (referred to as “The Lymphoma Belt”) but not in northern or southern Africa (Figure 2.2).25-28
in children <15 years in high malarious areas ranges from 5-15 per 100,000 per total population per year.17, 22, 25, 27, 29 eBL is commonly reported in children between the ages of 2-12 years with no cases reported in children <1 and few cases reported in 1 year-old children.20, 21, 25, 30 In general, the peak age range is 4-8 years, while in Kenya the peak age is 6 years.8, 12, 31, 32 Males are more often diagnosed with eBL than females with a sex ratio ranging from 1.6-3.2 males for every female diagnosed with eBL.12, 25, 27, 32, 33 This observation cannot be explained as there are no apparent differences in admissions rates between males and females.25
Although an aggressive cancer, eBL responds well to chemotherapy.8, 18, 26 Chemotherapeutic drugs are able to target tumor cells effectively as a result of the rapid cell proliferation.26 In addition, if a portion of the tumor can be removed, either by surgery or chemotherapy, there is indication the patient’s own immune system can control and eliminate the rest.26
stages of eBL evolution that still prevails today.2 The first stage entails primary EBV infection; dé The and colleagues identified that pre-eBL children had significantly higher antibody titers to the EBV viral capsid antigen (VCA) than matched controls.2, 27 Immunological modulation by recurrent
Pf-malaria exposure is the second step in the process. Pf-malaria has been proposed to impair EBV-specific T-cell immunity19, 35 and/or lead to proliferation of EBV-infected B-lymphocytes.2, 19 This impairment
and proliferation increases the probability of the occurrence of a c-myc translocation which leads to stage 3, the development of eBL.2, 19, 22
Studies of eBL etiology that directly examine the relationship between recurrent Pf-malaria and EBV are challenging. The relatively low incidence of eBL cases, 5-15 per 100,000 per total population per year depending on location, makes longitudinal cohort studies of eBL difficult to conduct.17, 22, 25, 27, 29 A prospective seroepidemiological study was conducted over a two year span collecting samples from 42,000 children less than 9 years old, of which only 14 eBL cases were available for inclusion in analyses.27 Furthermore, establishing temporality of exposure-outcome is an important concern for eBL case-control studies because there is no clearly established biomarker for the development of eBL. Likewise, there is no clear biomarker for the accumulation of repeated Pf-malaria infections. Furthermore, it is possible that EBV biomarkers (e.g., antibody titers, EBV load) assessed as exposures may in fact be the result of eBL disease (i.e., reverse causality).33
odds of high antibody levels to both EBV and Pf-malaria in eBL cases to be significantly higher than controls with low antibody levels to both EBV and Pf-malaria.33, 36 In one study, the odds ratio (OR) for the joint effect was 13.2 (95% confidence interval [CI]: 3.8-46.6) while the OR for Pf-malaria alone was 1.4 (95% CI: 0.3-6.3) and EBV alone was 5.7 (95% CI: 1.6-20.7).36 In the other study, the OR for the joint effect of EBV and Pf-malaria was 5.0 (95% CI: 2.8-8.9) while the OR for
Pf-malaria alone was 1.1 (95% CI: 2.4) and EBV alone was 1.0 (95% CI: 0.5-2.2).33 Although OR estimates are imprecise, the magnitude of association and the synergistic effect indicates that the interaction of the two pathogens play an important role in the pathogenesis of eBL.
There is an important interaction between recurrent Pf-malaria and EBV yet the mechanism behind the interaction is not well understood. In the absence of eBL longitudinal studies that could focus on the interplay between recurrent Pf-malaria and EBV, other types of studies can provide insights.
Epstein-Barr Virus Epidemiology of EBV
In developing countries, 99% of primary infections occur in children by the age of 3 years.22, 39 Maternal antibodies to EBV offers protection in young infants until 5-7 months.39 Infection in young children is asymptomatic and serological testing is often the only evidence of past infection.40-42 In contrast, the age of primary infection in developed countries is delayed until adolescence or young adulthood of which 35-50% presents as symptomatic infectious mononucleosis.5, 39, 43 The difference in age of primary infection is attributed to improved living
conditions and hygiene in developed countries. 41, 44 There has been some evidence that females have higher anti-VCA immunoglobulin (IgG) titers than males, although there does not appear to be any difference in the age of primary infection by sex.45, 46
Infection, Persistence, and Immune Response
EBV causes a life-long latent infection in resting memory B-lymphocytes.5, 19 A proportion of EBV-infected naïve B-lymphocytes escape the host’s immune system by migrating to lymph nodes where they pass through the follicle to form germinal center reactions, colonizing the resting memory B-lymphocyte pool.5, 19, 47 These EBV-infected memory B-lymphocytes contain viral genetic material but do not produce virions.5 Latently infected memory B-lymphocytes are capable of polyclonal proliferation or activation to the lytic cycle.41, 48 This latter shift occurs when latently-infected memory B-lymphocytes differentiate into plasma cells.47, 51
EBV primary infection leads to a strong T cell-mediated response which also dominates immunosurveillance and control of EBV latency.22, 35, 50, 52 Natural killer cells of the innate immune system are the first to respond during primary infection. 22 This is quickly followed by CTL response which targets both lytic and latent viral proteins.19, 35, 50 In healthy EBV seropositive individuals, EBV-specific memory CTL cells represent up to 5% of all circulating CTL cells, indicating the pivotal role of T-cell immunosurveillance in controlling EBV latent infection.19, 22, 50 EBV is a powerful B-lymphocyte mitogen that leads to continued proliferation in vivo and transformation to immortalized lymphoblastoid cell lines (LCL) in vitro.22, 42, 50, 53, 54 Failure to control latent infection leads to uncontrolled proliferation of EBV-infected B lymphocytes.22
CTL recognition, producing viral cytokines that enhance B-lymphocyte infectivity and counteract immune response, and inhibiting apoptosis.17, 37, 55-57
After primary infection, EBV load is dependent on immunosurveillance of latent EBV infection. EBV load in healthy seropositive individuals is stable over time with 1-50 latently infected cells per million circulating B-lymphocytes.55, 58 Increases in EBV loads may be a consequence of reduced T-cell control, as observed in post-transplantation patients and AIDS cases.49, 59 However no point prevalence correlation has been observed between EBV loads and EBV-specific CD8+ T-cell IFN-γ response.35 In addition, EBV DNA detected in plasma and serum is a combination of encapsidated and naked DNA, signifying active EBV replication and apoptosis, respectively.48, 58, 60 Individuals with a mixture of encapsidated and naked EBV DNA have the highest EBV loads.58
Relationship between EBV and eBL
EBV is a necessary but not a sufficient cause of eBL.24 It is recognized that chromosomal translocation of the c-myc oncogene initiates the development of eBL, yet there is evidence to suggest EBV has an active role in its pathogenesis. First, EBV was discovered in electron micrographs of cultured eBL cells.34 Subsequent tumor studies found approximately 97-98% of eBL tumors were positive for EBV. 2, 22, 50, 62 Second, eBL tumors develop from a cell (or cells) already infected with EBV,
suggesting EBV infection occurs in the early stages of the pathogenesis of eBL rather than after tumor development.24, 63 Third, individuals diagnosed with eBL had high anti-VCA titers prior to development of eBL.41, 44, 64, 65 As anti-VCA titers are stable over time, the high titers before and after eBL onset may indicate suppression of EBV-specific T-cell immunity. Fourth, EBV leads to the transformation of normal B-lymphocytes to immortalized LCL in vitro; in vivo, EBV leads to proliferation of EBV-infected B-lymphocytes.22, 42, 50, 53, 54 This proliferation increases the risk for eBL to emerge. Finally, EBV is linked to other cancers, such as nasopharyngeal carcinoma, and has demonstrated neoplastic growth in immunocompromised individuals suffering from B-lymphocyte lymphoproliferative disease.24, 27
Pf-malaria and EBV Co-infection
returns with parasite clearance indicating children with asymptomatic infection may still experience a degree of modulated immune response.22, 67-71
Malaria is a powerful B-lymphocyte mitogen. In vitro, the cysteine-rich interdomain region 1α (CIDR1α) domain of the P. falciparum erythrocyte membrane protein 1 (PfEMP1) is able to activate proliferation of B-lymphocytes from individuals with no previous malaria exposure.72 It targets activation of memory B-lymphocytes and also provides protection against apoptosis.73
A recent study demonstrated a direct link between CIDRα and EBV infected B-lymphocytes
suggesting CIDRα could trigger reactivation of EBV-infected B-lymphocytes during acute malaria infection.61 In areas of high malaria transmission, asymptomatic parasitemia may result in persistent proliferation of memory B-lymphocytes.73
Relationship between Pf-malaria and eBL
in the number of eBL cases thereby suggesting a link.7, 32 Furthermore in holoendemic areas where control programs were instituted, eBL is rarely detected.7
The coincidence of Pf-malaria infection and eBL suggests a temporal relationship. Symptomatic Pf-malaria peaks in children aged 2-3 years while eBL peaks in 4-8 years.74 Two additional interesting observations are noted in Burkitt’s work in Uganda. First, the average age of eBL patients in malarious areas was 8.1 years, while in low risk malarious areas it was 16.2 years.25 In addition, immigrants from unstable malaria transmission areas of Uganda who moved to holoendemic areas presented with eBL in late adolescents and adulthood, almost 50% over the age of 15.25 Morrow’s work also found a similar pattern as most adult cases of eBL that he identified were born in hypoendemic areas.32
Furthermore, there is also evidence that children with sickle cell trait (HbAS), which protects from severe Pf-malaria infections, have lower incidence of eBL than children without the trait (HbAA).75 Finally, eBL cells appear to have their origin in germinal-cells and chronic Pf-malaria infection induces germinal center hyperactivity.22, 24, 63 Viral reactivation coupled with expanded germinal centers increases the risk for a random mutation to occur in an EBV-infected germinal center lymphocyte.24, 63
Current Knowledge of the Effect of Recurrent Pf-malaria Infections on EBV Infection
An important criterion in establishing disease causality is that exposure occurs before disease. Recalling the chronology of the three stages of eBL progression – EBV infection, recurrent Pf-malaria, and eBL (i.e., c-myc translocation) – it is clear that there is the potential for chronic Pf-malaria to affect EBV latent infection, giving rise to eBL (Figure 2.4). As previously noted, 99% of primary EBV infections occur in children by the age of 3 years in developing countries.22, 39 In holoendemic areas, symptomatic Pf-malaria infections peak in children aged 2-3 years, although infections continue into the teen years.74 This would indicate children are already EBV seropositive when they experience repeated Pf-malaria infections in their early childhood. Recall that eBL peaks in children 4-8 years, soon after the peak age-related incidence for Pf-malaria infection.74
There are two prevailing, though not mutually exclusive, theories on the role of recurrent Pf-malaria on EBV infection and immunity. The first hypothesizes impaired EBV-specific T-cell immunity.19 EBV-specific T-cell immunity is responsible for immunosurveillance and control of EBV latent and lytic proteins; however, chronic Pf-malaria may impair EBV-specific T-cell immunity, resulting in inadequate immunosurveillance of EBV. 19, 35 The second theory hypothesizes that EBV-infected B-lymphocytes proliferate as an individual is repeatedly exposed to Pf-malaria.19 The increased number of EBV-infected B-lymphocytes thereby increases the risk for the emergence of an EBV-infected B-lymphocyte with the malignant mutation, leading to the development of eBL.19
Pf-malaria infection found a significant increase in the number of EBV-infected B-lymphocytes and high regression indices, both supporting the conclusion of a loss of CTL function.76-78 By nature of these studies, it is clear that acute Pf-malaria infections have a transient effect on T-cell response. Furthermore, findings from case-control studies comparing acutely infected Pf-malaria individuals with healthy adults came to the same conclusion.69, 79
The cumulative effect of Pf-malaria infections on T-cell control of persistent EBV infection has not been well researched. Two ecological studies comparing holoendemic areas to areas of unstable malaria transmission have been conducted yielding different conclusions. One study found a significant difference in T-cell function between the two areas, with individuals living in holoendemic areas showing a loss of T-cell response.80 However this study was conducted among adults who have mature immune systems as compared to children. A more recent study among children found no overall difference between the two areas; however, among children residing in the holoendemic area, a significant decrease in T-cell response was observed in children 5-9 years old compared to other age groups.35 Although using malaria transmission as a surrogate for cumulative Pf-malaria infections is not ideal, these findings provide the only understanding we currently have on the cumulative effect of Pf-malaria exposure on latent EBV infection.
Naturally Acquired Immunity to Pf-malaria Infection
to re-infection throughout life.16, 81 Yet partial immunity is developed over time whereby individuals progress from symptomatic illness with high parasite densities to asymptomatic illness and low density parasitemia.16
To understand the complex weave of interactions between the parasite and immunity in the human host, an understanding of the parasite life cycle and the critical role of humoral immunity is necessary. This will set the foundation for the description of how NAI evolves and how the longevity of antibodies affects NAI. Finally, we will review how NAI is influenced by heterogeneous patterns of transmission and age and the implications this has for protection from symptomatic, or clinical, disease.
Life Cycle of Pf-malaria
integrated into the RBC82, 85 where they undergo asexual replication (referred to as erythrocytic or blood stage).83 Most parasites in the blood stage continue in asexual replication, infecting more RBCs when merozoites are released.82, 83 A small proportion of parasites do not return to asexual replication but enter the sexual stage where they differentiate into male or female gametocytes.82, 83 Gametocytes are ingested by mosquitoes to continue their lifecycle in mosquitos.83, 86
Symptomatic infection in the human host is restricted to the asexual blood-stage when merozoites replicate in RBCs and are released into the bloodstream.86, 87 This release of merozoites leads to inflammatory responses that cause the
hallmark malaria symptoms of fever, rigor, and nausea.86, 87 Parasites of the liver stage and gametocytes do not cause symptomatic illness and this has been hypothesized to be due to their poor immunogenic capacity.6
Humoral Immunity to Pf-malaria Infection
Blood-stage antigens of particular interest are the apical membrane antigen (AMA)-1 and merozoite surface protein (MSP)-1 and both have been the focus of vaccine development. AMA-1 is a highly polymorphic antigen82 and is highly immunogenic.94, 95 Antibodies to AMA-1 antibodies have been shown to prevent reorientation of the merozoite on its apical end thereby preventing the critical attachment necessary for invasion.85 Recently, AMA-1 was also found to be expressed by sporozoites of the pre-erythrocytic stage. Once again, AMA-1 appears to play a vital role in cell invasion because antibodies to AMA-1 prevented invasion of hepatocytes.96 Like AMA-1, MSP-1 is a highly polymorphic antigen but it is not as immunogenic as AMA-1.95 97 MSP-1 coats the surface of merozoites but its precise function of remains unknown.84 It is processed into a number of fragments including MSP-142. and during invasion of the RBC, MSP-142. is further processed into MSP-119 and MSP-133.91 Antibodies to MSP-1 have been shown to prevent merozoite invasion of RBCs.82, 98 In addition, animal studies demonstrated that antibodies to MSP-1 protected primates from infection.97
of Pf-malaria exposure,6, 93 although one study reported LSA-1 IgG levels in infants.99 However, IgG responses in children are reportedly lower than adults.100 Even though IgG responses to pre-erythrocytic antigens have been observed to be consistently lower than levels of blood-stage antibodies,6, 93 comparisons between
Pf-malaria immune and naïve individuals suggest that antibodies confer a degree of immunity against parasites.6 Furthermore, significantly higher levels of LSA-1 antibodies were detected in high malaria transmission areas as compared to low areas indicating they may be involved in some level of protection.101
Evolution of NAI
Susceptibility to malaria is universal barring specific genetic traits that offer partial resistance to Pf-malaria infection.13, 87 Individuals with heterozygous sickle cell trait (HbAS) have partial resistance to Pf-malaria, leading to reduced parasite density and lower risks for severe forms of malaria whereas individuals homozygous for the trait (HbSS) appear to be at greater risk for severe disease.13, 87 Glucose-6-phosphate dehydrogenase deficiency is another genetic trait that protects individuals from severe manifestations of Pf-malaria infection.102
polymorphisms have led to different genotypes, or strains, within a single species, such as 3D7 and FVO.16 The predilection of parasites for liver and RBCs with limited or no major histocompatibility complex molecules means an efficient T-cell response cannot be mounted.6, 82, 92 Immune suppression strategies include malaria-specific B- and T-cell apoptosis (cell-death) and the prevention of dendritic cells from maturing thereby preventing antigen recognition and presentation to T-cells.6, 103, 104
In this web of interactions with parasites, humans have evolved a complex immune response that manages to transform symptomatic illness to asymptomatic control of parasite density.16 This response has been described in three phases (Figure 2.7). During the first phase, immunity to severe, life threatening infections is acquired after just a few infections despite an increasing prevalence of parasites.81, 93, 105 The next phase brings about clinical, or anti-disease, immunity whereby
individuals no longer suffer from symptomatic illness in spite of relatively high parasite densities.16, 81 Acquisition of partial immunity to parasite immunity (anti-parasite) is the final phase, where parasitemia density remains low throughout infection.16, 81
an individual being exposed to a novel variant in which there was no prior exposure.6, 106 As individuals experience repeated Pf-malaria infections, they accumulate a sufficient antibody repertoire such that they no longer suffer from symptomatic illness but continue to carry parasites.16, 93 Described in the 1900’s by Koch as “premunition,” low levels of parasites was believed to be necessary for maintaining immunity; interruption led to a loss in immune response.16, 81
Longevity of Antibodies
A hallmark of the immune response is the ability to recognize antigens that have already encountered. A lack of recognition therefore implies an absence of memory. The immune response to Pf-malaria infections suggests an absence of memory because people become repeatedly infected and ill. Therefore attempts have been made to delineate the contribution of LLPCs and MBCs to serum antibody levels but conclusions have been conflicting.92 One study concluded there was a defect in MBCs to specific Pf-malaria antigens,98 but another study reported slow and steady acquisition of MBCs to the same Pf-malaria antigens investigated in the first study.111 Once again, the hurdle in developing long-term memory may be the challenges created by the Pf-malaria parasite whereby appropriate, high affinity antibody responses cannot be developed due to an ever changing repertoire of antigens on the merozoites.109, 111 Although the activation of MBCs is typically antigen-dependent, there is evidence of antigen-independent activation (referred to as bystander activation) of Pf-malaria-specific MBCs antibodies.109-111, 114
Evidence arguing for the short lifespan of serum antibodies is numerous. First, high levels of antibody responses have been associated with parasitemia,97, 98, 109, 115, 116 but antibody responses declined after symptomatic infection ceased97 or
and children compared to adults.92, 109, 117 Yet these differences may be due to the maturity of immune systems in adults compared to infants and children.
Studies that have estimated the half-lives of antibodies have been limited and inconsistent. IgG1 responses were reported to have a half-life of 21 days.108 However, another study that examined IgG1 responses specific to Pf-malaria IgG responses (combination of blood-stage antigens including MSP-1 and AMA-1) reported IgG1 responses had a half-life of 10 days.107 Still another study determined the half-life of MSP-119 responses was 49 years.94 The contradictory findings may be attributed to different antigens tested but nevertheless, the half-life of antibodies remains an open area for research and discussion.
What is likely a more accurate description about the longevity of antibody responses is that there is a careful and coordinated balance between both short- and long-lived responses whereby clinical immunity develops rather than parasite immunity.109 The short life-span of antibodies is not indicative of a lack of immunological memory especially because rapid proliferation of antibody responses have been observed after exposure.6 In addition, regardless of the MTI, only a few
repeated Pf-malaria infections as children suffered from less disease.121 Hence antibodies do persist in the absence of antigens that stimulate an immune response.109
Malaria Transmission Intensity and Age Effect on the Evolution of Immunity The patterns of NAI in individuals vary by malaria transmission intensity and age with the exception of infection in infants. Maternal antibodies appear to provide protection among infants from fever, high density parasitemia, and severe illness until they are about 6 months old when protection begins to wane.16, 87, 99, 102, 122, 123
In areas of stable and high malaria transmission, symptomatic Pf-malaria infection, including severe forms, disproportionately affect children < 3 years old with monthly parasite prevalence among this age group reported to be as high as 90%.10, 11, 87, 119, 122-125 At 6 months of age, infants become susceptible to infection.16, 87, 102, 122, 123 Parasite densities were observed to peak in infants 6-11 months followed by
a rapid decline with age.122, 126 There is a subsequent decline in symptomatic illness and eventual decrease in parasite density with age, which is attributed to the accumulation of antibodies in response to repeated infection.10, 122 This same pattern of acquired immunity is also observed for adults who move from low to high malaria endemicity areas.10, 16
typically is reported in 1-5 year olds.10, 11, 14, 16, 123, 125, 126 High febrile illnesses among all ages have been reported during periodic outbreaks.6
Studies of antibody responses have generally found IgG responses to AMA-1,94, 95, 101 MSP-119,94, 95, 101, 127, 128 and LSA-1 94, 101, 129 to be greater in high transmission areas as compared to low areas. In high transmission areas, they have also shown that the prevalence of AMA-195, 101, 119, 130 including AMA-1 FVO131, MSP-11995, 120, 128, 132, 133, MSP-142130, and LSA-199-101, 119 antibodies increase with age but not always for MSP-119134, 135 or LSA-1130, 136. Limited studies have been conducted in areas of low malaria transmission and these have found that AMA-195, 101 and MSP-119 95, 101, 128 increased with age but not consistently for AMA-1 FVO131 or MSP-119.134, 137 LSA-1 responses were significantly higher in adults in one study118 but another study detected no age trend.101 An interesting observation was that symptomatic illness was not found to be correlated with parasite density in areas of high malaria transmission whereas in areas of low transmission, there was a clear correlation.16
of high transmission, risk of cerebral malaria remains low.138 The initial decrease in the J-shape was hypothesized to be due to the acquisition of immunity to severe malaria among young infants.105, 138
Evidence of Clinical Protection from Pf-malaria Infection
Efforts have been underway to develop of an effective vaccine for Pf-malaria infection. There is growing evidence that a multivalent vaccine that can elicit an immune response to a number of antigens will be necessary.82, 93, 103, 119 As previously mentioned, the vaccine will have to overcome the vast array of evasive strategies utilized by parasites. To compound this problem, a further challenge has been identifying antibodies that are immunological markers of protection.92 Few studies have examined the protective effect of antibodies to multiple antigens.136, 139 What complicates research further is that less than <1% of known antigens have been studied thus far.92 Prioritizing antigens for investigation has been hindered by the lack of knowledge on the precise function of a majority of the known antigens.82 Finally, most studies have been conducted in areas of stable malaria transmission but patterns of NAI vary across MTI. Therefore it is unclear if the mechanism driving NAI in these areas are relevant to individuals infrequently exposed to Pf-malaria.
142 Evidence of a protective effect of MSP-119 antibodies is inconsistent. Although
positive associations have been detected127, 128, 133, 137, 141 there have also been reports of no association.132, 134, 135, 140, 142 Limited studies on 3D7 and FVO strains have generally suggested antibodies to AMA-1 3D7,130, 131 AMA-1 FVO131, and MSP-1 3D7130 are protective of symptomatic Pf-malaria infection, but antibodies to MSP-1 FVO are not.130 Finally, the MSP-119 block 2 has been linked with protection from symptomatic illness.143-145
A recent meta-analysis of population-based longitudinal studies generally corroborated these findings between AMA-1 and MSP-1 and protection from symptomatic Pf-malaria infection.91 Antibodies to the 3D7 strain of AMA-1 reduced the risk of symptomatic illness whereas results for the FVO strain of AMA-1 were not as conclusive.91 Antibodies to MSP-119 led to an 18% decrease in the risk of symptomatic illness among individuals with detectable IgG responses as compared to non-responders.91 Further analysis revealed that there was a 15% decline in the risk of symptomatic illness for every doubling of antibody responses (log base 2).91 Studies of MSP-142 were not reported.
Summary
The burden of Pf-malaria infections is not independent of other infectious diseases circulating in a community. The repeated interaction of Pf-malaria parasites with persistent EBV infections can lead to eBL but the precise mechanism of interaction is shrouded in uncertainty. Two critical components to improve our understanding of the interaction between these two pathogens are 1) the use of an individual-level definition of Pf-malaria that accounts for recurrent Pf-malaria rather than acute, and 2) a study time period that allows for an examination of EBV persistence and immunity in response to recurrent Pf-malaria exposure. This dissertation aimed to incorporate these two missing components to gain further insight on the interplay of these two co-factors of eBL.
FIGU the W
URE 2.1. T World Healt
he geograp th Organiza
phic distribu ation.
FIGU tumo 1786
URE 2.2. T ors. Adapte 6 ©1983.
The lympho ed by perm
ma belt of mission from
Africa sho m John Wi
owing the a ley and So
approximate ons: Cance
e distributio er 51(10):1
777-FIGU area cente
FIGU
URE 2.3. Im s of the bo er and right
URE 2.4. Ch
mages of a ody. Photo
t are of the
hronology o
a girl and b on the left same boy
of proposed
boy with e is a girl w with an abd
d events in
BL tumor m ith a mand dominal tum
the carcino
manifestati dibular tumo
mor.
ogenesis of
ons in diffe or. Photo in
f eBL.
FIGU Cow ©200
URE 2.5. T man AF, C 06, with per
The lifecyc Crabb BS, I rmission fro
le of the m nvasion of om Elsevier
malaria pa red blood r.
rasite. Rep cells by m
printed from malaria para
m Cell, 12 asites,
FIGU (b) M Publ
URE 2.6. Th Merozoite in ishers Ltd:
he blood-st nvasion of Immunolog
tage lifecyc a red bloo gy and Cell
cle of Plasm od cell. Ada Biology 87
modium. (a) apted by p 7(5):377-39
) Depiction permission f
0 ©2009
of the lifec from Macm
FIGU for a The perm
URE 2.7. Po symptomat y-axis sh mission from opulation in tic parasite hows the m John Wile
ndices of im prevalence maximum ey and Sons
mmunity to e as well as prevalence s: Parasite
malaria in s mild and s
es recorde Immunolog
Kilifi, Keny severe mal ed in Kilif gy 28(1-2):5
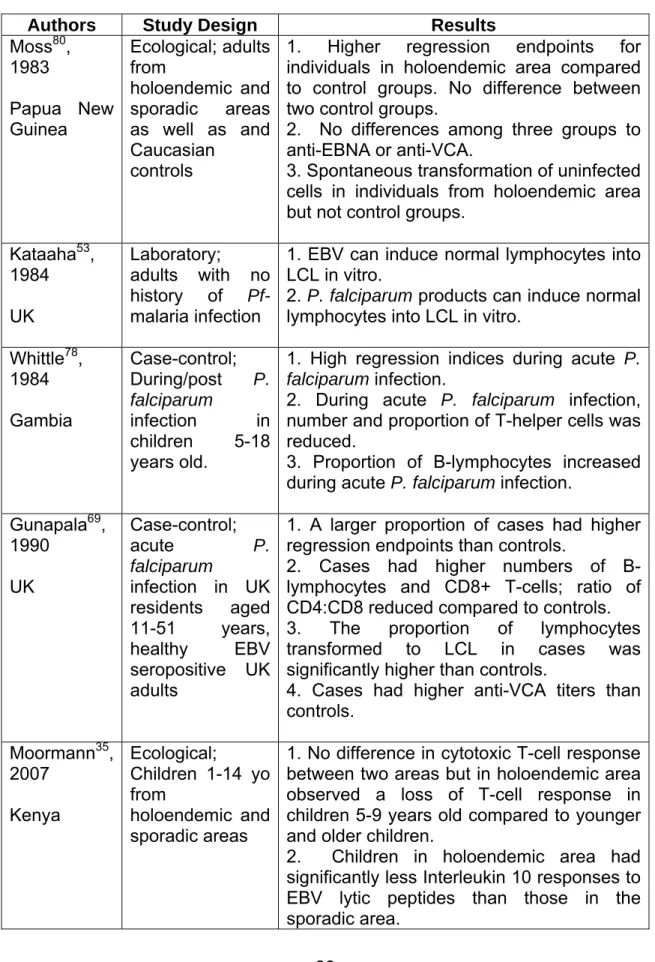
TABLE 2.1. Summary of Pf-malaria and EBV research related to T-cell response.
Authors Study Design Results
Moss80, 1983 Papua New Guinea Ecological; adults from holoendemic and sporadic areas as well as and Caucasian
controls
1. Higher regression endpoints for individuals in holoendemic area compared to control groups. No difference between two control groups.
2. No differences among three groups to anti-EBNA or anti-VCA.
3. Spontaneous transformation of uninfected cells in individuals from holoendemic area but not control groups.
Kataaha53, 1984 UK
Laboratory;
adults with no history of Pf-malaria infection
1. EBV can induce normal lymphocytes into LCL in vitro.
2. P. falciparum products can induce normal lymphocytes into LCL in vitro.
Whittle78, 1984 Gambia
Case-control; During/post P. falciparum
infection in children 5-18 years old.
1. High regression indices during acute P. falciparum infection.
2. During acute P. falciparum infection, number and proportion of T-helper cells was reduced.
3. Proportion of B-lymphocytes increased during acute P. falciparum infection.
Gunapala69, 1990
UK
Case-control; acute P. falciparum
infection in UK residents aged 11-51 years, healthy EBV seropositive UK adults
1. A larger proportion of cases had higher regression endpoints than controls.
2. Cases had higher numbers of B-lymphocytes and CD8+ T-cells; ratio of CD4:CD8 reduced compared to controls.
3. The proportion of lymphocytes transformed to LCL in cases was significantly higher than controls.
4. Cases had higher anti-VCA titers than controls.
Moormann35, 2007
Kenya
Ecological;
Children 1-14 yo from
holoendemic and sporadic areas
1. No difference in cytotoxic T-cell response between two areas but in holoendemic area observed a loss of T-cell response in children 5-9 years old compared to younger and older children.
Authors Study Design Results Njie79, 2009
Gambia
Case-control;
Children 3-14 years old with symptomatic P. falciparum, age-matched children
with no parasitemia,
Gambian adults not parasitemic, UK adults with no parasitemia, all seropositive for EBV
1. Gambian adults had significantly higher viral loads than UK adults.
2. Gambian children with acute Pf-malaria had viral loads 5-6 times higher than control children (p<0.001).
3. EBV loads higher in children 3-5 years old than older children although not statistically significant.
4. No significant difference in EBV loads in children with acute Pf-malaria 4-6 weeks after infection.
CHAPTER THREE: DESCRIPTION OF DATA SOURCES
Study Setting
The Kisumu/Nandi Cohort Study was established in western Kenya, an area located within the eBL “Lymphoma Belt” (Figure 2. 2). Two sites with disparate MTI levels were selected (Figure 3.1). The first site was located in Kisumu District in Nyanza Province, located in the lowlands on the banks of Lake Victoria. Malaria transmission in this area has been described as high and perennial, i.e. holoendemic. The other site was in Nandi District in the Rift Valley Province, located in the highlands 150 km northeast of Kisumu where malaria transmission has been characterized as low, unstable and prone to epidemics, i.e. hypoendemic. These areas were referred to by their district names, Kisumu (holoendemic) and Nandi (hypoendemic).
Study Population
was the main occupation in this area. In both locations, homes were built using locally available materials.
Study Sampling
Local meetings were held to introduce and explain the purpose of the study to community members. Study staff waited to enroll children for a few months after the introductory meetings to provide parents an opportunity to consider the study.
Each household and household member had been assigned a unique study identification number in 1999 for a demographic study. This information was used to randomly sample households for inclusion in the study. The number of participants enrolled from each village was set to ensure proportional geographic representation of each study site. Written informed consent was obtained from parents or guardians of study participants.
Investigators enrolled a total of 236 children. Based on the age-incidence of eBL in western Kenya, investigators made an effort to enroll approximately the same number of children within the following age groups: 2-4 years, 5-9 years, and 10-14 years (Table 3.1). It should be noted during the enrollment process, 13 children aged 5 months - 23 months and 2 teenagers aged 15 year olds were enrolled. Investigators also enrolled approximately the same ratio of children by sex.
Selection Criteria
- Permanent residency in the study site as defined by sleeping in the home at least 10 months of the year;
- “Healthy” appearance as assessed by the clinical officer (i.e., no signs of chronic illness or malnutrition);
- Parental consent for blood sample collection.
The following criteria were used to exclude children from the study: - Clinical officer observed signs of severe Pf-malaria infection; - HIV infection was known or suspected.
Data Collection
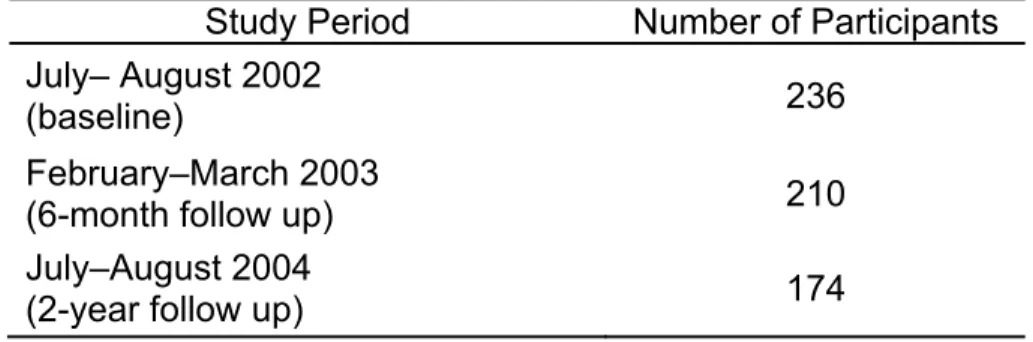
Three surveys were conducted between July, 2002 and August, 2004. The timing of the surveys and corresponding number of participants are summarized in Table 3.2.
During each survey, a standardized form was used to collect general demographic information (e.g., date of birth, sex), and malaria related information (e.g. bednet use). A copy of the form can be found in Appendix A. In addition, blood was collected for Pf-malaria testing (thick and thin blood smears), Pf-malaria serology testing (AMA-1 and MSP-142 to 3D7 and FVO strains, and LSA-1) and EBV testing (EBV-specific CD8+ T cell IFN-γ).
Human Subjects Research
FIGU Keny Inter
TABL
URE 3.1. M ya. Adapted national He
LE 3.1. Sum
T A
M
Map of Kisu d by permi ealth 12(8):
mmary of c
Total Enrolle Age
Male
umu and N ission from 936-943 ©2 hildren enro K ed <2 2-4 5-9 10-14 >14 Nandi distri m John Wile
2007.
olled in the Kisumu Dist n (%) 106 (45) 9 (8.5) 26 (24.5) 39 (36.8) 32 (30.2) 0 62 (58.5)
icts by leve ey and Son
Kisumu/Na trict Na
1
)
) 4
)
) 6
TABLE 3.2. Summary of survey periods and corresponding number of participants. Study Period Number of Participants
July– August 2002
(baseline) 236
February–March 2003
(6-month follow up) 210
July–August 2004
CHAPTER FOUR: METHODS
Specific Aim 1
To assess the effect of recurrent Pf-malaria exposure on Epstein Barr Virus latent and lytic antigen CD8+ T-cell IFN-γ responses over time.
Study Design Overview
Using the Kisumu/Nandi Cohort, we assessed the cumulative effect of repeated Pf-malaria infections on EBV latent and lytic antigen CD8+ T-cell IFN-γ responses over time. We used data from all three surveys from this cohort because the setting (i.e., holoendemic and hypoendemic) permitted exploration of district- and individual-level definition of recurrent Pf-malaria infections. Furthermore, EBV and Pf-malaria test results at three time points over a two-year period were available to address our objective.
Selection Criteria
Outcome: EBV latent and lytic antigen CD8+ T-cell IFN-γ response from each of the three survey periods was a dichotomous variable. Originally measured as a continuous variable by the IFN-γ enzyme-linked immunospot (ELISPOT) assay, the Χ2 Fisher’s Exact Test was used to classify responses (1=positive response, 0=no
response).
Exposure: Two definitions of Pf-malaria were used to explore the impact of Pf-malaria at the district and individual level.
- At the district level, recurrent Pf-malaria exposure was a time-invariant exposure defined according to the level of malaria transmission (1=Kisumu - holoendemic, 0=Nandi - sporadic).
- At the individual level, recurrent Pf-malaria infection was a time-varying exposure defined as the cumulative average of Pf-malaria infections (ranges from 0 to 1 at each survey period, where 1= parasitemia detected at present and previous survey periods and 0=no parasitemia detected at present or previous survey periods. ).
Additional covariates:
At the individual level, age, district of residence, HIV status, nutritional status, schistosomiasis infection, sex, and socioeconomic status (SES) have been identified as potential confounders of the exposure-outcome relationship.
- Nutritional status was not assessed; unmeasured potential confounder. - Schistosomiasis testing was not conducted; unmeasured potential
confounder.
- Information on SES was not collected; unmeasured potential confounder.
Age and sex will be included in our analysis as covariates.
- Age was modeled as a time-varying covariate using dummy indicators. The categories were selected for comparison with previous work (0-4 years, 5-9 years, >10 years). The >10 year age group was used as the referent group.
- District of residence (site) was a time-invariant dichotomous variable (1=Kisumu, 0=Nandi).
- Sex was a time-invariant dichotomous variable (1=Male, 0=Female).
- Survey time period was modeled as a time-invariant covariate using dummy indicators. The baseline survey period was used as the referent group.
Data Analysis
The GEE approach was used account for repeated outcome measures.147, 148 Random effects models could have been used, however the GEE was preferred for our analyses because we were interested in estimating the population-averaged change in the outcome for a unit change in the exposure whereas random effects models estimate the change in the outcome for each cluster in the population.149 A limitation of the GEE approach is that to estimate robust standard errors, large numbers of clusters with few repeated measures are needed. 149 Fortunately the Kisumu/Nandi cohort fulfilled this criteria as it was composed of 230 clusters (i.e., subjects) with three repeated measures.149
GEEs use a “quasi-likelihood” approach, an extension of the maximum likelihood estimation.147, 148 Estimates are interpreted similarly to linear or logistic regression models.150, 151
The GEE takes the same form as the Generalized Linear Model (GLM)
p
g(
μ
) =
β
0 +Σ
β
hX
hh=1
where
μ
is the mean response E(Y),g(
μ
)
is a function of the mean,β
0 is thebaseline mean when all predictor variables equal 0, p are independent variables, Xh
represents the vector of predictor variables, and
β
h is the mean change whenX
h=1.150
specification of the link function and variance function; however, GEEs require specification of the working correlation matrix.150, 151 The inclusion of the correlation parameters allows GEE to model within-subject correlation.150, 151
In our analyses we used the independent as the “best guess” for the working correlation matrix; the independent working correlation matrix assumes there is no correlation within a subject when calculating the point estimate.150, 151 We also used robust standard errors which provided unbiased estimates even if the working correlation matrix was inaccurate. We used the generalized Wald Test to build the final multivariable model as a quasi-likelihood analysis does not generate the Likelihood Ratio test commonly used for model comparisons.150
An important assumptions when using GEE is that data are missing completely at random; missingness of data is independent of observed and unobserved data.150 We had missing observations in the two subsequent follow-up surveys. Upon examination of the pattern of missing observations, we concluded missingness was related to age therefore our data were not missing completely at random. We weighted the final model using inverse probability weights. A summary of this approach is provided in Appendix B.
Bivariable Analysis: The crude relationship between the exposure-outcome was explored using the log-binomial regression with GEE. Covariate-outcome relationships were also explored. Findings from the analyses were summarized in tables and figures.
Assessment of Effect Measure Modification: Covariates were initially examined as potential effect measure modifiers (EMM) of the exposure-outcome relationship. One at a time, the covariate (main effect) and an exposure-covariate interaction term were added to the crude model (interaction model). The generalized Wald test was used to compare the crude and interaction models to test the significance of the interaction term. Any covariates significant at an alpha-level of 0.20 or less were classified as EMM and included in the final model. All models were stratified by district of residence.
Multivariable Analysis: We began our analysis with a fully adjusted weighted log-binomial model including the exposure, EMMs, and confounders. We used the independent working correlation matrix with robust variance estimators. All measured covariates were included in the model as EMM or confounder therefore we did not our fully adjusted model was or finalized model.
Power
Our study population was fixed; we simulated data to calculate power estimates using the GEE approach with three repeated measures examining the effect of Pf-malaria exposure (district) at a 0.05 two-sided significance level. The power estimates for recurrent Pf-malaria exposure (district) for both lytic and latent pools of EBV-specific CD8+ T-cell IFN-γ response are summarized in Figure 4.2. We had
80% power to detect a PR of 1.93 in EBV-specific CD8+ T-cell IFN-γ response (lytic) as a result of Pf-malaria exposure. We had over 80% power to detect a PR of 1.96 in specific CD8+ T-cell IFN-γ response (latent) as a result of Pf-malaria exposure.
Limitations
There were several potential limitations of Specific Aim 1.
- Interpreting findings from models using a district-level definition of recurrent
- The individual-level definition of recurrent Pf-malaria infection may not accurately reflect the true experience of participants. Between baseline and subsequent follow-up surveys, participants may have had Pf-malaria infections which were not captured by this study design, especially in the 18 month gap between the last two follow-up surveys.
- Testing to confirm HIV status was not conducted; children were deemed healthy by clinician judgment. Although HIV is a potential confounder in the association of Pf-malaria infection and EBV, it does not appear HIV infection was present in this cohort at the time of the study. At the time of the study, HIV treatment was not readily available in Kenya and as a result, HIV infected individuals often died within two years of HIV-related symptom onset. Subsequent follow up of these children, as recent as 2009, found no deaths among the children.
- Although Schistosomiasis infection was not conducted, an examination of the causal diagram between the exposure-outcome identified age and sex as measured antecedents of schistosomiasis infection (schistosomiasis was identified as a collider); adjusting for a collider may bias our estimate. Hence the lack of schistosomiasis testing for children is unlikely to bias our results. - Nutritional status was not measured; children enrolled in the study were
- SES was an unmeasured potential confounder. Families living in villages at both districts were likely to be classified as low SES as the main occupation was fishing (Kisumu) and farming (Nandi), with homes constructed of locally available materials. Given the SES composition of the villages, it appears SES was not a potential confounder at the time of the study.
Specific Aim 2
a. To describe malaria antibody responses among children in malaria holoendemic and hypoendemic areas, contrasting any differences between the areas.
b. To describe the relative change in malaria antibodies over time in malaria holoendemic and hypoendemic areas, highlighting any differences between the areas.
Study Design Overview
We used data collected in July-August 2002 (baseline) and February-March 2003 (six-month follow) from the Kisumu/Nandi Cohort to describe Pf-malaria antibody responses. This cohort was amenable for our objective because data were available from two districts characterized by different malaria transmission intensities. In addition, Pf-malaria-specific antibody test result were available.
Inclusion criteria: All cohort members.
Exclusion criteria: Children with uninterruptable antibody results.
Measurements and Analysis Plan – Specific Aim 2a
Outcome: Dichotomous IgG responses to AMA-1 3D7, AMA-1 FVO, MSP-142 3D7, MSP-142 FVO, and LSA-1 where 1=positive, 0=negative. Originally measured in mean fluorescence intensity (MFI), we standardized results into arbitrary units (AU) to account for plate-to-plate variability. Standardization was done by dividing the each participant’s MFI antibody response by the negative controls’ mean + three standard deviations. AU>1 were classified as a positive IgG response.
Exposure: Our analysis was descriptive therefore age, parasitemia status, and sex were treated as exposures.
- Age was a categorical variable: 0-4 years, 5-9 years, >10 years. Age was defined as the child’s age at the time of the survey.
- Parasitemia status was a dichotomous variable (1=parasitemic, 0=not parasitemic).
- Sex was a dichotomous variable (1=Male, 0=Female).
continuous outcome was not normally distributed. Data were stratified by district of residence.
Bivariable Analysis: All analyses were stratified by district of residence. The Chi-square test and Cochran Armitage trend test were used to assess any significant differences among the levels of each exposure as well as to compare responses between the two districts. Spearman’s rank correlation coefficients were used to examine any correlation between outcomes.
Measurements and Data Analysis Plan – Specific Aim 2b
Outcome: Continuous AU values of AMA-1 3D7, AMA-1 FVO, 142 3D7, MSP-142 FVO, and LSA-1 antibodies measured as relative change over six-months.
Relative change was calculated using the following formula:
= (IgG response at six-month follow-up – IgG response at baseline) IgG response at baseline.
Exposure: Our analysis was descriptive therefore age group, parasitemia status, and sex were treated as exposures.
- Age was a categorical variable: 0-4 years, 5-9 years, >10 years. Age was defined as the child’s age at the baseline survey.
o Parasitemia at baseline survey only
o Parasitemia at six-month follow-up survey only
o Aparasitemic at both surveys.
- Sex was a dichotomous variable (1=Male, 0=Female).
Descriptive Analysis: The distribution of the continuous outcome was examined and was not normally distributed. Therefore we used medians to describe the data. Data were stratified by district of residence and summarized using boxplots and tables.
Bivariable Analysis: All analyses were stratified by district of residence. Non-parametric tests were used to identify significant differences between levels of each exposure as well as to compare responses between the two districts. Exact tests were used for small samples sizes. An extension of the Wilcoxon rank-sum test was used to assess for trends of ordinal exposures. Spearman’s rank correlation coefficients were used to assess any correlation in the relative change of antibody responses between outcomes.
Missing observations: Surveys were conducted on 210 of the original 236 children at six-month follow up. This represented an 11% loss to follow-up. We did not identify any significant differences by age group or sex between children who did and did not participate in the six-month follow-up survey.
There were several potential limitations of Specific Aim 2.
- Cross-sectional studies measure exposure and outcome at one point in time. It was possible that children with elevated antibody responses cleared their parasitemia just before the survey. Therefore we may not have captured accurately the relationship between parasitemia status and antibody response. However, this would have predominantly been an issue in Kisumu where children experienced Pf-malaria infection more often than Nandi children. Given the large proportion of children who had parasitemia detected in Kisumu (>76%) at both surveys, this issue was likely to be minimal.
- The use of AU permitted standardization of antibody responses to account for plate-to-plate variability. However there is no intrinsic meaning of AU values. In addition, cutoffs for AU values differ across studies therefore and they cannot be directly compared across studies although directionality of responses are comparable.
- Caution must be taken when interpreting the relative change in antibody responses. A 200% increase in antibody response in a child originally classified as a negative responder does not imply the child has become a positive responder.
- We cannot say if observed differences in antibody responses reflect functional differences.
A.
B.
FIGU EBV distri
URE 4.1. C -specific la ict-level rela
Causal diag atent and ly ationship w
grams depi ytic CD8+ while Graph
icting the r T-cell IFN-h B depicts
relationship -γ response
the individu
p between e. Graph A ual-level re
Pf-malaria A illustrates lationship.
A. B. FIGU three expo (bott
URE 4.2. P e repeated osure (distr
om) shows
ower estim measures. ict) for a ly s the powe
mates for log Graph A ( ytic pool of er estimates
g-binomial (top) shows f EBV-spec s for Pf-ma
regression s the powe cific CD8+ alaria expo
using GEE er estimates IFN-γ resp osure (distr
E to accoun s for Pf-ma ponse. Gra