Quantifying cellular forces and biomechanical
properties by correlative micropillar traction
force and Brillouin microscopy
S
TEFANOC
OPPOLA,
1,4T
HOMASS
CHMIDT,
1G
IANCARLOR
UOCCO,
2AND
G
IUSEPPEA
NTONACCI2,3,51Physics of Life Processes - Kamerlingh Onnes-Huygens Laboratory, Leiden Institute of Physics, Leiden
University, Leiden, The Netherlands
2Center for Life Nano Science @Sapienza, Istituto Italiano di Tecnologia, Rome, Italy 3Photonics Research Group, Ghent University - imec, Ghent, Belgium
4stefano.coppola87@gmail.com 5giuse.antonacci@gmail.com
Abstract: Cells sense and respond to external physical forces and substrate rigidity by regulating their cell shape, internal cytoskeletal tension, and stiffness. Here we show that the combination of micropillar traction force and noncontact Brillouin microscopy provides access to cell-generated forces and intracellular mechanical properties at optical resolution. Actin-rich cytoplasmic domains of 3T3 fibroblasts showed significantly higher Brillouin shifts, indicating a potential increase in stiffness when adhering on fibronectin-coated glass compared to soft PDMS micropillars. Our findings demonstrate the complementarity of micropillar traction force and Brillouin microscopy to better understand the relation between cell force generation and the intracellular mechanical properties.
© 2019 Optical Society of America under the terms of theOSA Open Access Publishing Agreement
1. Introduction
Cells experience a myriad of mechanical and physical cues within their three-dimensional microenvironment, and in turn, they respond by exerting forces, regulating their shape, internal cytoskeletal tension, and elastic modulus [1–5]. Over the past decade, several studies demonstrated that such physical forces are sufficient to differentiate mesenchymal stem cells [6], initiate transcriptional programs [7], drive morphogenesis [8], and direct cell migration [9]. Disruption of the cellular forces, as well as variations in subcellular mechanical properties, can lead to altered pathophysiological conditions and to the onset of diseases [10–12]. As a result, assessing the cellular forces and mechanical properties is of crucial importance to provide a better understanding of disease mechanisms. Methods to simultaneously gather this information involved the use of picosecond ultrasonics in fixed cells with aµm-scale lateral resolution [13–15]. In this work, we demonstrate the combination of micropillar traction force and noncontact Brillouin microscopy to non-invasively evaluate both cellular forces and biomechanical properties with a sub-micron spatial resolution.
Microfabrication methods allow the production of cell substrates consisting of patterned arrays of elastic micropillars, usually made of polydimethylsiloxane (PDMS) [16–21] or polyacrylamide [22, 23]. The dependence of the effective substrate stiffness on micropillar geometry (i.e. radius and length) permits the generation of heterogeneous mechanical environments without altering material properties (e.g. cross-linker concentration for PDMS micropillars) [24]. In addition, magnetic actuators can be inserted in individual pillars to provide active mechanical stimuli [25, 26]. By a selective coating with extracellular matrix (ECM) proteins (e.g. fibronectin) through soft lithography techniques, cells adhere and exert forces only at the pillar tips whose deflections report cellular forces at subcellular level. This approach has a few advantages over traction microscopy methods that are based on the measurement of displaced beads embedded
#353310 https://doi.org/10.1364/BOE.10.002202
into continuum substrates [27]. These include (i) the capability to calculate displacements by exploiting the undeflected pillar positions in the patterned (e.g. hexagonal) grid, without the need for a reference image and (ii) the simpler and less computationally intensive force calculation due to the discrete adhesive surface (i.e. deflections of a given pillar only depend on the force applied to that pillar). However, compared to continuum substrates, such discrete adhesive surface affects the morphology of cell-ECM adhesions and the ability to reproduce the wide variations in stiffness found inin vivotissues due to the restricted stiffness range (approximately one order of magnitude).
Brillouin microscopy is an emerging approach showing increasing biological interest because it enables an all-optical, label-free and three-dimensional assessment of the subcellular biomechani-cal properties at a submicron resolution [28, 29]. In Brillouin imaging, a sample is scanned while a narrowband laser source probes point-by-point the spontaneous thermally-activated acoustic waves that locally propagate in the medium at the acoustic velocity [30]. A high-resolution (sub-GHz) spectrometer is thus used to analyze the spectrum of the scattered light [31, 32]. The latter contains an elastic (Rayleigh) peak of the same frequency as the illumination laser beam, and two sidebands referred to as the Stokes and Anti-Stokes Brillouin peaks thinly shifted by few GHz from the central peak [33]. The frequency and the linewidth of the Brillouin peaks are directly related to the high-frequency complex Longitudinal modulus (M), which is indicative of the viscoelastic properties of the material analyzed [34]. Recently, water content has been shown to dominate shifts in the Brillouin frequency of highly hydrated (>90%) gels [35], as expected by the compressibility nature of the longitudinal modulus [36]. Such a scenario is however rather unrealistic in biological samples where water content is significantly lower (<70%) and naturally contribute to the overall stiffness of the material investigated [37].
The noncontact, label-free and high-resolution capabilities of Brillouin microscopy have stimulated a wide range of applications, including the assessment of the cellular mechanical properties and their response to external stimuli [38–41], the mapping of the spinal cord stiffness in zebrafish larvae [42] and the investigation of the Alzheimer’s plaque viscoelasticity [43]. Moreover, Brillouin microscopy holds promise to become a potential diagnostic instrument for diseases such as atherosclerosis [44], keratoconus [45], cancer [46], meningitis [47] and amyotrophic lateral sclerosis [48, 49]. To this aim, significant research efforts have also focused on the instrumental advancement to achieve a high spectral contrast [38, 50, 51] and extinction ratio [52, 53], as well as to decrease the data acquisition time [54, 55], which are key ingredients to enablein-vivomeasurements of living biosystems.
2. Materials and methods
2.1. Cell biology
BD spectrometer VIPA
DM CCD
micropillar array
frequency
intensity
objective
BS cell
A
σ=0.025 GHz
6.15 6.25 6.35 Brillouin Shift (GHz) 0
180
Count
B
CCD
illumination beam
SETUP
1
fluorescence
SETUP
2
Brillouin
Fig. 1. Correlative micropillar traction force and Brillouin microscopy. (A) Schematic of the optical fluorescence (’SETUP 1’) and Brillouin (’SETUP 2’) independent setups. Cells adhere to a hexagonal patterned elastic micropillar array. The fluorescence setup (’SETUP 1’) was used to collect the fluorescence signal emitted by the micropillars and therefore to measure the cellular adhesion forces from the pillar displacements [21]. The same sample was then moved to the Brillouin imaging setup (’SETUP 2’) where the scattered signal was collected in a backscattering geometry and delivered to the background-deflection (BD) spectrometer. This is a single-stage VIPA spectrometer integrating a diffraction mask (DM) to deflect the elastic background signal from the dispersion axis [48]. (B) Sensitivity histogram of the Brillouin setup. N=1000 spectra were acquired on a PDMS sample. System sensitivity was evaluated to beσ=0.025 GHz.
2.2. Force measurement on micropillar arrays
A hexagonal array of poly-di-methyl-siloxane (PDMS, Sylgard 184, Dow Corning) micropillars of 2µm diameter, 4µm center-to-center distance and with a height of 6.9µm were produced using replica-molding from a silicon wafer (for details see [21]). The pillar arrays were flanked by integrated 50µm high spacers to allow the inversion onto glass bottom dishes, without compromising the already limited working distance of a high-NA objective on an inverted microscope. The tops of the micropillars were coated with a mixture of Alexa Fluor 647-labeled and unlabeled fibronectin (1:5, Life Technologies) using micro-contact printing. The position of the pillar tops was observed by fluorescence confocal microscopy at 647 nm excitation (Fig. 1A) and determined down to 30 nm accuracy using custom software (Matlab, Mathworks). Forces were obtained by multiplying the pillar deflections by the array’s characteristic spring constant (16.7 nN/m determined by finite element modeling) [21]. Such spring constant corresponds to an equivalent Young’s modulus in continuous substrates of∼11.6 kPa, calculated as proposed in [56]. Only pillars at the cell perimeter and with a deflection above a given threshold (∼50 nm) were considered for the calculation of the average force per pillar and total cellular forces. Such threshold was determined for each confocal image as the 75th percentile of the displacements of pillars outside the cell area (i.e. not bent by the cells).
2.3. Confocal microscopy
water immersion objective (Fig. 2A-B). The collinear light beams from 405 nm, 546 nm, and 647 nm laser diode light sources were injected into the microscope via a FV1200 MPE laser scanning confocal device. The 2048×2048 pixel fluorescence images (51 nm pixel size) were collected in line sequential mode to reduce the cross-talk among the fluorescence channels.
2.4. Brillouin microscopy
After fluorescence imaging, the same cells were transferred to the Brillouin confocal microscope (Fig. 1A) to investigate their biomechanical properties. The Brillouin microscope is composed of a standard scanning confocal imaging setup working in a backscattering geometry [29] where cells are illuminated by a single longitudinal mode laser beam (λ=532 nm, Coherent Verdi). The scattered light was collected by a microscope objective of NA=1.3 and a single mode fiber working as a confocal pinhole were used, providing a spatial resolution of∼0.3x0.3x1.1µm3and
a flexible beam delivery to a single-stage Virtually Image Phased Array (VIPA) spectrometer. The latter integrates a rhomboidal-shaped diffraction mask to deflect the background elastic light from the dispersion axis, in turn providing a spectral contrast of∼70 dB in a single-stage arrangement, as previously reported in [48]. Brillouin spectra were acquired at each scanning location across the cells and detected by a CCD camera (Photometrics Prime) with a data acquisition (dwell) time of 100 ms. The resulting spectral profiles were fitted by Lorentzian functions to evaluate the frequency shift, which is related to the real part of the Longitudinal compressive modulusM0
(i.e. a measure of stiffness).
Preliminary measurements were performed to characterize the system sensitivity. To this aim, N=1000 Brillouin spectra of bulk PDMS were acquired and fitted using a Lorentzian function. Fig. 1B shows a histogram of the measured Brillouin shift counts, which gave a mean value of
νB=6.237 GHz and a system sensitivity associated with the uncertainty ofσ=0.025 GHz. Representative Brillouin images of 3T3 cells are shown in Fig. 2C-D. Normalized probability density functions (PDFs) of Brillouin shifts were calculated by pooling together the acquired Brillouin images and considering the sensitivity of the system (i.e. σ=0.025 GHz) (Fig. 3). The highest peaks in Fig. 3A correspond to the contribution of PBS. To uncouple the buffer component from the cellular contribution, as shown in Fig. 3A, we performed a Gaussian fit (black dashed line) of the highest peak from glass (red solid line) and we defined the Gaussian mean plus its standard deviation as the Brillouin shift threshold (i.e.νTB=7.466 GHz).
3. Results and discussion
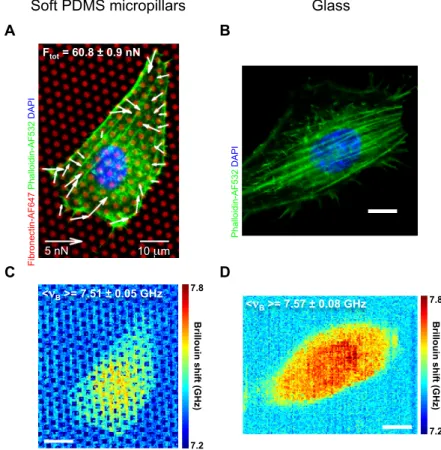
We measured in a correlative fashion the contractile forces and the intracellular mechanical properties of 3T3 fibroblast cells adherent on substrates of controlled stiffness (elastic micropillars and glass) and biochemical composition (i.e. fibronectin coating) (Fig. 1). Fig. 2 shows representative fluorescence confocal images of single cells adherent on an elastic micropillar substrate (Fig. 2A) and a standard glass coverslip (Fig. 2B). The associated Brillouin images are shown in Fig. 2C-D. The micropillar deflections allowed us to quantify the forces exerted by 3T3 cells on a soft substrate (Fig. 2A). The Brillouin images show a significant increase in the Brillouin frequency shiftsνBacross the nucleus with respect to the cytoplasm, as previously reported [38, 39]. Remarkably, the averageνBsignificantly increased from 7.51±0.05 GHz to 7.57±0.08 GHz (p<0.05) as a function of substrate stiffness (Fig. 2C-D).
Soft PDMS micropillars
Fibronectin-AF647
Phalloidin-AF532
DAPI
Ftot = 60.8 ± 0.9 nN
5 nN 10 µm
7.2 7.8 <νB >= 7.51 ± 0.05 GHz
Brillouin
shift (GHz)
7.2 7.8
Brillouin
shift (GHz)
<νB >= 7.57 ± 0.08 GHz
Phalloidin-AF532
DAPI
Glass
A B
C D
Fig. 2. Correlative high-resolution contractile forces and biomechanical properties of 3T3 fibroblasts. (A) Representative fluorescence confocal image of a 3T3 fibroblast cell (green and blue for actin and nucleus staining, respectively) adhering on fibronectin-coated (red) elastic micropillar arrays. The white arrows indicate the contractile forces quantified by multiplying the pillar displacements by the spring constant. The total cellular force was measured to be 60.8±0.9 nN. (B) Representative fluorescence confocal image of a 3T3 fibroblast cell (green and blue for actin and nucleus staining, respectively) adhering on fibronectin-coated glass. (C-D) High-resolution confocal Brillouin images of the representative cells in (A-B). The reported average cell Brillouin shiftsνBof 7.51±0.05 GHz and 7.57±0.08 GHz are significantly different (p-value<0.05 from a two-sample t-test, N=3146 and 4715 Brillouin shift values respectively). The cell Brillouin shifts were determined by using the triangle method [57]. Scale bar: 10µm.
we show the multimodal distributions ofνB after thresholding (i.e. across cells) (solid blue and red lines) and the results of a non-linear least-squares fit with three independent Gaussian components (light blue and red lines) (see Fig. 6 in the Appendix for the choice of such model). We focused our further analysis and discussion exclusively on the Gaussian mean values rather than on the amplitude and variance because we believe that the latter present higher dependency on the biological variability and sample size. The obtained parameters in Table 1 interestingly suggest the existence of three major subcellular components with characteristicνB values. The highest mean Brillouin shift values (i.e. µ3=7.688±0.003 GHz andµ3=7.71±0.05
GHz, for micropillars and glass, respectively) describe the contribution of the nuclei, whereas the lowest values (i.e. µ1=7.489±0.001 GHz and µ1=7.489±0.001 GHz, for micropillars and
buffer-like content (i.e.νBcloser to the buffer values, Fig. 3A). Remarkably, these high and low Brillouin components were not significantly different as a function of substrate stiffness (Table 1). However, a different behaviour was found for the intermediate component of the Brillouin shift distribution, which significantly increased fromµ2=7.544±0.005 GHz toµ2=7.608±0.002 GHz
(p-value<0.001) in response to the substrate stiffening (Table 1).
7 7.5 8
Brillouin shift B (GHz)
0 1 2 3 4 5 6 7 8
Soft PDMS micropillars Glass
Gaussian fit
B T
7.4 7.6 7.8 8
Brillouin shift B (GHz)
0 1 2 3 4 5 6
Soft PDMS micropillars Glass
B
Cells Buffer
A
PDMS micropillars
Fig. 3. Intracellular Brillouin frequency shifts increase as a function of substrate stiffness. (A) Normalized probability density function (PDF) of Brillouin shifts νB for cells on soft PDMS micropillars (solid blue line) and glass (solid red line). The Brillouin shifts components for PDMS, PBS buffer and cells are indicated by the arrows. A Gaussian fit of the ’Buffer’ peak (black dashed line) is performed to set a threshold valueνTB=7.466 GHz (see Methods in 2.4). (B) PDF plot of cellular Brillouin shiftνB> νTB. A three-Gaussian fit (solid lines) is performed for Brillouin shift profiles of cells on both soft PDMS micropillars (solid blue line) and glass (solid red line). Results are reported in Table 1. The choice of such model is clarified in Fig. 6 in the Appendix.
Table 1. Parameters from a non-linear least squares fit with three independent Gaussian functions of the Brillouin shifts PDF reported in Fig. 3B.A∗,µ∗andσ∗are the amplitude, mean and standard deviation (±95% CI) of the Gaussian functions. The p-values were obtained from a t-test for which the significance level was set to p-value<0.05 (N=5 cells and 6 cells for soft PDMS micropillars and glass, respectively).
Gaussian Fit Soft PDMS micropillars Glass P-value
A1(%) 39±5 29±1 <0.001
µ1(GHz) 7.489±0.001 7.489±0.001 >0.05
σ1(GHz) 0.029±0.001 0.031±0.001 <0.01
A2(%) 40±2 58±8 <0.001
µ2(GHz) 7.544±0.005 7.608±0.002 <0.001
σ2(GHz) 0.048±0.002 0.062±0.003 <0.001
A3(%) 21±1 13±5 <0.01
µ3(GHz) 7.688±0.003 7.71±0.05 >0.05
Tee et al. [4] have previously demonstrated that the cell cortical stiffness increases as a function of substrate stiffness. The cell cortical stiffness was measured by Atomic Force Microscopy (AFM) in regions far from lamellipodia and nucleus, obtaining an ensemble average over both cortical actin and stress fibers (if close enough to the dorsal cell surface). In light of these findings, we hypothesized that the intermediate Brillouin shift values that we introduced above refer to the contribution of actin stress fibers and therefore provide a measure of their mechanical properties.
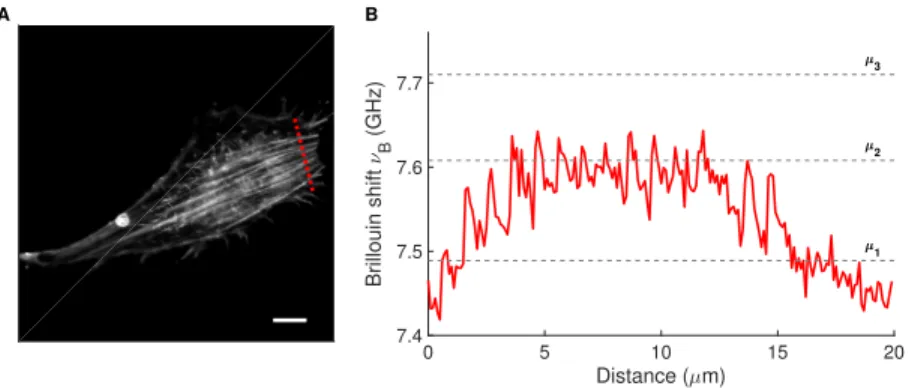
To validate our hypothesis, we performed a high-resolution Brillouin line scan far from the nucleus crossing actin stress fibers, which were detected in a correlative fashion by fluorescence confocal imaging (dashed red line in Fig. 4). The actin stress fibers could not be spatially resolved by the Brillouin microscope due to a size that typically falls below 100 nm in diameter. Nevertheless, the Brillouin shift line profile had an effective (mean) value close to the intermediate
νBvalue of Table 1 (µ2=7.608±0.002 GHz, dashed grey line). In addition, it is interesting to
note a decrease in the Brillouin shifts towardsµ1(dashed grey line) at the two ends of the line
profile, i.e. in the proximity of the lamellipodia. These results support our hypothesis that we could (i) identify the Brillouin shift component potentially associated with the actin stress fibers and (ii) indirectly quantify changes in the intracellular biomechanical properties as a function of substrate stiffness.
0 5 10 15 20
Distance ( m) 7.4
7.5 7.6 7.7
Brillouin shift
B
(GHz)
B A
1 2 3
Fig. 4. Label- and contact-free Brillouin imaging of actin stress fibers. (A) Confocal image of 3T3 fibroblast adhering on fibronectin-coated glass. Actin filaments are labeled with AF532-conjugated phalloidin (grayscale). The dashed red line indicates where the Brillouin line scan was performed. Scale bar: 10µm. (B) Brillouin shiftsνBfrom the line scan across the cell (dashed red line in A) measured with an increased data acquisition time of 500 ms per spectrum. The dashed grey lines report the Brillouin shift valuesµ1,µ2, andµ3from
Table 1.
We further investigated the relation between the actin Brillouin shifts and the mechanical forces generated by 3T3 fibroblasts on soft PDMS micropillars (Fig. 5). The average Brillouin shifts of the intermediate component (i.e. |νB−µ2|<σ2from Table 1) increased with the average force per
pillar by 0.003±0.004 GHz/nN. This relation provides an estimate of the saturating force per pillar of∼23 nN by using the actin Brillouin shift obtained from cells on glass (µ2=7.608±0.002 from
0 1 2 3 4
Force per pillar (nN)
7.5 7.52 7.54 7.56 7.58 7.6 Brillouin shift B (GHz)
Fig. 5. Actin Brillouin shifts and force per pillar of cells on soft PDMS micropillars. Data are reported as mean±SD. A linear fit (solid red line) using the York method [58] gives a slope of 0.003±0.004 GHz/nN and an intercept of 7.54±0.01 GHz (R2=0.14).
4. Conclusion
In this work, we showed a correlative combination of micropillar traction force microscopy and Brillouin imaging methods to quantify cellular forces and intracellular biomechanics as a function of substrate stiffness. The label- and contact-free nature of the Brillouin imaging approach allowed us to go beyond the limitations present in AFM assessments and to quantify the mechanical properties of actin stress fibers with unprecedented spatial resolution. A fully integrated and high-resolution fluorescence and Brillouin microscope with live cell imaging capabilities will grant us simultaneous access to fundamental biomechanical information to better understand cell mechanotransduction.
Appendix 0 2 4 6 PDF
Soft PDMS micropillars 1-Gaussian fit 0 2 4 6 PDF
Soft PDMS micropillars 2-Gaussian fit
7.4 7.6 7.8 8
Brillouin shift B (GHz)
0 2 4 6
Soft PDMS micropillars 3-Gaussian fit 0 2 4 6 PDF Glass 1-Gaussian fit 0 2 4 6 PDF Glass 2-Gaussian fit
7.4 7.6 7.8 8
Brillouin shift B (GHz)
0 2 4 6 PDF Glass 3-Gaussian fit B A
AIC = 694
AIC = 359
AIC = -228 AIC = -219
AIC = 1183
AIC = 585
Fig. 6. Comparison of non-linear least squares fits with one, two or three component Gaussian functions for soft PDMS micropillars (A) and Glass (B) conditions. The optimal model (i.e. three-component Gaussian fit) was chosen after the Akaike information criterion (AIC) values that are reported in the plots. The AIC values were determined asAIC=2k+nln(RSS), wherekis the number of parameters (e.g.k=3 for one-component Gaussian),nthe sample size, andRSSthe residual sum of squares (i.e.Í
Funding
AXA Research Fund Post-doctoral grant (16-AXA-PDOC-004).
Acknowledgments
We thank Simone De Panfilis for his support in the fluorescence confocal microscopy.
Disclosures
The authors declare that there are no conflicts of interest related to this article.
References
1. D. E. Discher, P. Janmey, and Y.-l. Wang, “Tissue cells feel and respond to the stiffness of their substrate,” Science 310, 1139–1143 (2005).
2. T. Yeung, P. C. Georges, L. A. Flanagan, B. Marg, M. Ortiz, M. Funaki, N. Zahir, W. Ming, V. Weaver, and P. A. Janmey, “Effects of substrate stiffness on cell morphology, cytoskeletal structure, and adhesion,” Cell motility
cytoskeleton60, 24–34 (2005).
3. I. Levental, P. C. Georges, and P. A. Janmey, “Soft biological materials and their impact on cell function,” Soft Matter 3, 299–306 (2007).
4. S.-Y. Tee, J. Fu, C. S. Chen, and P. A. Janmey, “Cell shape and substrate rigidity both regulate cell stiffness,” Biophys.
journal100, L25–L27 (2011).
5. W. Pomp, K. Schakenraad, H. E. Balcıoğlu, H. van Hoorn, E. H. Danen, R. M. Merks, T. Schmidt, and L. Giomi,
“Cytoskeletal anisotropy controls geometry and forces of adherent cells,” Phys. review letters121, 178101 (2018).
6. A. J. Engler, S. Sen, H. L. Sweeney, and D. E. Discher, “Matrix elasticity directs stem cell lineage specification,” Cell 126, 677–689 (2006).
7. E. Farge, “Mechanical induction of twist in the drosophila foregut/stomodeal primordium,” Curr. biology13,
1365–1377 (2003).
8. F. Bosveld, I. Bonnet, B. Guirao, S. Tlili, Z. Wang, A. Petitalot, R. Marchand, P.-L. Bardet, P. Marcq, F. Graner
et al., “Mechanical control of morphogenesis by fat/dachsous/four-jointed planar cell polarity pathway,” Science336, 724–727 (2012).
9. R. Sunyer, V. Conte, J. Escribano, A. Elosegui-Artola, A. Labernadie, L. Valon, D. Navajas, J. M. García-Aznar, J. J.
Muñoz, P. Roca-Cusachset al., “Collective cell durotaxis emerges from long-range intercellular force transmission,”
Science353, 1157–1161 (2016).
10. Y. A. Miroshnikova, J. K. Mouw, J. M. Barnes, M. W. Pickup, J. N. Lakins, Y. Kim, K. Lobo, A. I. Persson, G. F.
Reis, T. R. McKnightet al., “Tissue mechanics promote idh1-dependent hif1α–tenascin c feedback to regulate
glioblastoma aggression,” Nat. cell biology18, 1336 (2016).
11. J. J. Northey, L. Przybyla, and V. M. Weaver, “Tissue force programs cell fate and tumor aggression,” Cancer
discovery7, 1224–1237 (2017).
12. H. Laklai, Y. A. Miroshnikova, M. W. Pickup, E. A. Collisson, G. E. Kim, A. S. Barrett, R. C. Hill, J. N. Lakins,
D. D. Schlaepfer, J. K. Mouwet al., “Genotype tunes pancreatic ductal adenocarcinoma tissue tension to induce
matricellular fibrosis and tumor progression,” Nat. medicine22, 497 (2016).
13. M. Abi Ghanem, T. Dehoux, L. Liu, G. Le Saux, L. Plawinski, M.-C. Durrieu, and B. Audoin, “Opto-acoustic
microscopy reveals adhesion mechanics of single cells,” Rev. Sci. Instruments89, 014901 (2018).
14. M. Abi Ghanem, T. Dehoux, O. F. Zouani, A. Gadalla, M.-C. Durrieu, and B. Audoin, “Remote opto-acoustic probing
of single-cell adhesion on metallic surfaces,” J. biophotonics7, 453–459 (2014).
15. T. Dehoux, M. A. Ghanem, O. Zouani, J.-M. Rampnoux, Y. Guillet, S. Dilhaire, M.-C. Durrieu, and B. Audoin,
“All-optical broadband ultrasonography of single cells,” Sci. reports5, 8650 (2015).
16. J. L. Tan, J. Tien, D. M. Pirone, D. S. Gray, K. Bhadriraju, and C. S. Chen, “Cells lying on a bed of microneedles: an
approach to isolate mechanical force,” Proc. Natl. Acad. Sci.100, 1484–1489 (2003).
17. O. Du Roure, A. Saez, A. Buguin, R. H. Austin, P. Chavrier, P. Siberzan, and B. Ladoux, “Force mapping in epithelial
cell migration,” Proc. Natl. Acad. Sci.102, 2390–2395 (2005).
18. M. Gupta, B. R. Sarangi, J. Deschamps, Y. Nematbakhsh, A. Callan-Jones, F. Margadant, R.-M. Mège, C. T. Lim, R. Voituriez, and B. Ladoux, “Adaptive rheology and ordering of cell cytoskeleton govern matrix rigidity sensing,”
Nat. communications6, 7525 (2015).
19. S. Ghassemi, G. Meacci, S. Liu, A. A. Gondarenko, A. Mathur, P. Roca-Cusachs, M. P. Sheetz, and J. Hone, “Cells
test substrate rigidity by local contractions on submicrometer pillars,” Proc. Natl. Acad. Sci.109, 5328–5333 (2012).
20. H. Wolfenson, G. Meacci, S. Liu, M. R. Stachowiak, T. Iskratsch, S. Ghassemi, P. Roca-Cusachs, B. OâĂŹShaughnessy, J. Hone, and M. P. Sheetz, “Tropomyosin controls sarcomere-like contractions for rigidity sensing and suppressing
growth on soft matrices,” Nat. cell biology18, 33 (2016).
21. H. van Hoorn, R. Harkes, E. M. Spiesz, C. Storm, D. van Noort, B. Ladoux, and T. Schmidt, “The nanoscale
22. S. W. Moore, N. Biais, and M. P. Sheetz, “Traction on immobilized netrin-1 is sufficient to reorient axons,” Science 325, 166–166 (2009).
23. N. Biais, D. Higashi, M. So, and B. Ladoux, “Techniques to measure pilus retraction forces,” inNeisseria meningitidis,
(Springer, 2012), pp. 197–216.
24. A. Saez, M. Ghibaudo, A. Buguin, P. Silberzan, and B. Ladoux, “Rigidity-driven growth and migration of epithelial
cells on microstructured anisotropic substrates,” Proc. Natl. Acad. Sci.104, 8281–8286 (2007).
25. J. Le Digabel, N. Biais, J. Fresnais, J.-F. Berret, P. Hersen, and B. Ladoux, “Magnetic micropillars as a tool to govern
substrate deformations,” Lab on a Chip11, 2630–2636 (2011).
26. N. J. Sniadecki, A. Anguelouch, M. T. Yang, C. M. Lamb, Z. Liu, S. B. Kirschner, Y. Liu, D. H. Reich, and C. S.
Chen, “Magnetic microposts as an approach to apply forces to living cells,” Proc. Natl. Acad. Sci.104, 14553–14558
(2007).
27. U. S. Schwarz and J. R. Soiné, “Traction force microscopy on soft elastic substrates: A guide to recent computational
advances,” Biochimica et Biophys. Acta (BBA)-Molecular Cell Res.1853, 3095–3104 (2015).
28. G. Scarcelli and S. H. Yun, “Confocal brillouin microscopy for three-dimensional mechanical imaging,” Nat.
photonics2, 39 (2008).
29. G. Antonacci, M. R. Foreman, C. Paterson, and P. Török, “Spectral broadening in brillouin imaging,” Appl. Phys.
Lett.103, 221105 (2013).
30. K. Koski and J. Yarger, “Brillouin imaging,” Appl. Phys. Lett.87, 061903 (2005).
31. M. Shirasaki, “Large angular dispersion by a virtually imaged phased array and its application to a wavelength
demultiplexer,” Opt. letters21, 366–368 (1996).
32. G. Scarcelli and S. H. Yun, “Multistage vipa etalons for high-extinction parallel brillouin spectroscopy,” Opt. express 19, 10913–10922 (2011).
33. G. Antonacci,Brillouin Scattering Microscopy for Mechanical Imaging(Imperial College London, 2015).
34. K. J. Koski, P. Akhenblit, K. McKiernan, and J. L. Yarger, “Non-invasive determination of the complete elastic
moduli of spider silks,” Nat. Mater.12, 262 (2013).
35. P.-J. Wu, I. V. Kabakova, J. W. Ruberti, J. M. Sherwood, I. E. Dunlop, C. Paterson, P. Török, and D. R. Overby, “Water content, not stiffness, dominates brillouin spectroscopy measurements in hydrated materials,” Nat. methods 15, 561 (2018).
36. G. Scarcelli and S. H. Yun, “Reply to âĂŸwater content, not stiffness, dominates brillouin spectroscopy measurements
in hydrated materialsâĂŹ,” Nat. methods15, 562 (2018).
37. R. Prevedel, A. Diz-Muñoz, G. Ruocco, and G. Antonacci, “Brillouin microscopy-a revolutionary tool for mechanobi-ology?” arXiv preprint arXiv:1901.02006 (2019).
38. G. Scarcelli, W. J. Polacheck, H. T. Nia, K. Patel, A. J. Grodzinsky, R. D. Kamm, and S. H. Yun, “Noncontact
three-dimensional mapping of intracellular hydromechanical properties by brillouin microscopy,” Nat. methods12,
1132 (2015).
39. G. Antonacci and S. Braakman, “Biomechanics of subcellular structures by non-invasive brillouin microscopy,” Sci.
reports6, 37217 (2016).
40. K. Elsayad, S. Werner, M. Gallemí, J. Kong, E. R. S. Guajardo, L. Zhang, Y. Jaillais, T. Greb, and Y. Belkhadir, “Mapping the subcellular mechanical properties of live cells in tissues with fluorescence emission–brillouin imaging,”
Sci. Signal.9, rs5–rs5 (2016).
41. F. Scarponi, S. Mattana, S. Corezzi, S. Caponi, L. Comez, P. Sassi, A. Morresi, M. Paolantoni, L. Urbanelli,
C. Emilianiet al., “High-performance versatile setup for simultaneous brillouin-raman microspectroscopy,” Phys.
Rev. X7, 031015 (2017).
42. R. Schlüßler, S. Möllmert, S. Abuhattum, G. Cojoc, P. Müller, K. Kim, C. Möckel, C. Zimmermann, J. Czarske, and J. Guck, “Mechanical mapping of spinal cord growth and repair in living zebrafish larvae by brillouin imaging,”
Biophys. journal115, 911–923 (2018).
43. S. Mattana, S. Caponi, F. Tamagnini, D. Fioretto, and F. Palombo, “Viscoelasticity of amyloid plaques in transgenic mouse brain studied by brillouin microspectroscopy and correlative raman analysis,” J. innovative optical health
sciences10, 1742001 (2017).
44. G. Antonacci, R. M. Pedrigi, A. Kondiboyina, V. V. Mehta, R. De Silva, C. Paterson, R. Krams, and P. Török, “Quantification of plaque stiffness by brillouin microscopy in experimental thin cap fibroatheroma,” J. Royal Soc.
Interface12, 20150843 (2015).
45. M. J. Girard, W. J. Dupps, M. Baskaran, G. Scarcelli, S. H. Yun, H. A. Quigley, I. A. Sigal, and N. G. Strouthidis,
“Translating ocular biomechanics into clinical practice: current state and future prospects,” Curr. eye research40,
1–18 (2015).
46. F. Palombo, M. Madami, N. Stone, and D. Fioretto, “Mechanical mapping with chemical specificity by confocal
brillouin and raman microscopy,” Analyst139, 729–733 (2014).
47. Z. Steelman, Z. Meng, A. J. Traverso, and V. V. Yakovlev, “Brillouin spectroscopy as a new method of screening for
increased csf total protein during bacterial meningitis,” J. Biophotonics8, 408–414 (2015).
48. G. Antonacci, V. de Turris, A. Rosa, and G. Ruocco, “Background-deflection brillouin microscopy reveals altered
biomechanics of intracellular stress granules by als protein fus,” Commun. biology1, 139 (2018).
49. R. De Santis, V. Alfano, V. de Turris, A. Colantoni, L. Santini, M. G. Garone, G. Antonacci, G. Peruzzi, E.
SSRN 3261820 (2018).
50. G. Antonacci, S. De Panfilis, G. Di Domenico, E. DelRe, and G. Ruocco, “Breaking the contrast limit in single-pass
fabry-pérot spectrometers,” Phys. Rev. Appl.6, 054020 (2016).
51. E. Edrei, M. C. Gather, and G. Scarcelli, “Integration of spectral coronagraphy within vipa-based spectrometers for
high extinction brillouin imaging,” Opt. express25, 6895–6903 (2017).
52. G. Antonacci, G. Lepert, C. Paterson, and P. Török, “Elastic suppression in brillouin imaging by destructive
interference,” Appl. Phys. Lett.107, 061102 (2015).
53. G. Antonacci, “Dark-field brillouin microscopy,” Opt. letters42, 1432–1435 (2017).
54. J. Zhang, A. Fiore, S.-H. Yun, H. Kim, and G. Scarcelli, “Line-scanning brillouin microscopy for rapid non-invasive
mechanical imaging,” Sci. reports6, 35398 (2016).
55. I. Remer and A. Bilenca, “High-speed stimulated brillouin scattering spectroscopy at 780 nm,” APL Photonics1,
061301 (2016).
56. M. Ghibaudo, A. Saez, L. Trichet, A. Xayaphoummine, J. Browaeys, P. Silberzan, A. Buguin, and B. Ladoux,
“Traction forces and rigidity sensing regulate cell functions,” Soft Matter4, 1836–1843 (2008).
57. G. Zack, W. Rogers, and S. Latt, “Automatic measurement of sister chromatid exchange frequency.” J. Histochem. &
Cytochem.25, 741–753 (1977).
58. D. York, N. M. Evensen, M. L. Martınez, and J. De Basabe Delgado, “Unified equations for the slope, intercept, and