Yu Yuan. An Exploration of User Engagement With a Search Assistance Tool in Different Positions on a SERP. A Master’s Paper for the M.S. in I.S degree. April, 2019. 60pages.Advisor: Robert Capra
This study aimed to explore the difference in user engagement with a search assistance tool in different positions on a SERP. A usability study with eye-tracker was conducted in a lab environment. Overall, there were 12 subjects participated in this study, each of them was asked to perform two tasks on a search system with a search assistance tool placed in two positions. Qualitative data collected from retrospective interview and quantitative data gathered from questionnaires, eye-tracking system and custom log system were analyzed to investigate the position effect. The results in this study showed that the search assistance tool placed in the middle is easier to get noticed while people are more likely to pay attention to it and use it when the search assistance tool is placed on the right side of the page. Also, the source authority and the information foraging theories like Camouflage Links, Banner Blindness have impacts on the use of the search assistance tool.
Headings:
Search Assistance Tool
Information Search Behavior
Eye-tracking
AN EXPLORATION OF USER ENGAGEMENT WITH A SEARCH ASSISTANCE TOOL IN DIFFERENT POSITIONS ON A SERP.
by Yu Yuan
A Master’s paper submitted to the faculty of the School of Information and Library Science of the University of North Carolina at Chapel Hill
in partial fulfillment of the requirements for the degree of Master of Science in
InformationScience.
Chapel Hill, North Carolina April 2019
Approved by
Table of Contents
1. INTRODUCTION ... 2
2. LITERATURE REVIEW ... 4
2.1.USER ENGAGEMENT ... 4
2.2.MEASURING USER ENGAGEMENT ... 4
2.3.SEARCH ENGINE RESULT PAGE ... 5
2.4.SEARCH ASSISTANCE ON SERP ... 6
2.5.UNDERSTAND SEARCH BEHAVIORS USING EYE-TRACKING ... 7
3. METHODOLOGY ... 9
3.1.SEARCH SYSTEM ... 9
3.2USABILITY STUDY... 10
4. DATA ANALYSIS & RESULT ... 17
4.1SUBJECT DEMOGRAPHIC ... 17
4.2USER ENGAGEMENT (QUANTITATIVE RESULTS) ... 18
4.3USER ENGAGEMENT (QUALITATIVE RESULT) ... 26
5. DISCUSSION ... 35
6. CONCLUSION ... 37
7. ACKNOWLEDGEMENT ... 39
8. BIBLIOGRAPHY ... 40
APPENDIX 1 RECRUITING EMAILS... 45
APPENDIX 2 CONSENT FORM ... 47
APPENDIX 3 ENTRY QUESTIONNAIRE ... 50
APPENDIX 4 PRE-TASK QUESTIONNAIRE ... 51
APPENDIX 5 POST-TASK QUESTIONNAIRE ... 52
APPENDIX 6 RETROSPECTIVE INTERVIEW QUESTIONS ... 53
APPENDIX 7 SEARCH SYSTEM INTERFACE SCREENSHOT ... 54
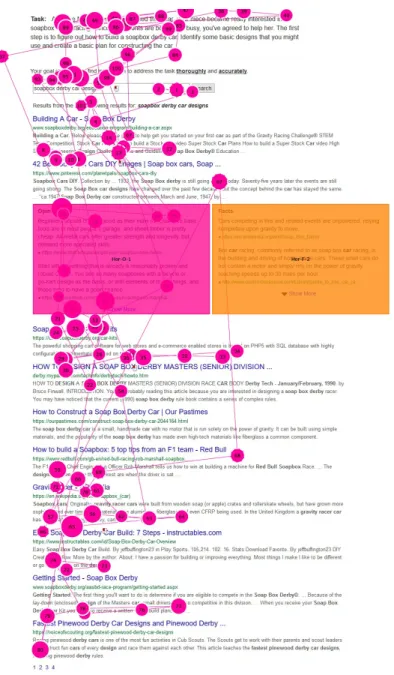
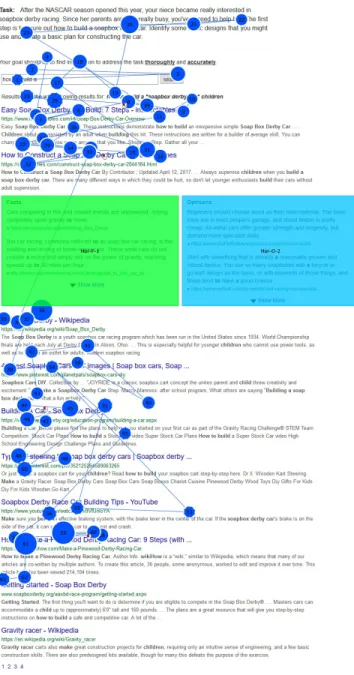
APPENDIX 8 EYE-GAZE PATTERN EXAMPLES—CAMOUFLAGE LINK ... 55
1.
Introduction
Going back to 1996, Sergey Brin and Larry Page, two Stanford students, launched
Backrub as a project, which laying the foundations for Search Engine Result Page
(SERP). Till now, SERP have become more diverse and dynamic over the years, not only
the original results would be provided to users, various kinds of assistances, like pictures,
videos, knowledge panels, placed in different positions has also been introduced to aid
the searching. With the advent of the rich text and assistances, how does the searchers
nowadays interact with the SERP and the search assistance in different positions became
the focus of this study. To figure out the answer, this research explored the user
information-seeking behaviors on the SERP with a search assistance tool in different
layouts.
Numerous of the works and techniques in this area have explored the users’
behavior on SERP when they perform easy (navigational) information search tasks.
Meanwhile, several studies have shown the differentiation of human seeking behaviors
when they are asked to deal with tasks at various levels of difficulties. To give more
support on those complex (analytical/evaluative) tasks, various interactive tools are
investigated, among which different information, such as prior user search trails,
concepts, opinions, are embedded into the SERP.
Basically, there are two types of information assistance formats that prior studies
top-right of the page; both of them has shown their impacts independently. Generally,
verticals on SERP provide objective information related to the search terms, such as
image, video, shopping information, news, etc. (Arguello & Capra, 2014); while in the
entity card, previous studies tried to provide either objective or subjective (opinion, user
trails, etc.) even both (Navalpakkam et al., 2013; Bota et al., 2016).
In this study, we are interested in whether user engagement on SERP would be
affected by the position of a search assistance tool containing both objective and
subjective information. Two positions were evaluated in this study: 1) the assistance tool
was placed among the main search results -- under the first 2 results, and 2) the assistance
tool placed to the right of the main search results. User engagements on SERP include
both their interaction with the assistance tool and with the results on SERP. In addition,
an eye-tracking device and its system was introduced in this study to interpret users'
2.
Literature Review
2.1. User Engagement
In line with the emerging of alternative choices on the Internet: dozens of general
web search engines, numerous social media platform, etc., there is an impetus to move
beyond caring about the system’s usability. It’s in need to involve the user engagement
into the product development process. What’s user engagement? Its definition has been
adapting for decades; during the time, Laurel defined the engagement as “the state of
mind that we must attain in order to enjoy a representation of an action” (2013, p.139),
while from the perspective of how system works, it relates to the capability of “encourage
interaction” (Bannon, 2005, p.50), and “excite, motivate and enhance the user
experience” (Albers & Mazur, 2003, p.86). Considering some important factors in the
real industry, e.g. the user loyalty, user engagement should be examined in different
aspects, as a result, Lalmas et al. (2015, p.3) gave their definition to distinguish it in three
dimensions: it “is the emotional, cognitive, and behavioral experience of a user with a
technological resource that exists, at any point in time and over time”.
2.2. Measuring User Engagement
As stated earlier, user engagement is a multifaceted phenomenon which brings
about a quantity of approaches to measure it. Physiological measurement is one way to
commonly adopted in some search studies. They help to generate large amount of
objective data, such as clicking event, eye gaze data, etc., to provide evidence on users’
attentional responses even though users may not be aware of (Lalmas et al., 2015). In
another words, the data collected from these methods will not depend on users recall
about their experience, which is inadequate for the researchers to learn the insights
behind.
Self-reports, aiming to encourage people to share their perceptions, might be an
alternative to make up the loss; which including interviews, questionnaires, think-aloud,
stimulated recall, etc. The benefits of applying this method include gauging how engaged
were the user with the system, protecting the user from being identified, as well as
keeping the scale of the sampling (Fulmer & Frijters, 2009). Use Engagement Scale
(UES) is the latest questionnaire designed to measure the engagement using 31 items in
six sub-scales (O'Brien & Toms, 2010), which has been widely used with different types
of system, such as e-shopping platform (O’Brien, 2010) and Facebook (Banhawi & Ali,
2011). And in 2018, O’Brien et al. (2018) developed a new short form of the UES within
4 sub-scales as well as a guidance of adopting this into the study. Other self-report
methods, like interview and think-aloud, give rise to learn the participants insight and
how they interpret and experience with the system.
2.3. Search Engine Result Page
To response to the human query, the web search engine provides a page with a list
of results in which each item on the list includes the linked web page title with URL, a
Chowdhury et al. (2014)’s study, they found that the uncertainty during the information
search and retrieval (IS&R) process is not only caused by a knowledge gap between users
mind and the system language, it exists across different stages of IS&R process and
triggered by a number of information-seeking activities. Learned from this uncertainty
model, in order to minimize the negative impact on the uncertainty in the search process,
researchers use the collective qualitative data to interpret even predict human information
behaviors and launch several search assistances on the SERP.
2.4. Search Assistance on SERP
Various kinds of search assistance are designed to facilitate the users search
experience in different aspects of the search process (Capra et al. 2015), for example,
Google SERP provided several types of display features: 1) Featured snippets might be
shown above the original results when users ask a question in Google Search, this
contains a summary of the answer which extracted from a webpage, followed with a link
to the page, the page title, and URL (Google, 2019); several kinds of featured content
might appear in the snippets—numbered, bullet points, and paragraph. 2) Knowledge
panels, information boxes displayed in a rich outcome with images, text, and links which
are always integrated from multiple webpages, and it is appeared on the right side of the
SERP when users search for entities (Google, 2019). 3) Verticals are usually placed in the
middle of the search results and displayed as a carousel (Melucci & Baeza-Yates, 2011).
Depending on what users search, it provides tailored media to rich the page; common
type of medias is video, image, news.
In Arguello & Capra’s (2014) study, image vertical has shown stronger spill-over
using the eye-tracking technique, Bota et al. (2016) has shown that the Entity Card’s
influence on the user search behavior; among which diverse cards (with pictures) present
on the SERP generating less workload on users than non-diverse card (without pictures).
And in this study, pure textual assistance will be provided to study its effect on users’
attention and engagement.
2.5. Understand Search Behaviors using Eye-tracking
Eye-tracking technique has been used commonly so as to acquire detailed data to
study users’ eye-gaze while they’re performing search tasks (Guan & Cutrell, 2007;
Lorigo et al., 2006; Lagun et al., 2011; Rodden & Fu, 2007, 2008; Dumais et al., 2013).
From their work, the variation of user visual attention has been explored. Two studies
(Guan & Cutrell, 2007; Lorigo et al., 2006) found the effect of task complexity was
reflected on the variation of time and effort the participants spent on navigational tasks
and informational tasks—people spent more time on the informational search and were
less likely to issue a new query. By investigating the users’ reading pattern on SERP,
Thomas et al. (2013) found that users worked their way down the results list more
quickly, and also to a greater depth, on average position when they are performing more
complex tasks. In addition, in Dumais et al. (2013)’s study, they found that, on the SERP
which consist of original results, ads and related searches, users would pay more attention
on the middle part rather than other regions.
A large body of prior works has used eye-tracking techniques to understand how
users examine the search results on a SERP. It has been stated that the positions and
relevance of results affect the searchers’ examination of the SERP (Pan et al., 2007; Rose
divided the searchers into two types-- exhaustive and economic users. Exhaustive
searchers examine the SERP thoroughly, looking back and forth through the result list
several times before choosing a result link to click; while the economic users look over
the result from top to bottom once and select the very first result link they examined. In
addition, prior work has studied aggregated search results pages that incorporate different
“vertical” elements, Liu et al. (2015) found that users’ examination on original results
3.
Methodology
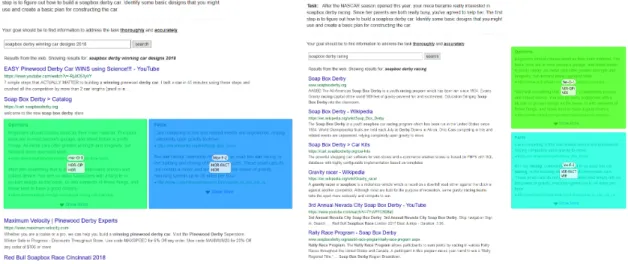
3.1. Search System
The search system used in this study is the InfoBox search system developed by
the Interactive Information Systems Lab led by Dr. Robert Capra. It allows participants to
construct queries, navigate to different pages from the search result page, as well as
provides information related to the search. The initial system assisted the user search with
four types of information—Facts, Opinions, Concepts, and Insights, and represented them
by placing an information box on the right side of the search result page with a tab bar. In
this study, in order to exploring user engagement with the search system and the search
assistance tool in different positions, two layouts of search interfaces were developed
based on the initial system: 1) the search assistance tool is placed among the main search
results—under first two results, and 2) the search assistance tool is placed to the right of
the main search results. Except the different positions of search assistance tool, the
content and the structure of these two interfaces are identical: the task description is
shown above the search box, and the search results is listed below the query. For each, it
contains the page title in blue followed by URL in green and a description about that
page. The pagination is placed at the bottom of the page (Appendix 7).
3.1.1 Search Assistance Tool—InfoBox
In the search assistance tool, we provide two types of information—Fact and
represented by the subset of the web page and the URL. The word in the subset matched
with the user query will be shown in bold, only the top two items will be displayed as
default and once the user clicks the “Show More”, the rest will be provided.
3.1.2 Search Environment
We use Firefox (version 45.0.9) to support the search system and the Tobii
Eye-tracking Extension. In addition, there are four buttons on the bookmark tab menu to
support the participants to complete the tasks: 1) bookmark this page, 2) show
bookmarks, 3) re-open search page, 4) done with the task. During the task, the
participants were asked to use the “Bookmark this page” button to collect useful
information answering to the task, and if they wanted to see all the bookmarked pages,
clicking the “Show bookmarks” button would display a pop-up window listed the current
set of bookmarks. And the “Re-open the search page” would help the participants to go
back to the search result page with their query.
3.2 Usability Study
In a lab environment, a usability test with an eye-tracker was conducted with 6
pilots and 12 participants in room 012 at Manning Hall. Each participant was asked to
complete two tasks by using a search system to find and bookmark webpages that were
useful in constructing an answer for the task. While they were working on the task, we
used a Tobii X2-60 eye-tracking system to keep track of where they looking on the
computer screen. We also recorded the screen activity and audio of the session. We used
an entry questionnaire to collect basic demographic information of the participants.
related to the task. After the tasks, we administered a retrospective video recall interview
to learn insights about their actions.
3.2.1 Experiment Design
The study was progressed as the following sequence. Participants were welcomed
by the moderator and explained the system that would guide them through the
experiment. They were provided a written consent form (Appendix 2) to sign, as well as a
second hard-copy version which was offered to them to take with them. After assigned
the participants with specific ID to record, they were given a brief introduction of the
study procedure as well as the instruction of the search system with buttons. Then the
moderator would help the participants to calibrate the eye-tracking equipment and began
recording the participant’s screen. After entering their participant ID, the participants
were asked to start the study with an entry questionnaire (Appendix 3) asking about basic
demographic information and the search self-efficacy, after which the search system
would guide them through the rest of the experiment procedure.
Participants were asked to use a live search system to find web pages that would
be useful in constructing a response for the task. Each participant worked on the same
two tasks by using the system with search assistance tool in two positions (horizontal and
vertical) correspondingly. For each task, it followed the same procedure:
1. Pre-task. Participants read a task description carefully and completed a
pre-task questionnaire (Appendix 4) which to assess their prior knowledge and the
prejudgment of the topic via 3 aspects: 1) their personal interest of the topic, 2) their prior
knowledge, 3) the topic difficulty, and 4) their perception about the “a priori
2. Perform task. Participants were then directed to the initial search interface and
performed the task. They were instructed to search naturally by constructing queries,
navigating to different pages, and collecting useful information for the tasks in order to
complete the task. During the exploration, participants were asked to bookmark useful
information as they found it. Participants made their own decision about when to
complete the task based upon whether they had found enough information to satisfy the
task.
3. Post-task. Participants were asked to fill out a 5-point scale post-task
questionnaire (Appendix 5) about the system quality and their engagement with the tasks.
The questions were adapted from the User Engagement Scale (UES)-Short Form
(O’Brien et al. ,2018). In this questionnaire, we measured user engagement by asking
nine questions related to three sub-scales, focused attention (FA), perceived usability
(PU), and Reward Factor (RW).
After the participant had completed the tasks, the moderator played back portions
of the recordings (computer screen and eye movements) around the first use of the
InfoBox for each task and asked questions about: (a) the overall system support based on
the content it provided, (b) their experiences using the two types of InfoBox, (c) any
benefits gained from using the InfoBox search assistance tool, and (d) how they focused
their attention (or not) on the different types of information presented in the InfoBox
search assistance tool. Participants were offered a $15 incentive and asked to sign a
3.2.2 Task Selection and Description
Fact-finding Task—HIV Task
You recently watched a documentary about people living with HIV in the United
States. You thought the disease was nearly eradicated and are now curious to know
more about the prevalence of the disease. Specifically, how many people in the US are
living with HIV?
Exploratory Task—Soapbox Car Task
After the NASCAR season opened this year, your niece became really interested in
soapbox derby racing. Since her parents are both really busy, you've agreed to help her.
The first step is to figure out how to build a soapbox derby car. Identify some basic
designs that you might use and create a basic plan for constructing the car.
Table 1. Task description
Based on the result of previous study that focused on how different types of
information can be useful as assistance for search tasks of differing complexity; we
selected one fact-finding task (HIV task) which as believed the Factual statement would
be helpful to answer, and one exploratory task (Soapbox car task) which the informed
Opinion might facilitate its completion. Table 1 shows the task description of the two
tasks.
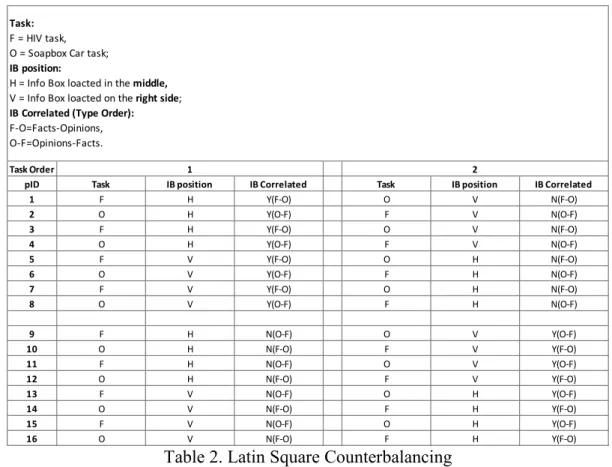
3.2.3 Counterbalance
The independent variables in this study—Task complexity, Info Box position and
the Info Box correlation— were within-subject variables, and each of them have two
conditions. Each participant completed two total tasks, so each participant only
the order effect caused by subjects’ learning, practice, or development of strategies, those
conditions were designed to rotate across participants using a Latin Square
counterbalancing method. Based on the task arrangement shown in Table 2, the search
system assigned the task and interfaces in different layouts to the participants via their
participant ID.
Table 2. Latin Square Counterbalancing
For example, the subject whose participant ID was “1” performed the HIV task
(task = F) with the search assistance tool located in the middle of the search results
horizontally (IBposition = H) in which the “Fact” box was placed on the left and the
“Opinion” box was on the right (meaning that the task and the first IB position on the left
were correlated in that they both focused on facts). For the second task, participant 1 was
then asked to search for the Soapbox Car task (task = O) with the InfoBox tool placed on
the right side of the SERP vertically (IBposition = V) where the “Fact” box was located Task Order
pID Task IB position IB Correlated Task IB position IB Correlated
1 F H Y(F-O) O V N(F-O)
2 O H Y(O-F) F V N(O-F)
3 F H Y(F-O) O V N(F-O)
4 O H Y(O-F) F V N(O-F)
5 F V Y(F-O) O H N(F-O)
6 O V Y(O-F) F H N(O-F)
7 F V Y(F-O) O H N(F-O)
8 O V Y(O-F) F H N(O-F)
9 F H N(O-F) O V Y(O-F)
10 O H N(F-O) F V Y(F-O)
11 F H N(O-F) O V Y(O-F)
12 O H N(F-O) F V Y(F-O)
13 F V N(O-F) O H Y(O-F)
14 O V N(F-O) F H Y(F-O)
15 F V N(O-F) O H Y(O-F)
16 O V N(F-O) F H Y(F-O)
1 2
Task: F = HIV task, O = Soapbox Car task; IB position:
above the “Opinion” one (this is correlated = N because the task is thought to involve
opinions, but the top IB box showed “Facts”).
3.2.4 Subjects
Given the consideration that the sampling size was 12-16 participants and the
scope was the UNC students who are at least 18 years old, fluent in English (reading,
writing, and speaking) and has no previous experience of participating study in the
Interactive Information Systems Lab; we reached out to UNC specific departments—
Political Science, Sociology, and School of Information and Library Science—and asked
them to distribute the recruiting email (Appendix 1). The students who showed their
interested in this study were asked to schedule the study time using a form on the
Bookings tool from Microsoft available through UNC. In addition, a reminder email was
sent to the participant one day before the study was conducted. Overall, the study
included 12 participants using the first twelve experiment task ordering shown as the first
twelve rows of Table 2.
3.2.5 Data Collection
Both the qualitative and quantitative data were collected in this study. The
qualitative data was collected from the answers to the retrospective video-stimulated
recall interview, which helped us to understand participants’ insights behind their
behaviors, as well as their expressed engagement with the search assistance tool. The
quantitative data were from: 1) the demographic data collected from the entry
through the Tobii eye-tracking hardware and software (Tobii Studio), and 4) the mouse
4.
Data Analysis & Result
4.1 Subject Demographic
In this study, we successfully recruited 12 participants among which six
participants are studying in School of Information and Library Science, four of them are
from Political Science, one major in Business Administration and one is studying in
Sociology. Also, this study has covered the participants from different education levels—
five of them are graduate students and seven are undergrads.
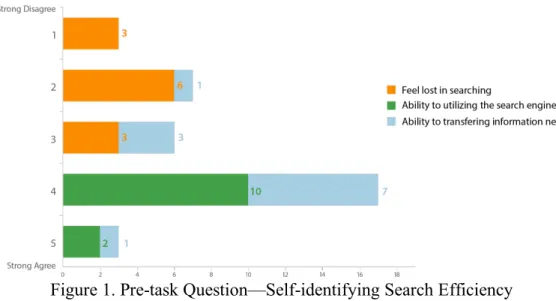
Figure 1. Pre-task Question—Self-identifying Search Efficiency
With the aims of understanding their web searching literacy, we included three
questions related their search efficiency, the participants were asked to select their level
of agreement on 5-point scales (1=strongly disagree, 5=strongly agree) for three
shown in the Appendix 3). As shown in Figure 1, all the participants agreed that they
could utilize the search engine well and would not feel confused very often while
searching online; while four participants didn’t think they could write effective query
during the search.
4.2 User Engagement (Quantitative Results)
4.2.1 Overview
To explore the difference of user engagement quantitatively, I analyzed the results
from the post-task questionnaire, the eye-gaze data, as well as aligning the eye-gaze data
with mouse events. No significant difference was found from the questionnaire data,
however, gathering from the measures of eye-gaze data and the mouse events, I found
that participants were easier to notice the assistance tool placed in the middle while the
one on the right side had more interaction with the participants who used it.
4.2.2 Post-task questionnaire
The post-task questionnaire was partially adapted from the UES-Short Form
which originally has 12 questions in four subscales—focused attention, perceived
usability, aesthetic appeal, and reward factor. Focused attention (FA) means the extent of
feeling absorbed during the interaction and losing track of time; perceived usability (PU)
is related to users’ affective and cognitive responses to the system (O’Brien & Toms,
2013); aesthetic appeal (AA) scales the user perception on the visual outlook of the
interface; and the reward factor (RW) is a single set of items made up of 1) user overall
success of the interaction, 2) novelty and interest in the task, and 3) the extent to involve
between two interfaces from the perspective of appearance, we decided to exclude those
three questions related to the AA and selected others into the 5-point scales post-task
questionnaire (1=strongly disagree, 5=strongly agree). In addition, two more questions in
the same scale was added with the aim of gathering the user opinion about the
information quality on the system (See Appendix 5 for the full text of the post-task
questions).
Figure 2. UES Score—Search System with InfoBox tool in the Middle (“Horizontal”) and that on the Side (“Vertical”)
In order to compare the user engagement with different interfaces, the
post-questionnaire results were grouped by the InfoBox positions (Horizontal and Vertical)
and measured separately. Followed by the instruction of scoring UES-short form from
(O’Brien et al., 2018), the PU score was firstly reversed and then the score of each
subscale was calculated by its average; the overall user engagement (UES) was
considered as the average of those three subscales. And the system quality (SysQual) was
measured by the average of two questions. The Figure 2 shows the means and 95%
confidence intervals of the overall UES measurement results and the system quality score
FA PU RW UES SysQual
Horizontal 2.83 3.69 3.95 3.49 4.25
Vertical 3.00 3.56 3.97 3.51 4.29
0.00 0.50 1.00 1.50 2.00 2.50 3.00 3.50 4.00 4.50 5.00
UES Result of InfoBox in Hor & Ver Layout
of the search system with search assistance tool in the middle (green color in Figure 2)
and that on the right side (blue color in Figure 2).
As Figure 2 shows, only slightly different is observed based on the post-task
questionnaire results between the search assistance tools in different positions, not only
reflected on the UES score, the similarity is also shown in each subscale score with
similar confidential interval. It indicates that the variation of the user engagement within
search assistance tool in different position isn’t shown through the post-task
questionnaires.
4.2.3 Eye Gaze Data
Figure 3. Area of Interest (AOI) on the search system in different layouts
Area of Interest is one of built-in tools in the Tobii Studio which allows the
researchers to get statistics for eye tracking metrics, such as Time to First Fixation or
Visit Count for areas they are interested in for one/many recordings by drawing ellipses,
rectangles, or polygons (Tobii, 2016). To exploring the user’s attention on the search
assistance tool, we draw AOI rectangles on the InfoBox from which SERP the
independent AOI on each page and grouped by both the layout and the information type
so as to compare the data across the medias. For example, as shown in Figure 3, on the
left, the AOI of “Opinion” was drawn and named by “Hor-O-1”, also it was marked as
belonging to the “HOR-OPI” AOI group and the “HOR” AOI group; while the “Fact”
AOI was outlined and named as “Hor-F-2”, grouped with the “HOR-FACT” as well as
the “HOR”. To compare the effect of the positions, we mainly focused on two AOI
groups —the “HOR” group which contains the area of the tool when it was in the middle,
and the “VER” group which include the area the tool placed on the right side.
Based on the AOI and AOI groups, we used the Tobii Studio embedded Statistics
tool to calculate eye tracking metrics. As shown in Table 3, we processed five metrics to
compare the participants’ attention on the InfoBox tool in different layouts; each
participant was identified as an individual, the “middle” and the “side” in the table are
related to the InfoBox located at different positions-- in the middle (“HOR”) and on the
right side (“VER”). The metrics we used are: 1) Time to First Fixation, 2) Total Fixation
Duration, 3) Total Visit Duration, 4) Fixation Count, and 5) Visit Count. Next, each
metric will be introduced separately and followed by the results we found on it:
1). Time to First Fixation measured the time it took before the participants
fixated on the AOI group for the first time. It started when any SERP with InfoBox tool
firstly displayed and stopped at the time the participants first fixated on it. If during the
study, the participant had no fixation on the AOI group, it would not be computed and
2). Total Fixation Duration described the sum of the duration for all fixations
from a participant within an AOI group. If at the end of the study, the participant had not
fixated on that group, it would be registered as “0”.
3). Total Visit Duration, different from the Total Fixation Duration which only
included the fixation time in the AOI group, total visit duration recorded the sum of each
visit duration—the time between the fixation on the AOI and the next one outside the
AOI group. This could be explained why the value of the Total Fixation Duration was
slightly smaller than this metric in Table 3.
4). Fixation count described the number of times a participant fixated on the AOI
group while 5). Visit count calculated the number of visits within an AOI group, that is
to say, it records the back and forth the participants looked between the InfoBox tool and
the rest of the page.
Table 3. Eye Tracking Metrics of the InfoBox AOI groups
To interpret the use of InfoBox tool by eye-gaze data, we took the data recorded
from the custom logging software to define the actions of clicking the URLs/buttons in
the InfoBox tool as effective interactions with the tool. In Table 3, for those experiences
the participants had interacted with the InfoBox tool, the data from which was marked in
bold and followed by the type of task they were performing (“F”=HIV task,
PID Middle Side Middle Side Middle Side Middle Side Middle Side Middle Side
1 3.29 75.43 5.28 0.28 5.28 0.28 20 1 11 1 9 0
2 11.12 8.21 1.4 24.09 F 1.4 25.13 F 7 107 F 5 13 F 2 94 F 3 5.23 - 12.59 F 0 12.59 F 0 38 F 0 5 F 0 33 F 0
4 40.7 - 1.28 0 1.28 0 5 0 5 0 0 0
5 7.88 - 9.33 0 9.54 0 31 0 12 0 19 0
6 7.89 77.99 2.85 1.62 2.85 1.62 12 7 7 3 5 4
7 1.85 4.05 3.26 31.11 F 3.26 31.11 F 15 110 F 11 19 F 4 91 F 8 3.96 3.48 9.77 F 9.85 O 9.77 F 9.85 O 35 F 33 O 6 F 6 O 29 F 27 O
9 16.99 38.22 3.84 2.74 3.84 2.74 17 8 12 3 5 5
10 4.93 - 6.7 0 6.7 0 24 0 14 0 10 0
11 2.64 21.76 7.81 F 25.09 O 7.81 F 25.09 O 33 F 109 O 7 F 14 O 26 F 95 O
12 12.65 1.55 1.68 0.4 1.68 0.4 6 2 3 1 3 1
MEAN 9.93 28.84 5.48 11.90 5.50 12.03 20.25 47.13 8.17 7.50 12.08 39.63
SUM 119.13 230.69 65.79 95.18 66.00 96.22 243 377 98 60 145 317
“O”=soapbox derby car task). The average of each metric is calculated by excluding the
individuals who had no fixation during that time, in other words, for the average of
metric recording the fixation data of the tool on the side, they were summed and divided
without those “0” values.
For the Time to First Fixation, the mean of that on the side InfoBox (AVG =
28.84s) is much larger than the mean of the that in the Middle one (AVG = 9.93s); in
addition, associating with the fact that there were 4 participants who had no fixations on
the side InfoBox, this metric showed that the assistance tool in the middle was easier to
be noticed by the participants.
Given the consideration that regardless of whether the eye-gaze measures imply
that user engaged with the assistance tool, if the users didn’t feel themselves engage in,
we couldn’t tell such fixations were valuable or had positive impact on the engagement
with the rest of the system. For this reason, with regard to other metrics, we decided to
focus on those records which have effective interaction on the InfoBox so as to analyze
the engagement with the tool as well as the rest of the system.
According to the order of the task assigned to the participants, half (6) of them did
the fact-finding task in the context of the InfoBox placed in the middle and vice versa. By
looking at the mean values of the Total Fixation Duration, it seemed that participants
expensed more time on the right side one. Including the task type into the consideration,
for each time the middle tool was utilized, the participant was performing the fact-finding
task (which overall required less time), while the side tool was used two times in the
fact-finding task and two times in the exploratory task. This may partially explain the
fixation time the participants spent on the middle tool (p3=12.59s; p8=9.77s; p11=7.81s)
was shorter than other two participants took on the side tool (p2=24.09s; p7=31.11s).
For the Visit Count, which reflected the participants’ eye movement between the
InfoBox and the rest of the page, it showed that for the subjects who interacted with the
tool (i.e., data formatted in bold and marked with “F” and “O” in Table 3), they had more
movements between the side tool and the rest of the page rather than the middle one. By
seeing the difference between the Fixation Count and the Visit Count of the subjects who
used the tool, the value of that related to the side tool was larger than the middle. This
could indicate that the participants who interacted with the InfoBox paid more attention
to the content of it when placing on the right side.
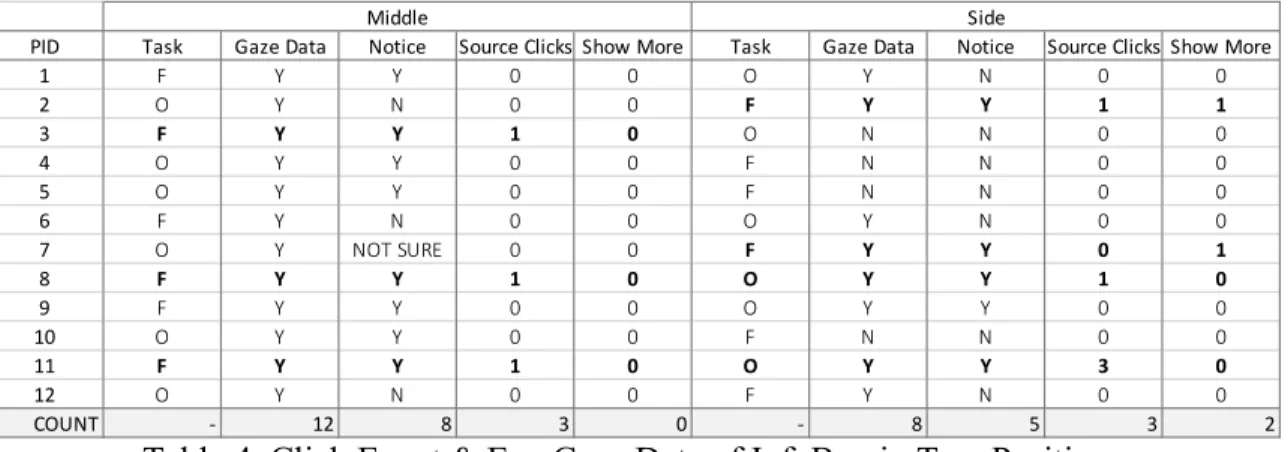
4.2.4 Click Events & Eye Gaze Data
Two types of mouse events on the InfoBox were collected from the custom
logging software. As shown in the Table 4 they were: 1) the number of clicks on the
source URL listed on the InfoBox, and 2) the number of clicks on the “Show More”
button to expand and show all the 10 results. The “Gaze Data” in the table means whether
participants had ever fixated on the InfoBox during the task. In addition, in order to
differentiate the situation that the participant saw the tool unconsciously and they actually
noticed its existence, we added the “Notice” column in the table which the data was
collected from the question “Do you remember seeing the InfoBox tool on this search
page?” in the retrospective recall interview. For example, the eye tracker recorded
participant 1 fixated on the InfoBox in the middle when they were performing the HIV
task, and they mentioned in the retrospective interview that they did notice the tool
more = 0). When they were performing the Soapbox Car task, their fixation on the
InfoBox placed on the right side had also been tracked, but they didn’t report during the
interview that they noticed the tool; in addition, no interaction had been recorded between
the tool and the participant in this task.
Table 4. Click Event & Eye Gaze Data of InfoBox in Two Positions
Across both tasks, five of the 12 participants clicked on the InfoBox tool during at
least one of the tasks (p2, p3, p7, p8, p11). Two participants used the InfoBoxes in both
layouts (p8, p11); one participant clicked the source in the InfoBox only when it was
placed in the middle (p3), while two participants only use it when it was on the right side
(p2, p7). In other words, 3 of 12 participants interacted with the InfoBox in the middle
and they all agreed that they gained useful information from the tool; 4 of 12 participants
interacted with the tool on the right side among which one of them reported that they
didn't gain anything useful from looking at it.
Looking at the data separately, all the participants (12) fixated on the InfoBox
placed in the middle, however, three of them didn’t think they had ever noticed the tool
while performing the task. Interestingly, for the rest of the participant who reported
noticing tool, there are five participants who noticed the InfoBox but didn't choose to do
any further action with it. This is different from the data of the InfoBox on the right side:
8 of 12 participants fixated on the InfoBox and five of them reported their notice of the
PID Task Gaze Data Notice Source Clicks Show More Task Gaze Data Notice Source Clicks Show More
1 F Y Y 0 0 O Y N 0 0
2 O Y N 0 0 F Y Y 1 1
3 F Y Y 1 0 O N N 0 0
4 O Y Y 0 0 F N N 0 0
5 O Y Y 0 0 F N N 0 0
6 F Y N 0 0 O Y N 0 0
7 O Y NOT SURE 0 0 F Y Y 0 1
8 F Y Y 1 0 O Y Y 1 0
9 F Y Y 0 0 O Y Y 0 0
10 O Y Y 0 0 F N N 0 0
11 F Y Y 1 0 O Y Y 3 0
12 O Y N 0 0 F Y N 0 0
COUNT - 12 8 3 0 - 8 5 3 2
InfoBox tool, among which there is only one participant who detected the tool but not
interacted with it.
4.3 User Engagement (Qualitative Result)
4.3.1 Use & Gain from the Box in the Middle
For the three participants who were able to use the InfoBox in the middle, in
describing about when and what exactly drew their attention, one of them thought they
noticed it immediately by seeing the "Fact" title in the box; the other two reported that
they didn't see it immediately: one mentioned that it was a number (e.g. statistic) in the
InfoBox that drew their attention when they just decided to find this type of data, while
another participant scanned the page from top to bottom carefully and thought the
rectangle format made the tool stand out and led them to see the numbers there.
Explaining why they (8/12) didn't notice/use the InfoBox tool in the middle, three
participants mentioned assuming that there were advertisements or something irrelevant
in the boxes; 2/8 participants mentioned that their previous search experience might have
influenced their impression: they didn’t think the assistance provided by the search
engine were helpful so they usually ignored it. Two participants mentioned that the
format/content provided in the InfoBox wasn’t attractive to them, among which one
mentioned that the pictures or instructions was what they would go to first (in Soapbox
Car task) and the other was looking for some specific numbers (in HIV task) at that time.
To be noticed, for the one who was looking for numbers, the “Fact” box was placed on
the right in the middle. The credibility of the source is another factor mentioned by two
4.3.2 Use & Gain from the Box on the Right Side
2 of 4 participants among who used the InfoBox placed on the right side thought
the content in the tool was the thing drew their attention, and they commented on this as
follows:
“I saw something about ‘materials’ which made me curious about what type of materials should use to build the car, and that’s the reason I clicked that link.” (P8)
“It was almost the first thing I saw…I think when I saw the numbers, when I was trying to find the exact number to answer the question, the box on the right stand up to me because there were more numbers popping out.” (P7)
One of them noticed the tool when they were waiting the page switching and they
thought the format looked like it would provide information in an easy way which the
original results did not. And the other one mentioned it was the time when he couldn't
find anything on the links on the left side; then they “realized to look on the right”.
Based on the result that seven participants didn’t notice the InfoBox on the right
side, five of them stated that they were more focusing on the main search area and they
didn’t usually pay any attention on the right side no matter there was some information or
advertisement there. The participant 5 expressed this as followed:
“… because I didn't expect anything that would be there, and focus on the output of the results… you know, sometimes I won’t close the pop-ups on the right side, I usually just ignored it.”
One participant explicitly expressed the confidence of their search capability, and defined
themselves as “pretty good at searching for exactly what I need”; as a result, they usually
search by themselves.
Different from the fact that there were five subjects who noticed the InfoBox in
using it. During the task, they noticed the tool when waiting for the page switching and
they stated that they didn't really absorb any useful information in the boxes during that
short time.
4.3.3 Preference on the Positions
Overall, when asked the preference of the InfoBox position, most of the
participants inclined to have it in the middle as to notice its existence; on the other hand,
with the knowledge that the content in the InfoBox is relevant, some participants are
more willing to have it on the right side to make the page cleaner.
Specifically, for the two participants who used the InfoBox on both positions,
they all preferred to have the tool in the middle of the page. They explicitly mentioned
that placing the InfoBox in the middle helped them to notice the tool faster than that on
the right side, also they thought they paid more attention on the tool in the middle than
the other one. Partially, the quick notice could be ascribed to the number (e.g., the HIV
statistic) shown in the content and their search behavior—by default, they don’t usually
pay much attention on the right side. While talking about this, both of the participants
pointed out their search experience on Google as follows:
“When it was on the side, part of my brain was kind of like ‘Oh, it was an advertisement’ and that was another reason I didn't look at it immediately, because I assumed that this was Ads and I didn’t want to look at it…And I know on Google normally that would be an Ad, so part of my brain immediately assumed to think it was an Ad, and after I was kind of realizing it wasn’t.” (P8)
Generally, 8 of 12 participants preferred the middle position, among which six of
them explained the reason behind it was that they would associate things in this position
with advertisements because Google put the advertisements there, which made them to
“… I think I like boxes …because on the side it seems irrelevant, because Google on the side they get Ads or prompting something irrelevant.”
Three participants mentioned that the middle position was more appealing and one of
them also stated the position on the right side would make them ignore the tool.
Additionally, one of the participants who inclined to the tool on the right side declared
that if it placed in the middle, they would get distracted; this, on the other hand, supports
the idea that the middle position was more noticeable than the right side.
There are four participants be more willing to have the tool on the side, two of
them indicated that it would make the layout of the page cleaner with knowledge of the
tool would be there:
“Perhaps on the side would be better because I know it’s there and its separate from the rest of the everything. It’s cleaner, like better design… it isn’t disrupted but it was there if I want to look at them.” (P4)
For the other two, they thought the tool on the right side was more standing-out and
distinguish from the left a lot more compared to the one in the middle.
“…It (right side) just stood out, it helped me to catch my eye on it more.” (P2)
Considering that both participants interacted with the box on the right side with the HIV
task and experienced the box in the middle with the soapbox task, we thought part of the
distinguish might be assigned to the variation of the content in the InfoBox.
4.3.4 Content Relevance to the Task
For the participants who used the InfoBox placed in both positions, one stated that
the “Fact” type of information was helpful to the fact-finding task (HIV task), and the
“Opinion” type of information helped them to complete the exploratory task (Soapbox
information hugely, instead, they were more focusing on one of the boxes during the
search.
We also asked other participants whether these two types of information would
provide dissimilar assistance in different tasks; for the fact-finding task, we got consistent
statement that the “Fact” would be more helpful; while for the exploratory task, six
participants opined that the “Opinion” would provide useful information while five
participants supposed that they would rather see some pictures or list of instructions in
the tool to help them finish up the construction plan of a Soapbox car.
4.4 Factors Affect the Use of InfoBox
4.4.1 The Authority of Source
During the retrospective interview, three participants mentioned the source of
information the InfoBox provided when talking about the motivation to use/not use it:
• One participant clicked the link after figuring that its source was reliable.
• One participant opined as followed as talking about the reason why they noticed
the tool but not used it:
“…… I didn't know the resource of that information so I would rather focus on finding the credible source.” (P5)
• One of the interesting observations is that there is one participant, at the very
beginning of their task, seeing the boxes and clicking “show more” on the Fact
box to go through the information, then they asked if they need to keep searching.
The moderator then indicated “yes” and after this the participant was more
focused on the links on the left and didn't take any further action with the boxes.
already known the answer to the task by looking at the first subtext in the
InfoBox; and in order to double check the number of populations, they chose to
look at the links on the left. Also, they expressed their concerns about the
authority of the sources listed in the box by saying that:
“I’m not sure where they getting that information from, so I did more research on the left to ensure that the information is trustful." (P7)
Additionally, when asking about the preference of the InfoBox position, one
participant related it with the trustful of the content by saying that:
“If the idea is to get me to see the boxes, I would prefer this layout (in the
middle) … if I knew that I could trust the content in the boxes, I would want them there, if I did not know that, they would prefer it on the side that I could ignore them.” (P5)
This, on the other hand, reflected the relation between the source authority and making
the decision to click the link to get more information.
4.4.2 Things That Block the Scent
Noticing that only a few participants had interacted with the InfoBox tool, we
wanted to dig deeper to interpret the reason behind it. Going back into the eye movement
data, some of the information foraging behaviors were observed when the participants
were interacting with the SERP, and we believe there are some factors in this study
blocking out the scent of the InfoBox tool, which may have affected its use or notice.
Camouflage Links
Taken from the observation, there is a common action of six participants occurred
when they were interacting with the system, which the InfoBox was in the middle: they
only read over the titles of the search results and naturally skipped the tool as to look at
page up and down didn’t take into account). Four of them explicitly mentioned that it was
because they direct their attention straight to the blue text—the title of each link (See the
examples of eye-gaze pattern in Appendix 8):
“I was like looking for the blue...I was looking for the titles of different pages and this looked like something else, it wasn't the same format, so this not let me interested in.” (P4)
This phenomenon also has also been observed in other eye-tracking research like
(Maynes & Everdell, 2014) that users are still looking of the list of search results when
new elements are introduced to the SERP, they would be distracted by those elements but
not really pay much attention to it. Diving into such “distraction but not attention”, some
participants related their search experience with their common-used search engine and
commented that:
“Since it seemed like what Google provided to you and I didn't find it’s useful on Google, so I would prefer naturally read the title and its description and search by myself.” (P10)
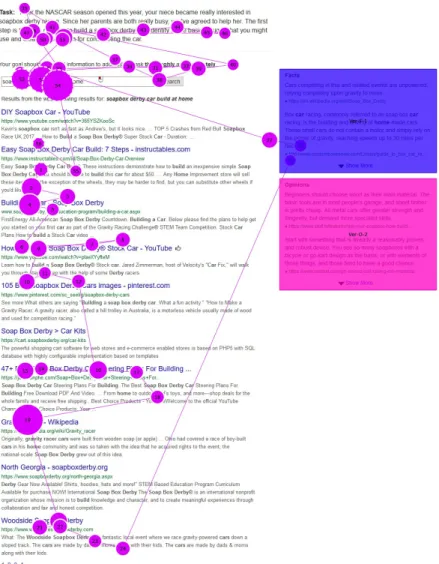
Banner Blindness
As stated earlier, in total, there were seven participants who didn’t notice the
InfoBox tool placed on the right side—no fixation was tracked from four participants and
fairly low visit duration was recorded from the other three participants (See the examples
of eye-gaze pattern in Appendix 9). According to the interview, we noticed that those
participants ignored the area on the right side due to their knowledge of the advertisement
or something irrelevant tend to be placed there. This observation matched the findings
from (Nielsen, 2007) that users come to disregard specific regions of the web page if they
unconsciously assign that area with the irrelevant information. The participants’ previous
may have built up such association over time. In addition, we believe this may be a type
of search habits that cannot be easily changed; which, somehow, had been reflected on
the answers collected from the retrospective interview—during the search, eight
participants related the right area as advertisements or irrelevant information, while four
participants have the similar assumption of the tool in the middle area and two
participants associated it with not helpful information.
4.4.3 Effects of Task Type
The effect of the task type was mainly reflected on providing some trace of the
InfoBox tool’s existence. For the participants who found and used the InfoBox in the
fact-finding task (HIV task), three of them explicitly mentioned that it was the number in
the InfoBox content that drew their attention:
“…I went back to read what the prompt was, and I realized I was just looking for numbers and that’s the time I saw the box, the number in it was immediately in my eyes.” (P8)
Addedly, two participants who used the InfoBox on the side in HIV task stated that they
preferred the tool on the side because it was more popping-out especially when included
the content with some numbers:
“Just because I can see it, it stood out to me more. I feel like it would be useful to have like the information for first task, if you're looking up certain number and stuff, and to have it show right away on the right corner, so you don’t have to keep searching....” (P7)
On the contrary, placing the information assistance for the exploratory task in the
middle made the information mixed together with the results and this seemed to have a
4.4.4 Possible Use Scenarios
During the interview, six participants expressed some situations in which they
would like to use the InfoBox. Standing in the context of searching something really
quick, such as movie star, and populations, three participants identified the InfoBox as a
fast pass or a summary to access the answer:
“I would like to use it to search for some real quick fact, like the HIV task, … or something I know nothing about it, like the name of a movie.” (P7)
One participant, on the other hand, didn’t think the information the tool provided would
directly tell them the answer. While practicing some complex task searching, two
participants regarded the InfoBox as a guidance by commented that:
“…the content in the box was a good place to start… and I feel like deeper diving into other search results then was also helpful…” (P11)
“If there is a topic I don't know anything about it, I might use it to kind of guide me...” (P9)
On the contrary, one participant mentioned that they won’t use the tool when facing with
complex searching task, because they thought the information in it was not enough to
provide comprehensive information, as a result, they would prefer to search by
5.
Discussion
This study aims to explore whether there was an effect of the relationship between
the search assistance tool’s position on the SERP and the user engagement during the
search. Overall, according to the quantitative data, we found that the search assistance
tool placed in the middle got easier attention from the participants, while the one on the
right side attracted more interactions during the use. To investigate the insight behind
such differences, we analyzed the qualitative data we collected from the retrospective
recall interview and we found that people had different interpretations on these two
positions: the middle is more reliable than the side, on the other hand, placing the tool on
the right side made the page cleaner. However, considering that most of the participants
didn’t use the tool even though they noticed that when it was in the middle, we were still
curious about the reason behind this observation. The interview from this study also
provides some insights about factors that affect the participants using the assistance tool.
Their concerns about the information credibility is one of them, also based on what we
learned from the retrospective interview, we believe the design of the assistance tool was
kind of blocking the information scent from the participants. In addition, we cannot rule
out the effect of the task type on the user engagement with the search assistance tool in
different layouts.
In order to reaching out and recruiting the proper number of participants, instead
to send out the emails and which may constrain the results to be generalized to represent
the overall student population. However, we didn’t restrict the scope into single school or
department, especially, we controlled the number of participants from SILS as to have
half of participants who were from SILS and half of them who are from other
departments. This aimed to recruit participants with diverse computer literacy. At the
beginning of the study, we planned to recruit 16 participants using the experiment
ordering to counterbalance the order effect; however, due to the time constraints, we
ended up the experiment by 12 participants, which made the results cannot fully rule out
the effect of the task type. Based on the current results, 6/12 participants have faced with
the InfoBox in the middle with fact-finding task and 6/12 participants have performed the
exploratory task within the interface having the InfoBox on the right side. We believed
that this basically helped to counterbalance the task type effect and the order effect
caused by 12 participants was more related to the internal position of the information
inside the tool (for example, whether the information placed on the left/above is
correlated with the type of task). The results of the pre-task questionnaire which related
to their pre-knowledge and prejudgment of the task was not included in the analysis. This
6.
Conclusion
My goal in this study was to explore the difference of user engagement with a
search assistance tool in different positions on a SERP. I investigated this by designing
and conducting an eye-tracking usability study with 12 UNC-CH students. Both
quantitative data and qualitative data were collected to interpret their engagement with
the search assistance tool in two positions: 1) search assistance tool placed under the top
two search results, 2) search assistance tool placed to the right side of page. The
quantitative data were analyzed in three aspects—answers to the post-task questions
(adapted from the UES-SF), measures generated from the eye-gaze data, and click events
aligning with the eye-gaze data. Although there was no significant difference observed in
the post-task questionnaire answers, we noticed some differentiation from the eye-gaze
data and click events. The search assistance tool placed in the middle appears to be
noticed by more participants. However, when placed on the right side, participants
appear to spend more time and effort engaging with it. The qualitative data gathered from
the retrospective interview has also reflected this on their preference of the search
assistance tool position. Some participants thought placed it in the middle was easier to
be found and on the other side, they preferred the right-side position if they had the
knowledge of the existence of the tool. In addition, we also found some factors that
influence the notice/use of the search assistance tool from the retrospective interview.
tool. Secondly, common issues like camouflage links, banner blindness, were observed
which may block the information scent of the search assistance tool. Also, individual
search preference and the type of tasks may influence on the use/notice of search
assistance tool on SERP.
My findings reveal that the search assistance tool in different positions affect its
notice and use reflected both on time and effort people spent. Additionally, people have
various perceptions of information placed in different positions on a SERP. The results of
this study would be helpful for the future development of the InfoBox system project on
some decisions related to the design and position. Also, it would be useful to other
researchers who are working on search assistance tools by providing some insights of
7.
Acknowledgement
This project would not be possible without the help of my supervisor—Dr. Robert
Capra who continues providing suggestions and keep me on the right track, Austin Ward
who was always willing to provide the technical support on implementing the changes of
the InfoBox system, and Anita Crescenzi who gave me huge support on learning the
8.
Bibliography
1. Albers, M. J., & Mazur, M. B. (Eds.). (2014). Content and complexity: information
design in technical communication. Routledge.
2. Arguello, J., & Capra, R. (2014, November). The effects of vertical rank and border
on aggregated search coherence and search behavior. In Proceedings of the 23rd
ACM International Conference on Conference on Information and Knowledge
Management (pp. 539-548). ACM.
3. Aula, A., Majaranta, P., and Raiha, K.-J. (2005). Eye-tracking reveals personal styles
for search result evaluation. INTER- ACT, 1058–1061.
4. Bannon, L. J. (2005). A human-centred perspective on interaction design. In Future
interaction design (pp. 31-51). Springer, London.
5. Banhawi, F., & Ali, N. M. (2011, June). Measuring user engagement attributes in
social networking application. In 2011 International Conference on Semantic
Technology and Information Retrieval (pp. 297-301). IEEE.
6. Bota, H., Zhou, K., & Jose, J. M. (2016, March). Playing your cards right: The effect
of entity cards on search behaviour and workload. In Proceedings of the 2016 ACM
on Conference on Human Information Interaction and Retrieval (pp. 131-140). ACM.
7. Capra, R., Arguello, J., Crescenzi, A., & Vardell, E. (2015, August). Differences in
38th International ACM SIGIR Conference on Research and Development in
Information Retrieval (pp. 23-32). ACM.
8. Chowdhury, S., Gibb, F., & Landoni, M. (2014). A model of uncertainty and its
relation to information seeking and retrieval (IS&R). Journal of Documentation,
70(4), 575-604.
9. Dumais, S. T., Buscher, G., & Cutrell, E. (2010, August). Individual differences in
gaze patterns for web search. In Proceedings of the third symposium on Information
interaction in context (pp. 185-194). ACM.
10.Enable Search result features for your site - Search Console Help. (2019). Retrieved
from https://support.google.com/webmasters/answer/7358659?hl=en
11.Featured snippets in search - Search Console Help. (2019). Retrieved from
https://support.google.com/webmasters/answer/6229325?hl=en
12.Fulmer, S. M., & Frijters, J. C. (2009). A review of self-report and alternative
approaches in the measurement of student motivation. Educational Psychology
Review, 21(3), 219-246.
13.Granka, L. A., Joachims, T., & Gay, G. (2004, July). Eye-tracking analysis of user
behavior in WWW search. In Proceedings of the 27th annual international ACM
SIGIR conference on Research and development in information retrieval
(pp.478-479). ACM.
14.Guan, Z. and Cutrell, E. (2007). An eye tracking study of the effect of target rank on
web search. Proc. CHI, 417–420.
15.Laurel, B. (2013). Computers as theatre. Addison-Wesley.
studies of Web search examination and interaction. SIGIR, 365–374.
17.Lagun, D. and Agichtein, E. (2011). ViewSer: Enabling large-scale remote user
studies of Web search examination and interaction. SIGIR, 365–374.
18.Lorigo, L., Pan, B., Hembrooke, H., Joachims, T., Granka, L., and Gay, G. (2006).
The influence of task and gender on search evaluation and behavior using Google.
IP&M, 42(4): 1123–1131.
19.Liu, Z., Liu, Y., Zhou, K., Zhang, M., & Ma, S. (2015, August). Influence of vertical
result in web search examination. In Proceedings of the 38th International ACM
SIGIR Conference on Research and Development in Information Retrieval
(pp.193-202). ACM.
20.Maynes, R., & Everdell, I. (2014). The evolution of Google search results pages and
their effects on user behavior [PDF file]. USA: Mediative. Retrieved from
https://www.slideshare.net/GerardoEJuarez/the-evolution-of-googles-search-results-pages-effects-on-user-behaviour
21.Melucci, M., & Baeza-Yates, R. (Eds.). (2011). Advanced topics in information
retrieval (Vol. 33). Springer Science & Business Media.
22.Nielsen, J. (2007). Banner blindness: old and new findings. Retrieved from
https://www.nngroup.com/articles/banner-blindness-old-and-new-findings/
23.Navalpakkam, V., Jentzsch, L., Sayres, R., Ravi, S., Ahmed, A., & Smola, A. (2013,
May). Measurement and modeling of eye-mouse behavior in the presence of
nonlinear page layouts. In Proceedings of the 22nd international conference on World
24.O'Brien, H. L., & Toms, E. G. (2010). The development and evaluation of a survey to
measure user engagement. Journal of the American Society for Information Science
and Technology, 61(1), 50-69.
25.O’Brien, H. L. (2010). The influence of hedonic and utilitarian motivations on user
engagement: The case of online shopping experiences. Interacting with
computers, 22(5), 344-352.
26.O’Brien, H. L., & Toms, E. G. (2013). Examining the generalizability of the User
Engagement Scale (UES) in exploratory search. Information Processing &
Management, 49(5), 1092-1107.
27.O’Brien, H. L., Cairns, P., & Hall, M. (2018). A practical approach to measuring user
engagement with the refined user engagement scale (UES) and new UES short form.
International Journal of Human-Computer Studies, 112, 28-39.
28.Pan, B., Hembrooke, H., Joachims, T., Lorigo, L., Gay, G., & Granka, L. (2007). In
google we trust: Users’ decisions on rank, position, and relevance. Journal of
computer-mediated communication, 12(3), 801-823.
29.Rodden, K. and Fu, X. (2007). Exploring how mouse movements relate to eye
movements on web search results pages. SIGIR Workshop on Web Info. Seek. and
Interact., 29–32.
30.Rodden, K., Fu, X., Aula, A., and Spiro, I. (2008). Eye- mouse coordination patterns
on web search results pages. Ext. Abstracts CHI, 2997–3002.
31.Rose, D. E., & Levinson, D. (2004). Understanding User Goals in Web Search."
Proceedings of the 13th international conference on World Wide Web, New York,
32.Thomas, P., Scholer, F., & Moffat, A. (2013, December). What users do: The eyes
have it. In Asia Information Retrieval Symposium (pp. 416-427). Springer, Berlin,
Heidelberg.
33.Tobii, A. B. (2016). Tobii Studio user’ s manual v3. 4.5. Retrieved from
Appendix 1 Recruiting Emails
[Recruitment Email]
To: Informational email list for UNC students Cc: [INSERT RECRUITING EMAIL ADDRESS]
Subject: Participants needed: Web search system usability study --- Message Text ---
We are recruiting participants for a research study to help us understand how people use search engines to find information on the Internet.
If you volunteer and are scheduled for this study, you will complete a series of search tasks and answer questions about your experience. To gain insights, as part of the study, we will use an eye-tracker to track what you look at on the screen. You will receive $15 for participating.
This research study will take approximately 45 minutes to complete. Sessions will be held in the Interactive Information Systems Lab on-campus in Manning Hall (next to Lenoir).
We are currently scheduling study sessions with UNC students who are at least 18 years old, fluent in English (reading, writing, and speaking) and who has never participated in a study held in Interactive Information Systems Lab before.
To sign-up to participate in the research study, visit [INSERT URL to questionnaire in Qualtrics] to provide contact information and to let us know times when you are available to participate in the study.
You can contact the researchers by sending an email to [INSERT EMAIL ADDRESS].
Many Thanks,
Yu Yuan, Principal Investigators | Rob Capra, Faculty Advisor School of Information and Library Science
University of North Carolina at Chapel Hill