DIGITAL DISRUPTION & INNOVATIVE OPERATIONS: IMPLICATIONS OF 3D PRINTING BUSINESS MODELS AND MAKER MOVEMENT
Nagarajan Sethuraman
A dissertation submitted to the faculty of the University of North Carolina at Chapel Hill in partial fulfillment of the requirements for the degree of Doctor of Philosophy in the
Department of Operations in the Kenan-Flagler Business School.
Chapel Hill 2019
Approved by:
Jayashankar M. Swaminathan
Ali K. Parlakt¨urk
Lauren X. Lu
Bradley R. Staats
c
O2019
ABSTRACT:
Nagarajan Sethuraman: DIGITAL DISRUPTION & INNOVATIVE OPERATIONS: IMPLICATIONS OF 3D PRINTING BUSINESS MODELS AND MAKER
MOVEMENT.
(Under the direction of Jayashankar M. Swaminathan and Ali K. Parlakt¨urk.)
ACKNOWLEDGMENTS
I would not have taken up, persisted and attained the goal of PhD and academic career, if not for some truly great individuals who were of immense help and inspiration.
I would like to thank my dissertation committee chair, Prof. Jayashankar Swaminathan. He instilled a strong sense of rigor in my work. I have always appreciated how he has been open to my ideas while asking critical questions to take them in the right direction. Without his guidance and advice, my dissertation would not have reached this level. In addition to his input on research, he also understood the challenges of taking up a PhD while having a family. He also supported me during difficult times of personal loss. Thanks, Jay - for all your support and guidance through this program.
I am thankful to my PhD co-advisor Prof. Ali Parlakt¨urk. His sharp and clear feedback on my research has helped me immensely. He has always been available when I need to discuss aspects of my research and looking for feedback. Thanks, Ali -for your research guidance and support during difficult times.
I would like to thank my dissertation committee members Prof. Lauren Lu, Prof. Bradley Staats and Prof. Sriram Narayanan for serving on my dissertation committee despite their busy schedule, and providing valuable feedback. I also would like to thank Sriram for many phone calls during a difficult personal loss during the program. His perspective helped me handle the situation better. I also would like to thank all faculty members in the operations department, and the department chair Prof. Vinayak Deshpande for their support.
to complete my dissertation. I am indebted to my father Sethuraman, my mother Dhanalakshmi, and my aunt Saraswathy. They gave me the freedom to pursue my passion throughout my life. The values they instilled in me helped me get through my PhD program. Though they are unfortunately not there to see me finishing the degree, I hope to always have their blessings in my life and the academic career. I also would like to thank my father-in-law Sachidananda and mother-in-law Ananthi for their love and support.
TABLE OF CONTENTS
LIST OF TABLES . . . x
LIST OF FIGURES . . . xi
1 Introduction . . . 1
1.1 Competitive Value of Personal Fabrication in Vertically Differentiated Markets . . . 2
1.2 Personal Fabrication & Design Personalization: Value of Enabling Customers to Tweak Product Designs . . . 3
1.3 Delegating Production to the Retail Stores: Influence of Channel Structure and Buzz Effect on In-store 3D Printing . . . 4
1.4 Product Design Innovation in the Maker Movement: Impact of Innovator Learning, Innovativeness, and Manufacturability . . . 6
2 Competitive Value of Personal Fabrication in Vertically Differentiated Markets 7 2.1 Literature Review . . . 9
2.2 Base Model: Personalization and Market Structure . . . 11
2.2.1 PF Strategy for a Monopolist . . . 13
2.2.2 Competitive Value of Personalization Enabled by PF Strategy . . . 13
2.3 Skewed and Uncertain Demand . . . 16
2.3.1 Skewed Demand Model . . . 16
2.3.2 Effect of Demand Uncertainty . . . 18
2.4 Technology Evolution and IP/Liability Concerns . . . 21
2.4.1 3D Printing’s Cost Disadvantage . . . 21
2.4.2 Addressing IP/Liability/Technology Restrictions: Partial PF Strategy . . . . 23
3 Personal Fabrication & Design Personalization: Value of Enabling Customers
to Tweak Product Designs . . . 28
3.1 Literature Review . . . 29
3.2 Model: Personalization in Vertical and Horizontal Dimensions . . . 30
3.3 Value of PF Strategy . . . 32
3.3.1 Effect of Demand Uncertainty . . . 33
3.4 Cost Disadvantage of PF Strategy & Intellectual Property (IP) Concerns . . . 34
3.4.1 Impact of Cost Disadvantage for PF strategy . . . 35
3.4.2 Partial PF to Mitigate IP Issues . . . 35
3.5 Conclusions . . . 36
4 Delegating Production to the Retail Stores: Influence of Channel Structure and Buzz Effect on In-store 3D Printing . . . 38
4.1 Literature Review . . . 40
4.2 Model . . . 42
4.2.1 Standard and 3D Products . . . 42
4.2.2 3D Printing Queue and Costs . . . 43
4.2.3 Buzz Effect and Demand Externality of 3D Printing at Retail Store . . . 45
4.2.4 Product Line Composition and the Benchmark . . . 46
4.3 Centralized Channel . . . 46
4.3.1 Impact of Selling a Competing Standard Product at the Retail Store . . . 48
4.4 Decentralized Channel . . . 50
4.5 Decentralized Channel with Competition and the Importance of Buzz Effect . . . 53
4.5.1 Impact of Buzz Effect . . . 54
4.6 Conclusions and Future Research . . . 55
5 Product Design Innovation in the Maker Movement: Impact of Innovator Learn-ing, Innovativeness, and Manufacturability . . . 57
5.1 Literature Review . . . 58
5.3 Hypothesis Development . . . 61
5.4 Data . . . 62
5.5 Measure Development . . . 63
5.5.1 Design Intricacy . . . 64
5.5.2 Manufacturing Complexity . . . 64
5.5.3 Innovator Learning . . . 64
5.6 Control Variables . . . 65
5.6.1 Design Category . . . 65
5.7 Sampling and Cleaning for the Analysis . . . 66
5.8 Model and Results . . . 66
5.8.1 Model Setup and Variables . . . 66
5.8.2 Results of the Model on Downloads: . . . 67
5.8.3 Results of the Model on Copies: . . . 67
5.8.4 Results of the Model on Derivatives: . . . 67
5.9 Conclusions and Planned Future Work . . . 68
6 Conclusions & Future Research . . . 69
APPENDIX 1: PROOFS OF PROPOSITIONS AND LEMMAS IN CHAPTER 2 . . . 70
APPENDIX 2: PROOFS OF PROPOSITIONS AND LEMMAS IN CHAPTER 3 . . . 85
APPENDIX 3: PROOFS OF PROPOSITIONS AND LEMMAS IN CHAPTER 4 . . . 90
LIST OF TABLES
1.1 Survey Result from Gartner (O’Marah and Chen, 2017): With respect to supply chain strategy, which of the following technologies are disruptive and important for
your company? . . . 2
A4.1 Negative Binomial Regression Results for Downloads . . . 100
A4.2 Negative Binomial Regression Results for Copies . . . 101
LIST OF FIGURES
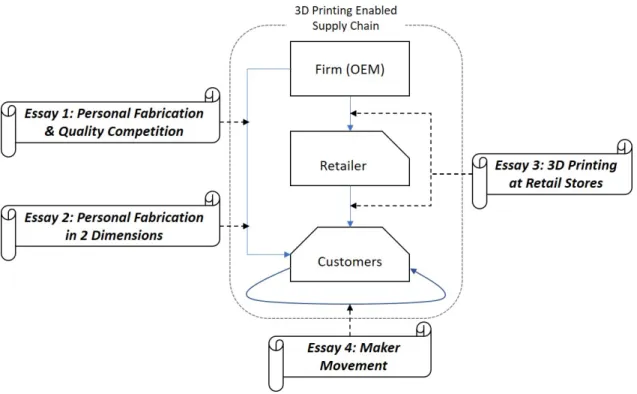
1.1 Overview of my Dissertation . . . 3
2.1 Customer Utilities from PF Vs Traditional Monopoly . . . 13
2.2 Firm Profitability With and Without PF Strategy Under Monopoly and Duopoly . . 15
2.3 Trapezoidal Distribution of Customers’ Types . . . 17
2.4 Profit Comparisons With Respect to Customer Distribution Type . . . 18
2.5 Value of PF Strategy for a Monopolist Facing Demand Uncertainty . . . 19
2.6 Additional Value of PF Strategy Under Demand Uncertainty When Competing Against a Traditional Firm . . . 21
2.7 Profitability of PF Strategy in the Presence of a Cost Disadvantage . . . 22
2.8 Impact of Cost Differential and Customer Distribution on the Attractiveness of PPF Strategy . . . 24
3.1 Cylindrical Market and Traditional Product Space . . . 30
4.1 Standard and 3D products . . . 42
5.1 Activities in a Design Sharing Platform . . . 60
5.2 Growth of New Product Designs in Thigiverse . . . 62
CHAPTER 1: Introduction
Digital technologies are accelerating supply chain innovation thereby disrupting existing busi-ness models (Anderson et al., 2017). In a survey of global supply chain managers byGartner (Table 1.1), 3D printing is one of the digital technologies that are considered to be highly disruptive and important (O’Marah and Chen, 2017). 3D printing — also known as additive manufacturing — is a manufacturing technology that can produce parts directly from a 3D computer model, without any need for specialized tools. It has been hailed as an enabler for the next industrial revolution and is expected to change the way products are designed, produced and delivered to customers (D’Aveni, 2015; Markillie, 2012; Nigro and Schiller, 2017). The technology enables manufacturing to move closer to the customers — to a retail store or even to a customer’s home. Such a delegation of manufacturing down the supply chain enables greater personalization while protecting the firm against demand fluctuations (Piller et al., 2015; Gibson, 2018). However, before incorporating 3D printing in their business models, firms need to understand the trade-offs such as capacity invest-ment cost, higher production cost, externalities on their existing product line, and supply chain coordination issues.
In a McKinsey survey of leading manufacturers, 40% of the respondents were unfamiliar with 3D printing and were ill-prepared to identify its business opportunities (Cohen et al., 2015b). The tradeoffs involved in moving manufacturing closer to the customer using 3D printing are not addressed by the academic literature as well. In my dissertation, we attempt to bridge this gap. We study the trade-offs involved in personalization focused business models enabled by 3D printing, which move manufacturing closer to the customer; We prescribe effective ways of employing 3D printing in such business models.
communit-Table 1.1: Survey Result fromGartner (O’Marah and Chen, 2017): With respect to supply chain strategy, which of the following technologies are disruptive and important for your company?
Technology Irrelevant Interesting,
but unclear usefulness
Disruptive and important
Big data analysis 2 14 84
Internet of things 4 23 73
Cloud computing 4 27 69
Machine learning 6 32 62
Advanced robotics 8 30 62
3D printing 17 41 42
Drones/self-guided vehicles 16 43 41
Sharing economy 15 50 35
Blockchain 14 61 25
ies engage in product design innovation. Through this research, we offer insights to makerspace platforms on how to effectively foster community-driven innovation.
1.1 Competitive Value of Personal Fabrication in Vertically Differentiated Markets
In the first essay of my dissertation, we explore how a firm can leverage the personal fabrication (PF) phenomenon where customers control the manufacturing of the product. A firm that adopts personal fabrication (PF) strategy, sells the products’ design directly to the customer and lets the customers manufacture the product using 3D printing services. We characterize the market and operational conditions that make PF an attractive operational strategy.
Figure 1.1: Overview of my Dissertation
PF strategy may also hinge on the reduction in the cost disadvantage of PF relative to traditional production.
Our research provides timely insights that can help firms assess attractiveness of the PF business model enabled by 3D printing. The discussion on PF in the business press is often centered around its personalization benefits and the cost and IP/liability concerns. Our work contributes to this debate by studying the interplay among these issues and the market conditions such as competition, quality/price consciousness of the customer base and demand uncertainty, and providing deeper insights on when PF might be a beneficial strategy.
1.2 Personal Fabrication & Design Personalization: Value of Enabling Customers to Tweak Product Designs
is generally considered to be difficult for an end customer, as it requires knowledge of specialized software tools. However, these software tools are being made more easier and are becoming widely used. Firms selling product designs through personal fabrication strategy have also started assisting customers with horizontal personalization. Considering this scenario, we study personal fabrication in 2 dimensions, where customer personalizes the product in both the dimensions.
We propose a cylindrical modeling framework to study 2 dimensional personalization enabled by personal fabrication. In our model, the circular dimension of the cylinder represents customer’s horizontal (taste) preferences. The length dimension of the cylinder captures their quality sensit-ivity. With this model, we study the value of personal fabrication in different market structures and product line characteristics. When personal fabrication enables personalization in both the dimensions, we find that the firm can benefit in monopoly setting as well. In markets where cus-tomers do not value horizontal personalization, personal fabrication strategy can still be profitable in monopoly setting, if there is uncertainty about the customers’ quality sensitivity. Personal fab-rication strategy can be profitable even if customers face a cost disadvantage of production. When the market has stronger intensity for their taste (horizontal) preferences, PF strategy will be prof-itable under even higher cost disadvantage levels. However, if the firm already has a product line of more than one traditional products, value of adopting PF strategy decreases. We also show that our insights about the partial PF strategy (to mitigate IP/liability concerns) discussed in the first essay carry over to the generalized two dimensional model.
1.3 Delegating Production to the Retail Stores: Influence of Channel Structure and Buzz Effect on In-store 3D Printing
We capture two key attributes of in-store 3D printing: retail store congestion due to customers’ wait times and buzz effect. In-store 3D printing implies that customers need to wait for the product to be 3D printed, which may lead to congestion. We capture this aspect in our model. In addition to providing a customized product, in-store 3D printing is also expected to increase retail footfall by providing a buzz factor (Trinh, 2017; Vitone, 2016). While customization is provided by the 3D printed product, the buzz effect increases the potential demand for the firm’s standard product line as well by increasing retail traffic. We study the effectiveness of in-store 3D printing under different channel structures (centralized vs decentralized), different market characteristics (niche vs saturated), and product characteristics. Using our results, we highlight the settings where the strategy can be profitably employed.
1.4 Product Design Innovation in the Maker Movement: Impact of Innovator Learn-ing, Innovativeness, and Manufacturability
CHAPTER 2: Competitive Value of Personal Fabrication in Vertically Differentiated Markets
Personal fabrication (PF) is an emerging phenomenon enabled by additive manufacturing (widely known and hereafter referred to as 3D printing) and computerized product designs, where customers control the manufacturing of products (Gershenfeld, 2008). In this case, customers can buy a product’s design and get it manufactured in their desired material, accuracy and surface finish using firms that offer 3D printing as a service. Customers can avail 3D printing services either in their neighborhood (e.g. Lowes orUPS stores) or over the internet (e.g. Shapeways.com). Such an ecosystem enables firms to employ Personal Fabrication (PF) strategy: sell their product’s design — instead of manufactured product — and delegate the product’s production to the customer, thereby allowing her to personalize the product. Many industry analysts and thought leaders (e.g., Lipson and Kurman 2010, D’Aveni 2013, Rayna and Striukova 2016, Piller et al. 2015) predict PF strategy to be the new way of delivering products to customers. There are already many examples of this strategy: for example, independent designers sell product designs of jewelry, footwear, toys or electronic accessories in 3D design marketplaces such as pinshape.com or cgtrader.com, which can then be 3D printed in different materials. However, there are two important barriers that may prevent widespread adoption of PF strategy: high production costs of 3D printing and intellectual property/product liability concerns. Furthermore, it is not obvious whether the product person-alization enabled by the PF strategy can benefit the firm. This is because PF strategy does not allow customized prices based on the product configuration choices made by the customer, since the customer personalizes the product after she purchases the product design.
Abrams, 2015). Our second research goal is to study the implications of this cost evolution on the adoption of PF strategy. While adopting PF strategy, a firm faces intellectual property (IP) risks, since the product’s computerized design (code) can be shared over the internet (Desai and Magliocca, 2013). Product liability is another important concern (Wang, 2016). To overcome these issues, a firm may engage in partial PF strategy, where it identifies a proportion of the product that has manageable IP/liability risks and delegates only that portion to the customer; the firm produces the rest of the product itself. Our third research goal is to characterize conditions under which such a partial PF strategy would be desirable.
In this paper, we focus on the quality (vertical) dimension of product personalization. Almost all 3D printing services offer a variety of materials and surface finish qualities at different price points. For example, the customer may choose a low cost and low quality option through 3dhubs.com, or choose high-end printing at high cost through Shapeways.com. We study both monopoly and duopoly and consider PF strategy and traditional production. Furthermore, we consider top vs bottom-heavy markets: the top-heavy market has a higher relative density of quality conscious customers (who have a higher willingness to pay for quality), whereas the bottom-heavy market has a higher relative density of price conscious customers (who have a lower willingness to pay for quality). These comparisons help us tease out the value of adopting PF in different scenarios.
exhibits more variability.
By employing an exhaustive numerical analysis covering the entire parameter space, we show that PF strategy can be attractive even when it has a cost disadvantage. We find that it can tolerate a higher cost disadvantage in bottom-heavy markets with relatively more price conscious customers. However, when PF becomes cost competitive, it will be more valuable in top-heavy markets with relatively more quality conscious customers. Through an extensive numerical study, we find that the feasibility of partial PF strategy critically depends on the cost of 3D printing relative to traditional production. Firstly, partial PF strategy can be beneficial only if a large enough proportion of the product can be delegated for customer’s production. Secondly, the minimal required proportion increases in the cost disadvantage of 3D printing. Therefore, if a firm could only delegate a small proportion for customers’ production, it needs to wait for the 3D printing technology to mature and become cost competitive. When the technology is cost competitive, we find that firms operating in more bottom-heavy markets can successfully implement partial PF strategy with a smaller delegated proportion. In contrast, the firms operating in more top-heavy markets need to delegate higher proportion of the product to benefit from partial PF strategy.
2.1 Literature Review
There is a growing business literature about the new business models enabled by 3D printing and the roadblocks for these business models (Piller et al., 2015). The rise of personal fabrication in the recent years has been documented by Mota (2011) and Rayna and Striukova (2016) using descriptive case research methods. However, prior to our work, the effectiveness of personal fabrication strategy as a new business model and its critical roadblocks have not been rigorously studied using an analytical framework.
inventory and batch sizing. Heese and Swaminathan (2006) study how product line decisions are influenced by component commonality decisions. For a given product line, Lee and Tang (1997) and Swaminathan and Tayur (1998) prescribe postponement and delayed differentiation as effi-cient methods of delivering the product line to customers. This literature considers product line design and manufacturing planning as decisions of the firm. On the contrary, a firm employing PF strategy, delegates product positioning and manufacturing decisions to the customer. There is a rich operations literature on mass customization (Mendelson and Parlakt¨urk, 2008a,b; Alptekino˘glu and Corbett, 2008; Xia and Rajagopalan, 2009; C¸ il and Pangburn, 2017). In the mass customiza-tion setting, the firm offers customized configuracustomiza-tions of products; the product configuracustomiza-tions are completely realized (into a manufactured product) by the time of sale. This allows the firm to price the product according to the chosen configuration. In contrast, in the PF setting, the product con-figuration is not fully determined at the time of sale. Hence, while enabling product customization, the firm cannot charge differential prices based on the realized configuration. This aspect differ-entiates PF from the mass customization setting. For example, we find that the PF strategy does not improve the profitability of the firm in monopoly setting in comparison to mass customization that has been shown to improve the firm’s profitability (e.g., Mendelson and Parlakt¨urk 2008a).
Our work also contributes to customer co-creation/ co-production literature, as personal fab-rication can be considered as a de-coupled form of co-production. In a traditional co-production framework, customers and the firm work together, exchanging knowledge to co-create the product or the service (Prahalad and Ramaswamy, 2004; Roels et al., 2010; Roels, 2014). While a firm that engages in personal fabrication co-produces the product with the customer, their respective decisions on the product are decoupled. The firm’s design and customers’ production decisions are made independently. Moreover, most of the literature on co-production focuses on service settings. Our work extends the customer co-production literature by studying the implications of decoupled co-production in a product setting.
part using a local 3D printer or adopt a hybrid approach. Westerweel et al. (2016) study if a firm should use 3D printing or traditional manufacturing techniques for producing component parts from the perspective of component reliability. Chen et al. (2017) study how 3D printing can be effectively employed in a retail setting and its implications for supply chain coordination. Different from these papers, our work focuses on a different influence of 3D printing on supply chain management: personal fabrication and quality customization. Dong et al. (2016) also study the impact of 3D printing technology on optimal assortments and product variety. They study how a firm can incorporate 3D printing in its internal manufacturing setup. In contrast, our work focuses on the case, where 3D printing is used by customers outside of the firm’s manufacturing setup. Finally, different from all of the prior literature on 3D printing, our work considers research questions about production delegation: under what situation PF strategy is profitable and how much production should be delegated to customers?
2.2 Base Model: Personalization and Market Structure
In our model, customers vary in their willingness to pay for a quality attribute. Though we consider a single quality attribute, it can be thought of as a combination of all the relevant quality characteristics of a product (Moorthy, 1988; Heese and Swaminathan, 2006) such as the material (plastic, bronze, steel etc.), surface finish and accuracy. In the base model, customer types θ are uniformly distributed in the unit interval [0,1] with unit total mass. In the subsequent sections, we relax this assumption and consider a non-uniform distribution with demand uncertainty.
We consider two types of firms: traditional and personal fabrication (PF) firms. Atraditional firm designs and manufactures the product and therefore decides both pricept and qualityqt. If a
customer of typeθ buys the product from a traditional firm, she obtains the utility Ut(qt, pt;θ) =
θqt−pt. APF firm only carries out product design and delegates the manufacturing responsibility
to the customer. A customer of type θ may purchase the product’s design from the PF firm for a price pp and manufacture the product on her own, after choosing the quality level qc∗(θ)
increasing in quality level qc. Specifically, the customer’s manufacturing cost is q2. Hence, the
utility obtained by type θcustomer is given by the following maximization problem:
Up(pp;θ) = max qc
(θqc−pp−qc2) (2.1)
As the utility function in (2.1) is concave inqc, the optimum quality level is given by the first order
condition: q∗c = θ2. Hence, type θ customer will obtain a utility of Up∗(pp;θ) = θ
2
4 −pp. Every customer in the market either buys exactly one unit of the product or refrains from buying if none of the products in the market yields a non-negative utility.
Remark 2.1. ∂U ∗ p(pp;θ)
∂θ >0 and
∂Ut(qt,pt;θ)
∂θ >0. Furthermore, ∂2U∗
p(pp;θ)
∂θ2 >0 and
∂2U
t(qt,pt;θ) ∂θ2 = 0.
Both PF and traditional firm provide a higher utility to a higher type customer. However, a higher type customer receives increasingly higher utility from the PF firm, while that effect is not present for a traditional firm. Therefore, the PF firm will be increasingly more attractive for higher type customers (i.e., high valuation segment).
Let the demand generated for a product sold by the traditional firm with quality level qt
and price pt, be Dt(pt, qt). Similarly, the demand generated for a product design from PF firm
with price pp is given by Dp(pp). In our base model, customers and the firm have the same cost
structure: Cc(q) =Ct(q) =q2. We study the implications of the cost disadvantage for 3D printing
in section 2.4.1. The traditional firm that chooses the quality qt and the price pt will make the
following profit:
Πt(qt, pt) = (pt−qt2)Dt(pt, qt) (2.2)
PF firm does not incur any marginal cost, as it is not producing the product. The PF firm that chooses the price pp will make the following profit:
Figure 2.1: Customer Utilities from PF Vs Traditional Monopoly
PF Firm Traditional Firm
0.0 0.2 0.4 0.6 0.8 1.0
0.00 0.02 0.04 0.06 0.08 0.10 0.12 0.14
Willingness to Pay For Quality(θ)
Customer
's
Utility
2.2.1 PF Strategy for a Monopolist
We consider a niche market with a single firm. The following proposition shows that a mono-polist may not benefit from the adoption of PF strategy.
Proposition 2.1. A PF monopolist earns the same profit as that of a traditional monopolist.
However, consumers obtain larger surplus from a PF monopolist.
All proofs are presented in the appendix.
The literature on strategic management indicates that some technological innovations and in-novative business strategies—while creating value for customers—may fail to offer an improvement in profits for the firm. The firm may not be able to extract the value created by the innovation (Teece, 1986; Brandenburger and Stuart, 1996). Proposition 2.1 shows that this difficulty is present in PF strategy as well. However, personalization enabled by the PF strategy creates additional value to customers: customers with higher types (θ) receive increasingly higher utility from the PF firm than the traditional firm as shown in Figure 2.1. In order for the firm to extract this additional value created through personalization, it would need to charge the customer a customized price based on the quality level chosen by her. However, the PF firm only sells product design and the customer’s selection of their desired quality level happens after their purchase of the product’s design. Therefore, the firm does not have the ability to extract the value created by PF strategy.
2.2.2 Competitive Value of Personalization Enabled by PF Strategy
Subsequently, we study how a PF firm would perform when competing against a traditional firm (Section 2.2.2.2); contrasting those results with the benchmark helps us tease out the value of PF strategy when competing against a traditional firm.
2.2.2.1 Benchmark: Competition Between Two Traditional Firms
We consider two traditional firms each offering a single product. The product of firm i is characterized by its qualityqi and pricepi, wherei= 1 or 2. The firms are symmetric in their cost
structure. The two firms first set their quality levels simultaneously and then they simultaneously set their prices.
Proposition 2.2. When two traditional firms compete, the following results hold:
(i) In equilibrium (SPNE), one of the firms occupy the high quality position and the other firm
occupy the low quality position.
(ii) The firm that chooses higher quality level achieves a higher profit compared to the firm that
chooses lower quality level.
Proposition 2.2 shows that the high quality position is preferred by both firms. However, because of symmetry, each firm can end up being a high or low quality firm. Hence, throughout our discussion, we shall have two benchmarks: high quality benchmark and low quality benchmark.
2.2.2.2 PF Strategy for Competing against a Traditional Firm
Figure 2.2: Firm Profitability With and Without PF Strategy Under Monopoly and Duopoly
With PF Strategy Without PF Strategy
Monopoly Duopoly:
High Quality Benchmark
Duopoly: Low Quality Benchmark 0.000
0.005 0.010 0.015 0.020 0.025 0.030 0.035
Firm
Profit
can react to the competitor’s price changes more quickly, as they are likely to operate as an internet channel selling product designs (computer code), as opposed to physical products. Our Stackelberg pricing model with the PF firm as the follower captures this relative pricing agility.
Proposition 2.3. In the competition between a PF firm and a traditional firm, there exists a
unique sub game perfect Nash equilibrium, where the PF firm captures the high end segment and
makes a higher profit compared to the traditional firm.
PF strategy enables the firm to capture the high end segment. On the other hand, in the com-petition between two traditional firms, either firm can capture the high-end segment (Proposition 2.2). Comparing the equilibria profits characterized by Propositions 2.2 and 2.3, we obtain the following corollary.
Corollary 2.1. When competing against a traditional firm, adopting PF strategy always improves
profitability.
Corollary 2.1 establishes that adopting PF strategy is valuable when competing against another traditional firm, irrespective of the type of benchmark (high or low quality benchmark).
2.2.2.3 Monopoly vs. Duopoly Comparison
consistently creates value for customers both in monopoly and duopoly settings. However, the firm can appropriate this value only in the duopoly setting. The value of PF strategy increases even further when the firm is in a more competitively disadvantageous position (low quality position in the duopoly benchmark competition). We explain how PF strategy generates value in competition using the notion of commitment.
Proposition 2.4. While competing against a traditional firm, a firm adopting PF strategy will
capture the same margin, demand and hence profit as that of a traditional firm that can credibly
commit to the monopoly optimal quality position.
Ability to commit to a quality level is valuable in the competition between two traditional firms. It deters the competitor from choosing a higher quality level. However, making such a commitment requires a credible commitment device. Proposition 2.4 shows that the PF strategy provides the equivalent benefits of a credible commitment. When a firm adopts PF strategy, it delegates the quality decision of its product to its customers. The quality level of the PF firm’s product for every customerθ is always set at individually optimal quality level. Hence, a traditional firm competing with a PF firm has no alternative other than toreact to the PF firm’s implicit quality commitment. However, without a competitor quality commitment is not useful. Therefore, PF strategy does not improve profitability in a monopoly.
2.3 Skewed and Uncertain Demand
In this section, we study the impact of skewed demand distributions capturing the mix of quality vs. price conscious customers. We introduce a trapezoidal demand distribution model that parsimoniously captures this trade-off. We also generalize this model further to study what happens when the firm is uncertain about this demand distribution.
2.3.1 Skewed Demand Model
Figure 2.3: Trapezoidal Distribution of Customers’ Types
(a) Bottom-Heavy Distribution (b= 0) (b) Top-Heavy Distribution (b= 1)
height of the trapezoid at the right extreme represents the density of highly quality conscious customers (θ= 1) and is given by 1+32 b; the distribution parameterb∈[0,1] indicates the relative weight of quality conscious customers (high θ) compared to the price conscious customers (low
θ). The cumulative distribution function is given by Fb(x) =
4 3(1+b)
x+ 3b−41
x2
. Uniform distribution studied in the previous section is a special case withb= 13. The demand of a firm that serves customer segment [θ1, θ2] is then given by:
Db(θ
1, θ2) =
4 3(1 +b)
Z θ2
θ1
1 +
3b−1 2
θ
dθ (2.4)
Using this framework, we define two specific distributions called bottom-heavy distribution (FB)
whereb= 0 andtop-heavy distribution (FT) whereb= 1. FB has relatively higher density of price
conscious customers as shown in Figure 2.3a, where bottom end of the market is twice as dense as the top end and. In contrast, FT has relatively higher density of quality conscious customers as
shown in Figure 2.3b, where top end of the market is twice as dense as the bottom end. In both
FB and FT scenarios, the maximum demand attainable by any firm is 1 as seen in (2.4).
Proposition 2.5.
i) The following statements hold for both FB and FT scenarios:
a) In a monopoly setting, PF strategy does not improve the profitability of the firm.
b) While competing against another traditional firm, PF strategy guarantees high quality
posi-tion and improves profitability.
ii) While competing against another traditional firm, PF strategy provides a higher profit
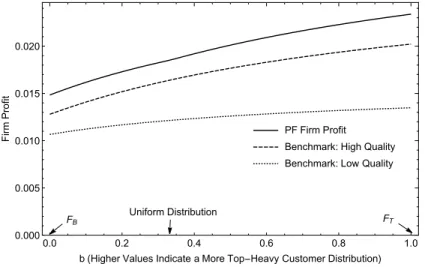
Figure 2.4: Profit Comparisons With Respect to Customer Distribution Type
PF Firm Profit Benchmark: High Quality Benchmark: Low Quality
FB FT
Uniform Distribution
0.0 0.2 0.4 0.6 0.8 1.0
0.000 0.005 0.010 0.015 0.020
b(Higher Values Indicate a More Top-Heavy Customer Distribution)
Firm
Profit
Part (i) of Proposition 2.5 basically generalizes Propositions 2.1 and 2.3. Part (ii) shows that the magnitude of the profit increase from adopting PF depends on the customer distribution. Specifically, it is higher in a top-heavy market — when there are more quality conscious customers. This observation implies that firms that operate in a top-heavy market stands to gain more by adopting PF strategy.
We have also conducted an exhaustive numerical analysis and studied the value of adopting PF strategy under all possible customer distributions that lie between FB and FT i.e., b∈ [0,1]. We
used a step size of 0.01 in this study. As shown in Figure 2.4, we find that our insights continue to hold for those intermediate customer type distributions as well.
2.3.2 Effect of Demand Uncertainty
In many settings, a firm may face uncertainty about the customer distribution: it may not precisely know this distribution. We parsimoniously model this scenario as follows. In the first period, both firms know that the customer distribution will be one of the two typesFb1 orFb2 with probabilityφand 1−φrespectively. We considerb1 < b2 such thatFb2 is relatively more top-heavy thanFb1. At the start of the second period, this uncertainty is resolved and both firms know which one of Fb1 orFb2 represents the customer distribution.
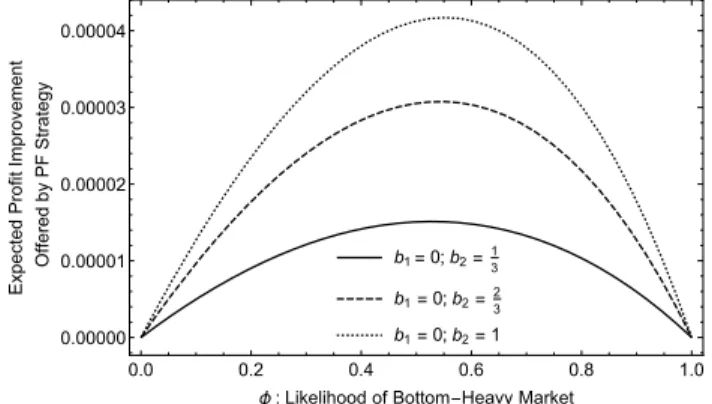
Figure 2.5: Value of PF Strategy for a Monopolist Facing Demand Uncertainty
b1=0;b2=13
b1=0;b2=23
b1=0;b2=1
0.0 0.2 0.4 0.6 0.8 1.0
0.00000 0.00001 0.00002 0.00003 0.00004
ϕ: Likelihood of Bottom-Heavy Market
Expected
Profit
Improvement
Offered
by
PF
Strategy
quality and it has to be determined ahead of time. Both firms make price decisions after the realization of the customer demand distribution. When they compete, similar to Section 2.2, PF firm sets its price after traditional firm.
Lemma 2.1. A PF monopolist will make the same expected profit as that of a traditional monopolist
that can postpone the quality decision until after the realization of customer distribution uncertainty.
It is valuable for a traditional firm to postpone the quality decision until after the uncertainty in customer distribution is resolved. However, such a postponement is often impractical, as the product needs to be manufactured ahead of time. Lemma 2.1 shows that PF strategy provides the equivalent benefit of postponing the product’s quality positioning decision. This leads to the following result on the benefit of PF strategy for a monopolist facing demand uncertainty.
Proposition 2.6. PF strategy improves the profitability of a monopolist only when there is demand
uncertainty.
We are not able to obtain closed-form characterization of equilibria of duopoly scenarios when demand exhibits uncertainty. Therefore, we conducted a numerical study that considered sev-eral scenarios. Here, we present our findings for a representative set of scenarios: {b1, b2} ∈ {{0,13},{0,23},{0,1}}. The insights that we generate from these examples carry over to all other scenarios that we have studied.
We find that the benchmark (duopoly of two traditional firms) results are qualitatively similar to those of the deterministic benchmarks (Proposition 2.2). Similar to Section 2.2, there can be two benchmarks: high vs low quality benchmarks. The high quality firm makes a higher profit in the duopoly of two traditional firms. Therefore, we will use high quality benchmark as a conservative benchmark: the value of PF would be even higher compared to low quality benchmark. LetπUBM
show the profit of high quality benchmark.
In the competition between a PF and a traditional firm, we observe that the resulting equilib-rium is unique, in which PF firm captures the higher valuation (highθ) segment and makes higher expected profit (πUp) compared to the traditional firm. In this case, PF strategy also improves profitability by performing better than the benchmark: πpU > πUBM.
It would be helpful to tease out the value of PF due to demand uncertainty. Such a profit increase quantifies the value of the postponement aspect of PF strategy, over and above the personalization aspect. To characterize this profit increment, we introduce the following notation. We denote the profit obtained by a PF firm in the deterministically known customer distribution Fb while
competing against a traditional firm asπpb. Likewise, for the same distribution, we denote the high quality benchmark profit as πBMb . Thus, the expected profit increment specifically due to demand uncertainty ∆UP F(b1, b2, φ) is given by:
∆UP F(b1, b2, φ) = πpU−πUBM
| {z }
Profit improvement under demand uncertainty
−φπb1
p −πbBM1
+ (1−φ)πb2
p −πbBM2
| {z }
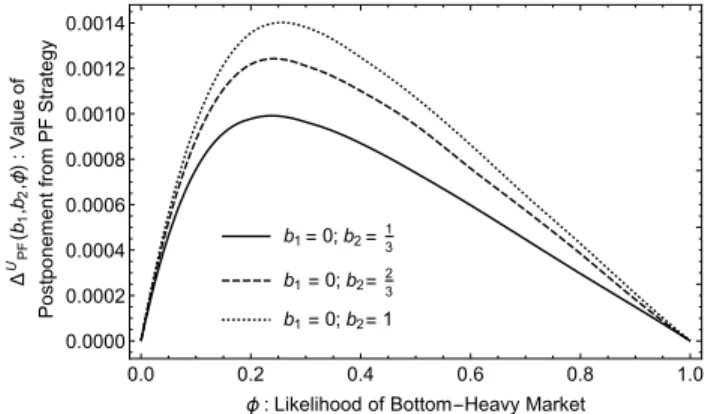
Figure 2.6: Additional Value of PF Strategy Under Demand Uncertainty When Competing Against a Traditional Firm
b1=0;b2=13
b1=0;b2=2
3
b1=0;b2=1
0.0 0.2 0.4 0.6 0.8 1.0
0.0000 0.0002 0.0004 0.0006 0.0008 0.0010 0.0012 0.0014
ϕ: Likelihood of Bottom-Heavy Market
Δ
UPF
(
b1
,
b2
,
ϕ
)
:Value
of
Postponement
from
PF
Strategy
this case, the traditional firm’s quality decision becomes more inefficient. This hurts the benchmark profit, which leads to higher profit increment for PF strategy.
2.4 Technology Evolution and IP/Liability Concerns
We now study two extensions to our model. We first study what happens when PF has a production cost disadvantage compared to traditional production. We then allow the firm to implement apartial PF strategy that can mitigate the IP/liability concerns. We use the trapezoidal customer distribution model of Section 2.3.1 in both of these extensions.
2.4.1 3D Printing’s Cost Disadvantage
Consider the case where 3D printing may have a production cost disadvantage compared to the traditional manufacturing. Specifically, the customer’s production cost for a given quality level
q is ξq2, whereas the firms’ production cost is q2. In this cost structure, ξ represents the cost disadvantage of 3D printing compared to traditional production. For example, a value of ξ = 2 means that 3D printing is twice as costly as traditional manufacturing.
After substituting her optimal quality choice, the customer’s utility for the PF product in (2.1) reduces to: Up∗(pp;θ, ξ) = θ
2
4ξ−pp. With this model, we consider the competition between a PF firm
Figure 2.7: Profitability of PF Strategy in the Presence of a Cost Disadvantage
(a) Profit Comparison with Benchmark
ξ=1.00
ξ=1.05
ξ=1.08
0.0 0.2 0.4 0.6 0.8 1.0
0.000 0.001 0.002 0.003
b(Higher Values Indicate a More Top-Heavy Customer Distribution)
PF
Profit
-Conservative
Benchmark
Profit
(b) Profitability Region for PF Strategy
Not Profitable
Profitable
0.0 0.2 0.4 0.6 0.8 1.0
1.07 1.08 1.09 1.10 1.11
b(Higher Values Indicate a More Top-Heavy Customer Distribution)
ξ
:Cost
Disadvantage
of
3D
Printing
study for the entire parameter space of b∈[0,1] andξ∈[1,2].
One critical takeaway from our analysis is that the PF strategy can remain profitable even under a cost disadvantage as seen in Figure 2.7. For example, at 5% cost disadvantage level, PF strategy is beneficial for all customer type distributions. However, at 8% cost disadvantage level, PF strategy is attractive only for more bottom-heavy distributions (b <0.45). Figure 2.7b shows the level of cost disadvantage PF strategy can tolerate for all possible parameters in our parameter spaceb∈[0,1]. We used the conservative benchmark (high quality traditional firm) in our analysis. One might expect the PF strategy to tolerate a higher cost disadvantage in a more top-heavy market (higherb), as it has a relatively higher density of quality conscious customers. Interestingly, we find that 3D printing technology has to be very cost competitive for PF strategy to be profitable in such markets. For example, whenb= 1, the 3D printing’s technology’s cost disadvantage has to be less than 6.3%. On the other hand, PF strategy remains profitable even at a cost disadvantage of more than 10.6% when b=0, that is when the market is more bottom-heavy with a relatively high density of price conscious customers.
a high cost disadvantage, the traditional firm can increase the quality of its product because of this competitive advantage. In top-heavy markets (higher b), the traditional firm finds it more attractive to capture the high end. However, in a bottom-heavy market (lower b), the traditional firm has a lesser incentive to capture the high end, thus allowing PF firm to stay at the high end. This competitive dynamic enables PF strategy to be more profitable in bottom-heavy markets when there is a high cost disadvantage for 3D printing.
In summary, technology and cost evolution of 3D printing can play an important role in de-termining the kind of products/firms for which PF strategy will be profitable. When the cost disadvantage of 3D printing is relatively high (as it arguably is currently), PF strategy can be suc-cessfully employed by firms targeting bottom-heavy markets. Firms that want to target top-heavy markets may need to wait for the 3D printing technology to mature further such that the cost disadvantage becomes relatively small (6% in our study).
2.4.2 Addressing IP/Liability/Technology Restrictions: Partial PF Strategy
In this section, we study what happens when a firm delegates only a proportion of the product to the customer. In this case, the customer gets access to the product design for a part of the product and receives the rest as a pre-manufactured product. We refer to this business model aspartial PF strategy. A firm may adopt the partial PF strategy to mitigate concerns about intellectual property (IP) (Desai and Magliocca, 2013) or product liability (Wang, 2016). In this context, we answer a critical question: what is the minimal proportion of the product that needs to be delegated for this strategy to be beneficial? We also study the impact of the production cost disadvantage and the shape of customer type distribution (top vs bottom heavy) on this required delegation level.
A firm adopting partial PF strategy (hereafter referred as PPF firm) delegates the production of dproportion of the product to customers, where 0< d≤1. PPF firm chooses the quality level
qp for the remainder of the product. The utility of a customer buying from the PPF firm is given
by:
Up(qp, pp;θ, ξ) = max qc
θ(dqc+ (1−d)qp)−pp−dξq2c (2.6)
Because each customer θ chooses qc∗ = 2θξ, her utility U∗
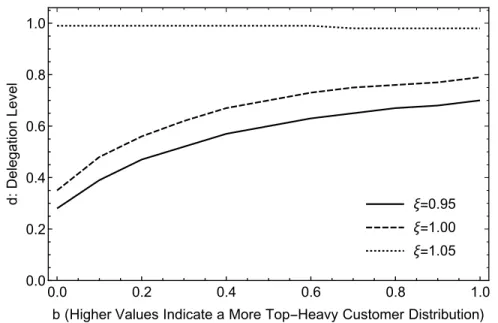
Figure 2.8: Impact of Cost Differential and Customer Distribution on the Attractiveness of PPF Strategy
ξ=0.95
ξ=1.00
ξ=1.05
0.0 0.2 0.4 0.6 0.8 1.0
0.0 0.2 0.4 0.6 0.8 1.0
b(Higher Values Indicate a More Top-Heavy Customer Distribution)
d
:
Delegation
Level
4qp)−pp. The PPF firm manufactures (1−d) proportion of the product using traditional methods
at a cost of (1−d)q2p; it does not incur the cost penalty ξ like the customer.
We consider the competition between a PPF firm and a traditional firm, where PPF firm decides the delegated proportiondfirst and then sets the quality level simultaneously with traditional firm. The remaining events are same as before. Deriving the traditional firm’s optimal price in this game requires finding the root of a sixth-degree polynomial and for that reason we cannot characterize the equilibrium in closed form. However, we can numerically solve for the equilibrium. Hence, we have conducted a numerical study to derive insights. Specifically, we conducted an exhaustive numerical study and considered the entire parameter space of d∈[0,1] and b∈ [0,1] and several values of ξ. Figure 2.8 presents our findings for ξ= 0.95,1.00 and 1.05. This set is representative of many other ξ values that we explored. Figure 2.8 shows when PPF strategy can be profitable. Specifically, for a givenξ, PPF is profitable when (b, d) pair is above the curve.
When PPF firm delegates a larger d proportion of the product two things can happen: customers benefit more from personalization but the overall cost of PPF firm’s product can increase as PF may have a higher cost than traditional production. Our numerical results show that when d is sufficiently large the former dominates whereas when it is small the latter dominates.
Capturing the high-end segment is critical for profitability of PPF firm. Delegating a larger proportion of the product ensures that PPF firm captures the high-end segment. Overall, a firm can be assured to benefit from PPF strategy, only if delegates a large enough proportion of the product. Moreover, whenever the partial PF is profitable, it is optimal to implement full PF by delegating all production to customers. However, we recognize that IP and liability risks may limit how much of the product can be delegated. Therefore, our results suggest that a firm can benefit from PPF strategy, only if it can identify a large enough proportion of the product with manageable IP/liability risks that can be delegated to customers. Furthermore, our results show that this critical delegation proportion is determined by the cost difference between PF and traditional production and distribution of customer types.
Remark 2.2. ∂2Up(qp,pp;θ,ξ)
∂θ2 = 2dξ and
∂2U
t(pt,qt;θ) ∂θ2 = 0.
Similar to our observation in Remark 2.1, PPF strategy provides increasingly higher utility to higher valuation customers as shown in Remark 2.2. Furthermore, delegating a larger proportion
Next, let us discuss the impact of customer distribution. Our numerical study shows that when PF is cost competitive (ξ= 0.95 and 1.00) a top-heavy (more quality conscious) market requires a higher proportion of the product to be delegated. As we discussed in Section 2.4.1, the traditional firm has higher incentive to capture the high-end segment in a top-heavy market. Therefore, the PPF firm can ensure capturing the high-end segment only if it can delegate a larger proportion d. In contrast, PPF firm can ensure capturing the high-end with a substantially smaller delegation in a bottom-heavy (more price conscious) market since the traditional firm has less incentive to compete for the high-end segment in that case. Hence, our results suggest that the feasibility of PPF strategy also depends on the firm’s targeted market type. Firms targeting a more bottom-heavy market can manage IP/liability risks relatively easily by delegating a smaller proportion of the product.
2.5 Conclusions
3D printing has been hailed as an enabler for the next industrial revolution and is expected to change the way products are produced and delivered to customers (D’Aveni, 2013; Lipson and Kurman, 2010). However, there are also cautioning voices that point out the limitations of this technology (Holweg, 2015). Many firms are still exploring effective ways of utilizing this technology in their business models. In a McKinsey survey of leading manufacturers, 40% of the respondents were unfamiliar with 3D printing and were ill-prepared to identify its business opportunities (Cohen et al., 2015a). In this context, our research provides timely insights that can help firms assess attractiveness of the PF business model enabled by 3D printing. The discussion on PF in the business press is often centered around its personalization benefits and the cost and IP/liability concerns. Our work contributes to this debate by studying the interplay among these issues and the market conditions such as competition, quality/price consciousness of the customer base and demand uncertainty, and providing deeper insights on when PF might be a beneficial strategy.
PF enabled personalization, this additional value is helpful when competing against a traditional firm.
The cost disadvantage of 3D printing relative to traditional production is often considered as one of the key barriers to widespread adoption of PF. However, this cost gap is expected to shrink over time following the advances in technology. Our findings show that the changes in this cost gap will have an important implication on how PF can compete with traditional production: while success of PF may be limited to more bottom-heavy markets when the cost gap is higher, reductions in this cost gap can open up more top-heavy markets for PF as well.
PF brings IP risks and product liability concerns. Partial PF strategy may alleviate some of these concerns. Interestingly, our work shows that the feasibility of partial PF strategy may also hinge on the reduction in the cost disadvantage of PF relative to traditional production.
CHAPTER 3: Personal Fabrication & Design Personalization: Value of Enabling Customers to Tweak Product Designs
In this essay, we continue to explore the personal fabrication strategy. In the last chapter we only considered the customer’s personalization of the product in the quality/vertical dimen-sion. However, in some product settings, personalization in the horizontal/taste dimension may be possible; in some settings, it could be the primary dimension of personalization. To handle such scenarios, in this essay, we consider a more general setting for studying personal fabrication allowing the customer to personalize the product in both the dimensions.
When a customer purchases a product’s design, she may personalize the product according to her taste preferences (by tweaking the design), in addition to selecting the desired quality level (quality customization studied in the first essay). Customizing the product’s design in the horizontal dimension is generally considered to be difficult for an end customer, as it requires knowledge of specialized software tools. However, these software tools are being made more easier and are becoming widely used. Firms selling product designs through personal fabrication strategy have also started assisting customers with horizontal personalization. Considering this scenario, we study personal fabrication in 2 dimensions, where customer personalizes the product in both the dimensions.
To model the 2 dimensional personalization enabled by personal fabrication, we propose a cylindrical modeling framework. In our model, the circular dimension of the cylinder represents customer’s horizontal (taste) preferences. The length dimension of the cylinder captures their quality sensitivity. With this model, we study the value of personal fabrication in different market structures and product line characteristics.
if there is uncertainty about the customers’ quality sensitivity. Personal fabrication strategy can be profitable even if customers face a cost disadvantage of production. When the market has stronger intensity for their taste (horizontal) preferences, PF strategy will be profitable under even higher cost disadvantage levels. However, if the firm already has a product line of more than one traditional products, value of adopting PF strategy decreases. We also show that our insights about the partial PF strategy (to mitigate IP/liability concerns) discussed in the first essay carry over to the generalized two dimensional model.
3.1 Literature Review
In our work, we extend the classical vertical differentiation (Tirole, 1988; Moorthy, 1988) and horizontal differentiation frameworks (Hotelling, 1990; Salop, 1979) by incorporating production delegation and personalization in both dimensions. Our work is related to the literature on mass customization(Mendelson and Parlakt¨urk, 2008a,b; Corbett and Karmarkar, 2001). Our work also contributes to customer co-creation/ co-production literature, as personal fabrication can be con-sidered as a de-coupled form of co-production. Roels et al. (2010) study collaborative service settings such as consulting or financial planning where the service provider and their customer work together.
There is a growing literature on the practitioner journals about the influence of 3D printing on supply chain: for example, Petrick and Simpson (2013) describes how 3D printing enables distributed manufacturing, by moving manufacturing closer to the customer. Various business models and the ecosystem that arise as part of the rapid growth in 3D printing are documented by academic researchers in their position papers(Piller et al., 2015; Weller et al., 2014). Using descriptive case research methods, the rise of personal fabrication in the recent years and the reasons for its rise have been documented by Mota (2011) and Rayna and Striukova (2016).
Figure 3.1: Cylindrical Market and Traditional Product Space
production to the customer.
3.2 Model: Personalization in Vertical and Horizontal Dimensions
In our model, customers are heterogeneous in two dimensions: in their willingness to pay for quality θ and their ideal taste feature X . We consider a market where customers’ willingness to pay for quality is either high type or low type: θ ∈ {θL, θH}. We consider the thickness of the
low type (θL) customers to be a, and the high type customers to be (1−a). Customers’ ideal
taste features (horizontal) X are distributed uniformly on a circle with unit circumference. θ and
X considered together lead to a cylindrical distribution of customers (market model) with a unit circumference Figure 3.1 a).
We consider two types of firms: traditional and personal fabrication (PF) firms. Atraditional firm designs and manufactures the product and therefore decides product positioning and pricept.
Product position is specified on a cylindrical surface: the product qualityqt determines the height
and the product feature positioning is determined at the circumference of the cylinder at heightqt.
the utility
Ut(qt, pt;θ) =θqt−tx−pt (3.1)
The term tx captures the mtisfit cost incurred by the customer for the deviation between her ideal taste feature and the feature position of the traditional product, where t captures the taste sensitivity of the market.
A PF firm only carries out product design and delegates the manufacturing responsibility to the customer. PF firm only decides the price of the productpp. A customer of typeθmay purchase
the product’s design from the PF firm for a price pp and manufacture the product after choosing
the quality levelqc∗(θ) that maximizes her utility. Pursuant to the vertical differentiation literature (e.g., Moorthy 1988, Heese and Swaminathan 2006, Netessine and Taylor 2007) the cost of quality
Cc(q) is convex and increasing in quality level q. Specifically, the customer’s manufacturing cost
is Cc(q) = q2. As the customer has access to the product’s design, she may also correct for any
misfit in the product from her ideal taste feature. Hence, the utility obtained by customerθ, when they buy a design from PF firm, personalize and manufacture the product is given by the following maximization problem:
Up(pp;θ) = max qc
(θqc−pp−qc2) (3.2)
Let the demand generated for a product sold by the traditional firm with quality level qt and
price pt, be Dt(pt, qt). Similarly, the demand generated for a product design from PF firm with
priceppis given byDp(pp). In our base model, customers and the firm have the same cost structure:
Cc(q) =Ct(q) =q2. We study the implications of the cost disadvantage for 3D printing in a leter
section. The traditional firm that chooses the quality qt and the price pt will make the following
profit:
Πt(qt, pt) = (pt−qt2)Dt(pt, qt) (3.3)
PF firm does not incur any marginal cost, as it is not producing the product. The PF firm that chooses the price pp will make the following profit:
In the following sections, we shall analyze the value of offering a PF product while considering a standard product as a benchmark.
3.3 Value of PF Strategy
We consider a niche product enjoying a monopoly market. To analyze the incremental value offered by the PF strategy, we first establish the benchmark result of offering a standard product. We then study how PF strategy could improve profitability compared to this benchmark.
Proposition 3.1. In a monopoly market, when the firm offers a standard product:
If t= 0, πmBM =
θ2 H
4 (1−a) if a≤1−
θ2 L θ2 H θ2 L 4 o/w
Ift >0,πmBM =
(−aθH+aθL+θH)4
32t if t≥
1 4 −3a
2θ2
H + 6a2θHθL−3a2θL2 + 2aθH2 −2aθHθL+θ2H
and 3θH−4θL
3θH−3θL ≤a
(1−a)θ4
H
32t if t≥
1 4 −3a
2θ2
H + 6a2θHθL−3a2θL2 + 2aθH2 −2aθHθL+θ2H
and 3θH−4θL
3θH−3θL > a
(1−a)(θ2
H−2t)
4 if t < 1 4 −3a
2θ2
H + 6a2θHθL−3a2θL2 + 2aθH2 −2aθHθL+θ2H
and 3θH−4θL
3θH−3θL > a
(a(θ2
L−2t)+2t)2
32at o/w
Proposition 3.1 shows the traditional firm’s profit in the two dimensional market space. The different conditions in the expression represent scenarios where the market is covered or not covered in the horizontal dimension for the low and high valuation segments.
Proposition 3.2. In a monopoly market, when the firm offers a PF product, they will make the
following profit: πm= θ2 H
4 (1−a) if a≤1−
θ2 L θ2 H θ2 L 4 o/w
This is because the customers who buy from the PF firm can completely personalize the design before getting it 3D printed - hence incur zero disutility for taste mismatch.
Corollary 3.1. When t= 0, πm =πmBM. When t >0, πm > πmBM and
∂(πm−πBMm ) ∂t >0.
Profitability improvement offered by the PF strategy is summarized by Corollary 3.1. One can note that the profitability improvement critically depends on the intensity of customer’s taste preferencest. When t= 0, we essentially have a market that only cares about the quality/vertical dimension. In that case our result is not surprising, as it is similar to what we discussed already in Chapter 2. However, if the market cares about taste mismatch t >0, then we can see that the PF strategy provides profitability improvement. More importantly, we see that the profit improvement increases when the customers intensity of taste preferences tincrease.
3.3.1 Effect of Demand Uncertainty
In the previous section, we saw that the profitability of PF strategy for a monopolist depends on customers’ intensity of preferences, when the firm can observe the thickness of high and low type customer segments. In this section, we ask the same of question of PF’s profitability when the firm cannot deterministically observe the size of customer segments (a). Specifically we consider a scenario where the firm has to make its quality decision without deterministically knowing the size of hight (low) type customer segment. Many firms face such a scenario in real life. We show the result and conduct the discussion for the case wheret= 0, as in this case, PF strategy did not improve profits in the deterministic case; we plan to contrast the new results from that. However, we later will discuss if and how this result will change whent >0.
We assume that the firm faces uncertainty of the following form about segment thickness:
other hand, pricing decision is more tactical, and often can be changed by firms more dynamically - hence, we assume that it is made after uncertainty resolution. Having established the benchmark traditional firm, we now study how a PF product can improve profitability. For the PF product, firm only needs to make the pricing decision. Similar to the traditional product, the firm makes the pricing decision after the uncertainty is resolved, as it is tactical.
Proposition 3.3. When a firm faces uncertainty about segment thickness (a∈ {a1, a2} : P r(a=
a1) =φandP r(a=a2) = (1−φ), wherea1 < a2), PF strategy is more profitable than a traditional product if and only if a1<1− θ
2
L θ2
H
anda2 >1− θ
2
L θ2
H
.
Under this uncertainty setting, PF firm (and its customers) has an advantage over the traditional firm as it does not have to make any decisions while facing the uncertainty. However, Proposition 3.3 states that the PF strategy will benefit from this scenario if and only if the uncertainty is large enough to impact the decision making of the traditional firm. From Proposition 3.1 and Proposition 3.3 and their proofs, we can see that the effective quality level received by the market under optimal firm decisions depends on a threshold segment thickness of a∗ = 1− θL2
θ2
H
. When the uncertainty is large enough, the two possible segment thicknesses — a1 and a2 — are on either side of the threshold, which implies that the traditional product will lose some profit in expectation because of uncertainty. Hence, the PF strategy can add value even when t = 0, as long as the firm faces a large enough uncertainty about segment thickness. When t >0, the intuition continues to hold. In this case, PF strategy benefits from both thee uncertainty (if it is large enough), and from the personalization in the horizontal dimension.
3.4 Cost Disadvantage of PF Strategy & Intellectual Property (IP) Concerns
3.4.1 Impact of Cost Disadvantage for PF strategy
In this section, we model the scenario where the customer’s production in PF strategy faces a cost disadvantage in comparison’s to traditional product’s production. Specifically customers’ cost of production =βq2, and the firm’s cost of production =q2, whereβ ≥1.
Proposition 3.4. PF strategy can be profitable even with a cost disadvantage factorβ ≥1, as long as β ≤β∗(t, θL, θH, a). Also,β∗(t, θL, θH, a) increases in t.
Proposition 3.4 shows that the cost disadvantage can be mitigated by the removal of horizontal disutility. We also can see that a larger cost disadvantage can be sustained when the market has higher intensity of taste preferences.
3.4.2 Partial PF to Mitigate IP Issues
To mitigate the impact of IP issues, firms may employ partial PF strategy: the firm will delegate the production of a proportion of the product d to the customer and manufacture the rest of the product ((1−d) proportion) themselves. In this way, the firm could keep the amount of product and in effect IP exposed to the customers. In this section, we explore the effectiveness of employing such a strategy. In this case, the PF firm customers’ utility function and the firm’s profit function changes to:
Up(pp;θ) = max qc
(θ(dqc+ (1−d)qp)−pp−(1−d)xt−dβqc2) (3.5)
Πp(pp) = (pp−(1−d)qp2)Dp(pp) (3.6)
For analyzing this case, we focus specifically on the parametric conditions, where at optimality, a traditional product will attract both low and high segment customers and will not cover either of the segments. This condition translates to the following condition (as shown in Proposition 3.1):
t ≥ 14 −3a2θH2 + 6a2θHθL−3a2θL2 + 2aθH2 −2aθHθL+θ2H
and 3θH−4θL
3θH−3θL ≤ a. The qualitative
insights we present here holds on other parametric conditions as well.
we need: d > d#(θL, θH, a, β).
First takeaway from Proposition 3.5 is that it is optimal to either delegate the whole product to the customer or not delegate at all (act as a standard product). However, this result assumes that the firm does not have any IP related restrictions (which are not explicitly modeled here). When they do have IP restrictions, they may be wiling to delegate only a smaller proportion of the product that they deem to be of lesser/manageable IP risk. In this context, it is critical to understand ifd∈(0,1) can be beneficial to the firm (i.e., lead to better profit than the traditional product). We find that PF strategy can be profitable ford∈(0,1), if there is no cost disadvantage for PF. If there is some cost disadvantage, then the delegation level must be higher than a critical threshold delegation.
3.5 Conclusions
In this essay, we show how the adoption of personal fabrication can be increased significantly if the customers’ ability to personalize the product in the horizontal dimension is improved. Horizontal personalization involves tweaking of the product design, which is considered more difficult for end customers, as it needs some knowledge of special CAD tools (Schmidt and Ratto, 2013). However, there are rapid improvements currently as more and more product design tools aimed at the end customer are being released. Moreover, many designers who sell their product through personal fabrication strategy are offering design customization web tools to enable personalization by end customers. Our work in this chapter highlights the value of enabling horizontal personalization.
CHAPTER 4: Delegating Production to the Retail Stores: Influence of Channel Structure and Buzz Effect on In-store 3D Printing
In this essay, we focus on using 3D printing technology effectively at a retail location to offer customized products on demand. 3D printing enables manufacturing to be moved to retail stores near customers. In a recent survey of European retail leaders commissioned by Ricoh Europe, 68% of those surveyed plan on investing in 3D printing technologies within the next two years. Many firms in the consumer goods industry are exploring the possibility of 3D printing at the retail stores. For example,Adidas has unveiled a new concept productFuturecraft 3D, where the insole of the shoe will be 3D printed in-store meeting the exact customer specifications (Strange, 2015). Ministry of Supply — an apparel company — lets customers customize the design and color of the garment, and 3D prints the garment in 90 minutes using an in-store 3D printer (Kestenbaum, 2017). European fashion retail chainEramprints personalized shoes in store (Roberson, 2017). The trend is present in the chocolate and food industry as well: for example, Hershey is personalizing chocolate designs and prints for their customers in its headquarters (Porter, 2015).
Retail location 3D printing benefits the supply chain by providing better product customization. It also creates a buzz effect and increases the overall store demand, leading to positive externalities for the firms’ standard product line (Trinh, 2017; Vitone, 2016). While offering fit and/or buzz related benefits to the firm, retail 3D printing poses many challenges as well. As the manufacturing of the product now happens at the store, customer wait times need to be carefully managed. 3D printers are lumpy capacity investments to be incurred by the supply chain. The manufacturer needs to decide how much of the product should be manufactured at the retail location and how much of it should be pre-made. The retailer needs to decide the amount of investment they make in a 3D printer.