MOLECULAR AND BIOLOGICAL MECHANISMS OF THE
ARAP1 TYPE 2 DIABETES LOCUS
Jennifer Renée Kulzer
A dissertation submitted to the faculty at the University of North Carolina at Chapel Hill in partial fulfillment of the requirements for the degree of Doctor of Philosophy in the Curriculum
in Genetics and Molecular Biology in the School of Medicine.
Chapel Hill 2014
Approved by:
Karen L. Mohlke
Patrick J. Brennwald
Hans E. Hohmeier
© 2014
ABSTRACT
Jennifer Renée Kulzer: Molecular and Biological Mechanisms of the ARAP1 Type 2 Diabetes Locus
(Under the direction of Karen L. Mohlke)
Genome-wide association studies (GWASs) have identified more than 70 loci associated
with type 2 diabetes (T2D), but for most, the underlying causal variants, associated genes, and
functional mechanisms remain unknown. At a T2D- and fasting-proinsulin-associated locus on
11q13.4, we have identified a functional regulatory DNA variant, a candidate target gene, and
plausible underlying molecular and biological mechanisms. We confirmed the existence of a
single major association signal between fasting proinsulin and noncoding variants
(p = 7.4 × 10-50). Measurement of allele-specific mRNA levels in human pancreatic islet
samples heterozygous for rs11603334 showed that the T2D-risk increasing and
proinsulin-decreasing allele (C) is associated with increased ARAP1 expression (p < 0.02). By performing
transcriptional reporter assays in rodent pancreatic beta cell lines, we determined that the C allele
of rs11603334, located at the ARAP1 P1 promoter, exhibits 2-fold higher transcriptional activity
than T allele (p < 0.0001). Electrophoretic mobility shift assays demonstrated decreased binding
of pancreatic beta cell transcriptional regulator PAX6 to the rs11603334 C allele. Collectively,
these data suggest that the T2D-risk allele of rs11603334 could abrogate binding of a complex
containing PAX6 and thus lead to increased P1 promoter activity and ARAP1 expression in
human pancreatic islets. We went on to determine that the ARAP1 protein isoform
human islets, and that adenoviral overexpression of this ARAP1 isoform in intact human islets
led to decreased levels of glucose-stimulated proinsulin secretion (p = 0.02). Using G-LISA
GTPase activity assays, we also determined that, through the activity of its ARF-GAP domain,
increased ARAP1 expression in human islets decreases the levels of ARF6-GTP (p = 0.02), a
known regulator of glucose-stimulated insulin secretion in the beta cell. We also showed that
ARAP1 and ARF6 partially colocalize in the cytoplasm of dispersed human beta cells.
Altogether, this body of evidence demonstrates a connected set of molecular and biological
ACKNOWLEDGEMENTS
There are so many people I would like to thank for supporting me over the course of my
Ph.D. First, I would like to thank Karen Mohlke. She is an inspiring scientist and a brilliant
writer who has contributed greatly to my scientific development and to the enhancement of my
own writing; I am fortunate to have been one of her students. I would also like to thank my
committee, Patrick Brennwald, Hans Hohmeier, Praveen Sethupathy, and previous member Mara
Duncan, for their insightful contributions, key advice, and wonderful mentorship.
My great appreciation also goes to all of the enthusiastic, hard-working members of the
Mohlke Laboratory, past and present. Special thanks to Tamara Roman, Marie Fogarty, Rani
Vadlamudi, Maren Cannon, and Jim Davis for all of the theoretical, practical, and technical
advice shared during Monday afternoon small group meetings; to Martin Buchkovich, Damien
Croteau-Chonka, and Ying Wu for hours of computational and statistical consultation; and to
everyone for their kind friendship and buoyant support.
I would like to extend my deep gratitude to all of our many talented scientific
collaborators and colleagues around the world who have allowed me the privilege of working
alongside them, especially: Rama Arumugam, Michael Boehnke, Francis Collins, Michael
Erdos, Christian Fuchsberger, Jeroen Huyghe, Anne Jackson, Johanna Kuusisto, Markku Laakso,
Ethan Lange, Leslie Lange, Yun Li, Mario Morken, Peter Schwarz, Michael Stitzel, Richard
I would also like to sincerely thank the National Institutes of Health for funding our
research, the Integrated Islet Distribution Program and the National Disease Research
Interchange for their valuable services, and most especially the human organ donors, without
whom this research would not have been possible.
For their invaluable friendship, unmatched scientific enthusiasm, and warm support of
both my scientific and personal development, I am forever thankful to Kathy Wojcik and Dallas
Donohoe. For their encouraging mentorship early in my scientific career, I will also always be
thankful to David Winkler, Megan Spence, and Adrian Hanley.
For their unwavering support and love throughout this process, for extending me their
courage, advice, and understanding, and for frequently adding important perspective, I am
forever indebted to my very dear family, Gary, Laura, Sheila, Cheryl, Kimberly, Richard, Hazel,
Ruth, Bill, Dan, Lori, Chrissy, Travis, Gabi, Danny, Jessica, Danny IV, Ellis, Beth, Eric, Steve,
Jhaki, Kathy, all of the Kulzers, Downings, and Tynans, and to all of our many incredible friends
across the U.S., who I am proud to know, love, and consider additional members of my family.
More than anyone, I would like to thank my husband and best friend, Matthew Tynan.
Thank you, Matt, for supporting my passion and creativity, for many hours of helpful discussion
and review, for asking great questions and adding insight, for your enthusiastic company at lab
on many late nights and weekends, for helping to keep my light shining (both figuratively and
TABLE OF CONTENTS
LIST OF TABLES ... x
LIST OF FIGURES ... xi
LIST OF ABBREVIATIONS ... xiii
CHAPTER 1: INTRODUCTION ... 1
Overview of Type 2 Diabetes and Insulin ... 1
Genetics of T2D ... 3
Multiple Trait Associations at the ARAP1 Locus ... 4
Genes at the ARAP1 Locus ... 6
ARAP1 Protein Structure, Function, and Substrates ... 7
CHAPTER 2: A COMMON FUNCTIONAL REGULATORY VARIANT AT A TYPE 2 DIABETES LOCUS UPREGULATES ARAP1 EXPRESSION IN THE PANCREATIC BETA CELL ... 11
Introduction ... 11
Materials and Methods ... 13
Study Population and Phenotypes ... 13
Genotyping ... 13
Imputation and Reference Panel ... 14
Fine-Mapping and Conditional Analysis ... 14
Allelic Expression Imbalance (AEI) ... 15
Cell Culture... 17
Dual-Luciferase Transcriptional Reporter Assay ... 17
Electrophoretic Mobility Shift Assay (EMSA) and Transcription Factor Prediction ... 18
Results ... 20
Fine-Mapping of the 11q13.4 Locus Associated with Fasting Proinsulin and T2D ... 20
The Proinsulin-Decreasing and T2D-Risk Alleles are Associated with Increased ARAP1 mRNA Levels in Primary Human Pancreatic Islets ... 22
Candidate Regulatory Variants at the ARAP1 Promoters ... 24
The rs11603334 T2D-Risk and Proinsulin-Decreasing Allele Increases Transcriptional Reporter Activity in Rodent Pancreatic Beta Cell Lines ... 25
Decreased in vitro Binding of Pax6 and Pax4 to the rs11603334 T2D-Risk and Proinsulin-Decreasing Allele (C) ... 28
Discussion ... 29
Supplemental Figures and Tables ... 35
CHAPTER 3: ARAP1 REGULATES GLUCOSE-STIMULATED PROINSULIN SECRETION AND ARF6 GTPASE ACTIVITY IN HUMAN PANCREATIC ISLETS... 51
Introduction ... 51
Materials and Methods ... 53
Human Islets and Cell Culture ... 53
Determination of Endogenous ARAP1 Isoforms ... 54
Adenoviral Vector Preparation ... 55
Adenoviral Vector Transduction ... 56
Glucose-Stimulated Secretion of Insulins ... 57
GTPase Activity Assays ... 58
Immunofluorescence ... 59
Endogenous Expression of ARAP1 Isoforms in Primary Human Islets ... 61
ARAP1 Overexpression Decreases Glucose-Stimulated Proinsulin Secretion in Human Islets ... 63
ARAP1 Regulates Glucose-Stimulated ARF6 GTPase Activity through its ARF-GAP Domain ... 65
Discussion ... 68
Supplemental Figures ... 72
CHAPTER 4: DISCUSSION ... 74
LIST OF TABLES
TABLE 1. THE INDEX SNPS AT THE ARAP1 LOCUS ARE ASSOCIATED WITH
MULTIPLE GLYCEMIC TRAITS ... 5
TABLE 2. TRANSCRIBED SNPS USED TO EVALUATE ALLELIC EXPRESSION
IMBALANCE FOR ARAP1, STARD10, PDE2A, AND FCHSD2 ... 24
TABLE 3. PRIMERS USED TO EVALUATE ALLELIC EXPRESSION
IMBALANCE (AEI) ... 42
TABLE 4. PRIMERS USED TO GENERATE CLONES FOR TRANSCRIPTIONAL
REPORTER ASSAYS ... 43
TABLE 5. SEQUENCES USED TO GENERATE DOUBLE-STRANDED OLIGOS
FOR ELECTROPHORETIC MOBILITY SHIFT ASSAY (EMSA) ... 44
TABLE 6. SNP ASSOCIATION WITH FASTING PROINSULIN AND TYPE 2
DIABETES IN THE METSIM STUDY ... 45
TABLE 7. TWENTY VARIANTS IN STRONG LINKAGE DISEQUILIBRIUM
LIST OF FIGURES
FIGURE 1. VARIANTS ASSOCIATED WITH PROINSULIN IN THE METSIM
STUDY ... 21
FIGURE 2. THE T2D-RISK ALLELES OF RS11603334 AND RS1552224 ARE
ASSOCIATED WITH INCREASED ARAP1 EXPRESSION ... 23
FIGURE 3. SNPS RS11603334 AND RS1552224 ARE LOCATED IN A REGION
WITH EVIDENCE OF REGULATORY POTENTIAL AT THE ARAP1 P1
PROMOTER AT 72.11 MB ... 25
FIGURE 4. THE T2D-RISK ALLELE, C, OF RS11603334 INCREASES
TRANSCRIPTIONAL ACTIVITY OF THE ARAP1 P1 PROMOTER ... 27
FIGURE 5. THE T2D-RISK ALLELE, C, OF RS11603334 DISRUPTS BINDING
OF TRANSCRIPTIONAL REGULATORS PAX6 AND PAX4 ... 29
FIGURE 6. PROPOSED MODEL FOR PAX6 AND PAX4 REPRESSION OF
TRANSCRIPTIONAL ACTIVITY AT ARAP1 ... 32
FIGURE 7. LINKAGE DISEQUILIBRIUM NEAR PDE2A, ARAP1/CENTD2,
STARD10, ATG16L2, AND FCHSD2 ... 35
FIGURE 8. ALL VARIANTS ASSOCIATED WITH FASTING PROINSULIN IN
THE METSIM STUDY... 36
FIGURE 9. VARIANTS ASSOCIATED WITH T2D IN THE METSIM STUDY ... 37
FIGURE 10. ALLELIC EXPRESSION ANALYSES FOR ARAP1, STARD10 AND
PDE2A IN HUMAN PANCREATIC ISLET GDNA AND CDNA ... 38
FIGURE 11. VARIANTS WITH REGULATORY POTENTIAL NEAR THE
ARAP1 P2 PROMOTER ... 39
FIGURE 12. ARAP1 VARIANTS THAT DID NOT SHOW ALLELIC
DIFFERENCES IN TRANSCRIPTIONAL ACTIVITY ... 40
FIGURE 13. EMSAS IDENTIFY ADDITIONAL PROTEINS BOUND TO
RS11603334 ... 41
FIGURE 14. ENDOGENOUS ARAP1 ISOFORM EXPRESSION ACROSS
FIGURE 15. ENDOGENOUS LEVELS OF ARAP1 EXPRESSION IN HUMAN
ISLET SAMPLES ... 62
FIGURE 16. PROINSULIN AND INSULIN SECRETION UPON ARAP1
OVEREXPRESSION IN INTACT HUMAN ISLETS ... 64
FIGURE 17. EFFECTS OF ARAP1 OVEREXPRESSION ON GTP-BOUND
LEVELS OF SEVERAL SMALL GTPASES UPON GLUCOSE TREATMENT
IN MIN6 ... 66
FIGURE 18. ARAP1 REGULATES ARF6 ACTIVITY IN HUMAN ISLETS
THROUGH ITS ARF-GAP DOMAIN ... 67
FIGURE 19. ARAP1 AND ARF6 PARTIALLY COLOCALIZE IN THE
CYTOPLASM IN HUMAN BETA CELLS ... 68
FIGURE 20. GLUCOSE-STIMULATED PROINSULIN SECRETION IN ISLETS
TRANSDUCED WITH ARAP1-EXPRESSING ADENOVIRAL VECTORS ... 72
FIGURE 21. GLUCOSE-STIMULATED PROINSULIN AND INSULIN SECRETION IN DISPERSED PRIMARY HUMAN ISLET CELLS TRANSDUCED WITH
WILD TYPE AND MUTANT ARAP1 ... 73
FIGURE 22. PROPOSED MODEL FOR ARAP1 REGULATION OF INSULIN
LIST OF ABBREVIATIONS
AEI allelic expression imbalance
ANOVA analysis of variance
ARAP1 ARF-GAP with RHO-GAP domain, ankyrin repeat and PH domain 1
ARF ADP-ribosylation factor
BMI body mass index
cDNA complementary DNA
CENTD2 centaurin delta 2; another gene symbol for ARAP1
CEU Caucasian ancestry
ChIP chromatin immunoprecipitation
Chr chromosome
CMRL Connaught Medical Research Laboratories medium
CMV cytomegalovirus promoter
DMEM Dulbecco’s Modified Eagle Medium
EGF epidermal growth factor
EGFP enhanced green fluorescent protein
ELISA enzyme-linked immunosorbent assay
EMSA electrophoretic mobility shift assay
ENCODE Encyclopedia of DNA Elements
eQTL expression quantitative trait locus
EUR European ancestry
FBS fetal bovine serum
FUSION Finland-United States Investigation of NIDDM Genetics
GAP GTPase activating protein
gDNA genomic DNA
GDP guanosine diphosphate
GLUT4 glucose transporter 4
GoT2D Genetics of Type 2 Diabetes
GTP guanosine triphosphate
GWAS genome-wide association study
H3K4me1 histone H3 lysine 4 monomethylation
H3K4me3 histone H3 lysine 4 trimethylation
H3K9ac histone H3 lysine 9 acetylation
HRP horseradish peroxidase
HWE Hardy-Weinburg equilibrium
ICR/IIDP Islet Cell Resource/Integrated Islet Distribution Program
LD linkage disequilibrium
MAC minor allele count
MAF minor allele frequency
MALDI-TOF matrix-assisted laser desorption/ionization-time of flight
METSIM Metabolic Syndrome in Men
mRNA messenger RNA
NDRI National Disease Research Interchange
OGTT oral glucose tolerance test
P1 ARAP1 promoter at 72.11 Mb (hg18) on chromosome 11
P2 ARAP1 promoter at 72.14 Mb (hg18) on chromosome 11
PA phosphatidic acid
PBS phosphate-buffered saline
PCR polymerase chain reaction
PFA paraformaldehyde
PFU plaque-forming units
PH pleckstrin homology domain
PI phosphoinositides
PVDF polyvinylidene difluoride
RA Ras-associating domain
RefSeq National Center for Biotechnology Information Reference Sequence
RHO Ras homolog
RPMI Roswell Park Memorial Institute medium
SAM sterile alpha motif domain
SD standard deviation
SNP single nucleotide polymorphism
T2D type 2 diabetes
TBS tris-buffered saline
TSS transcription start site
UCSC University of California Santa Cruz
CHAPTER 1: INTRODUCTION
Genome-wide association studies (GWAS) have identified over 70 genomic locations, or
loci, associated with type 2 diabetes (T2D), but for most of these loci, the underlying functional
mechanisms remain unknown. Naturally occurring human genetic variants at a T2D GWAS
locus on chromosome 11 containing ARAP1, PDE2A, STARD10, ATG16L2, and FCHSD2 is
associated with T2D risk (p = 1.4 x 10⁻²²) and decreased proinsulin levels (p = 3.2 x 10-102).1,2 At
this ‘ARAP1’ locus, robust statistical association of twenty frequently co-inherited single
nucleotide polymorphism (SNP) variants with T2D, proinsulin, and several additional glycemic
traits have been reported in independent populations,1–4 providing high confidence that there
exist unknown underlying biological explanations worthy of exploration. The aims of my
research were to identify the functional variant(s) and gene(s) at the ARAP1 locus and determine how the gene(s) play a role in proinsulin secretion, the most strongly associated trait, from pancreatic
islets. Determining the molecular and biological mechanisms underlying high-confidence GWAS
loci like ARAP1 will uncover new biological pathways involved in diabetes, improve our
understanding of the disease, and may lead to the discovery of novel therapeutic targets.
Overview of Type 2 Diabetes (T2D) and Insulin
Diabetes is a severe and expensive disease, affecting 11.3% of Americans age 20 years or
medical expenses. The overwhelming majority (90-95%) of those with diabetes have T2D.
T2D develops when glucose levels in the bloodstream are chronically elevated due to
insufficient regulation by insulin. Insulin is a peptide hormone that is secreted from pancreatic beta
cells in response to increased levels of glucose and other nutrients present in the circulation after
eating. Insulin’s precursor protein, proinsulin, is translated in the rough endoplasmic reticulum and
transported to the Golgi apparatus for modifications and sorting. In the trans-Golgi, proinsulin is
packaged into granules, where it is converted to mature insulin.6,7 There, enzymes cleave each
proinsulin molecule to produce one molecule each of insulin and C-peptide. Upon exposure of the
beta cell to glucose, the mature insulin-containing granules fuse with the plasma membrane and
exocytose their contents. This is called the regulated release pathway, accounting for greater than
99% of the insulin and proinsulin secreted from beta cells.8 Insulin signals many bodily tissues, such
as liver, muscle, and adipose, to clear the glucose from the blood and use some of it for immediate
energy while storing the rest as glycogen and fat for later use. In individuals with T2D, this process
is defective due to 1) inefficient insulin signaling in liver, muscle, and adipose, commonly referred to
as “insulin resistance,” and 2) inadequate insulin secretion by the pancreas.
Insulin resistance can develop slowly and be present for many years before glucose levels
rise and diabetes develops. During this time, the pancreas produces more insulin to compensate for
insulin resistance in an attempt to maintain glucose homeostasis. For many with insulin resistance,
the pancreas does this quite successfully and diabetes never develops. However, for some with
insulin resistance, the pancreatic beta cells progressively lose their ability to secrete enough insulin,
leading to a rise in blood glucose levels (hyperglycemia). Since chronically elevated blood glucose
the declining ability of beta cells to secrete adequate amounts of insulin often marks the onset of
disease.
Poorly managed diabetes results in chronic hyperglycemia, which is damaging to blood
vessels and nerves and can lead to complications in several highly vascularized organs. Diabetes is
the primary cause of adult blindness, kidney failure, and leg and foot amputations not resulting from
trauma.5 It is also a major cause of painful peripheral neuropathies and male impotence.
Macrovascular complications include 2-4 fold increased risk5 of heart disease death and stroke.
Simply having diabetes, without any prior evidence of coronary heart disease (i.e., myocardial
infarction, angina, abnormal electrocardiogram changes indicating ischemia), increases risk of death
from a coronary event to the same extent as the risk faced by non-diabetics who have already shown
signs of coronary heart disease.9
The intricate biological mechanisms causing insulin resistance and impaired insulin secretion
are still not well understood, despite several decades of research. However, recent major advances in
the field of genetics, including mapping of the human genome and discovering the extent of human
genetic variation through deep-sequencing, provide an exceptional opportunity to pose new questions
about the nature of genetic contribution to diabetes risk. Research thoroughly examining the
biological reasons why some individuals are more likely to develop T2D than others will illuminate
novel pathways to explore for potential medical interventions and cures.
Genetics of T2D
T2D is a complex trait: its inheritance is influenced by both the environment and the
contributions of many genes, each exerting a small individual effect. Obesity is well known to be a
obese.10 Even so, many who are overweight or obese do not become diabetic, and many others
develop T2D even though they are lean. This can be partly explained by the strong genetic
component of T2D. Population studies in the U.S.11 and Finland12 reported proband concordance in
monozygotic twins to be 29-58% and 34%, respectively, and concordance increases with age. In
dizygotic twins, proband concordance was 14-17% and 16%, compared to population prevalences of
5.7% and 3.3%, respectively.
T2D is variably penetrant and has high genetic heterogeneity; many individual genetic loci
associated with T2D have low penetrance and small effect sizes. Although the disease symptoms
manifest as one common disorder, the inheritance pattern does not fit a simple Mendelian model.
However, on a molecular level, individual T2D-associated variants may act additively, such that risk
for disease rises with each additional risk allele one carries.
To systematically identify genetic loci associated with T2D risk, human geneticists have
performed genome-wide association studies.1,13–15 GWAS is a powerful, unbiased, population-based
method that usually uses additive modeling of common variants to discover novel loci statistically
associated with a trait. To date, over 70 loci associated with T2D have been identified through
GWAS; the first 50 identified were estimated to explain about 10% of the inheritance.1 For many of
the loci, the underlying variant(s) and gene(s) contributing to T2D risk remain unknown.
Multiple Trait Associations at the ARAP1 Locus
The ARAP1 locus is robustly associated with T2D (p = 1.4 x 10⁻²²)1 and has the strongest
association with fasting proinsulin of all loci across the genome (p = 3.2 x 10-102).2 The most strongly
associated ‘index’ SNPs are the same for both traits, implying that a shared set of functional
located 113 bp apart within the 5’ untranslated region (UTR) of the short RefSeq (Reference
Sequence) isoform of ARAP1 (ARAP1∆SAM). These SNPs are always inherited together; they are in perfect linkage disequilibrium (LD; r2=1, European ancestry (EUR) population, 1000 Genomes Phase
1). All other SNPs inherited in a similar pattern (r2 > 0.8) with rs1552224 and rs11603334 are
non-coding. The six genes closest to the association signal are ARAP1, STARD10, PDE2A, ATG16L2,
FCHSD2, and mir-139.
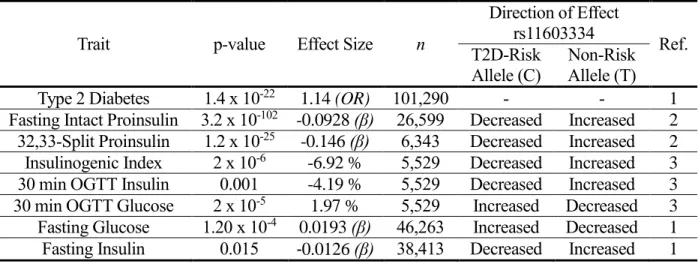
The index SNPs are also associated with additional glycemic traits (Table 1), including
partially processed (‘split’) proinsulin, measures of insulin secretion such as the insulinogenic index,
and insulin 30 min into an oral glucose tolerance test (OGTT). Evidence of associations with several
traits more clearly linked to insulin secretion than to insulin resistance suggests that the ARAP1 locus
may influence T2D risk by altering pancreatic beta cell function.
Notably, the T2D-risk increasing alleles for the index SNPs are the major alleles (rs11603334, C,
minor allele frequency (MAF) = .13, CEU). According to the Hardy-Weinberg formula, 76% of
Caucasians (CEU) are predicted to be homozygous for the risk increasing allele, 23% are
T2D-Table 1. The Index SNPs at the ARAP1 Locus Are Associated with Multiple Glycemic Traits
Trait p-value Effect Size n
Direction of Effect
rs11603334 Ref.
T2D-Risk Allele (C)
Non-Risk Allele (T)
Type 2 Diabetes 1.4 x 10⁻²²
1.14 (OR) 101,290 - - 1
Fasting Intact Proinsulin 3.2 x 10-102 -0.0928 (β) 26,599 Decreased Increased 2
32,33-Split Proinsulin 1.2 x 10⁻²⁵ -0.146 (β) 6,343 Decreased Increased 2
Insulinogenic Index 2 x 10⁻⁶ -6.92 % 5,529 Decreased Increased 3
30 min OGTT Insulin 0.001 -4.19 % 5,529 Decreased Increased 3
30 min OGTT Glucose 2 x 10⁻⁵ 1.97 % 5,529 Increased Decreased 3
Fasting Glucose 1.20 x 10⁻⁴ 0.0193 (β) 46,263 Increased Decreased 1
risk allele carriers, and only 2% are homozygous for the non-risk allele. From the opposite
perspective, individuals homozygous for the non-risk allele may also be considered to be “protected”
from the increased risk of T2D conferred by rs11603334 C allele carrier status that is inherited in
98% of Caucasians.
Genes at the ARAP1 Locus
ARAP1, STARD10, PDE2A, ATG16L2, and FCHSD2 are all expressed in human pancreas,
islets, and flow-sorted beta cells.1,2,16,17 None of these genes can be clearly implicated in T2D based
on what has been reported in the literature to date, so observations linking any of these genes to T2D
biology will be novel. ARAP1 (ARF-GAP with RHO-GAP domain, ankyrin repeat and PH
domain 1) is a GTPase activating protein (GAP) that activates ADP-ribosylation factor (ARF) and
Ras homolog (RHO) family GTPases, which regulate Golgi transport, membrane trafficking, and
actin cytoskeleton dynamics.18 STARD10binds and transfers phospholipids between membranes.19
PDE2A is a cyclic nucleotide phosphodiesterase which degrades second messengers cGMP and
cAMP.20 ATG16L2 shares sequence homology with ATG16, which is required for autophagy in
yeast.21 FCHSD2 is named after its FCH and SH3 protein domains, and stimulates F-actin assembly
in vitro.22,23 Mir-139 downregulates FOXO1 in mouse neonatal hepatocytes.24
Although rs1552224 has been reported previously as an expression quantitative trait locus
(eQTL) for STARD10 expression in blood (p = 8.6 x 10⁻⁷),1 liver (p = 1.79 x 10⁻⁵) and omental
adipose tissue (p = 1.21 x 10⁻⁶),25 the importance of these associations to T2D is unclear. The top
SNP (rs519790, p =2.7 x 10⁻²⁴) associated with STARD10 expression in blood is in low LD
(r2 = 0.04) with rs1552224, indicating that the association signals representing T2D risk and
ARAP1 Protein Structure, Function, and Substrates
ARAP1 may be the strongest candidate gene because the index SNPs lie within one of its
alternative 5’UTRs, which is used by two out of three RefSeq isoforms. Sequence homology
predicts all three RefSeq protein isoforms of ARAP1 (NP_056057, NP_001128662, and
NP_001035207) to contain one ARF-GAP domain, one RHO-GAP domain, one Ras-association
(RA) domain, and five pleckstrin homology (PH) domains.26–29 GAP domains catalyze the
guanosine triphosphate (GTP) hydrolysis activity of small GTPases. GTP-bound forms of GTPases
such as ARF and RHO are considered to be active because they bind to effectors, while guanosine
diphosphate (GDP)-bound forms are mostly inactive. ARF and RHO GTPases help regulate a
variety of cellular processes, including vesicle trafficking and actin cytoskeleton reorganization. RA
domains bind GTPases. PH domains can bind phosphoinositides (PI) in lipid membranes, and they
can also interact with GTP-bound small GTPases.30 Alternatively spliced out exons in the ARF-GAP
domain and in the C-terminal PH domain of ARAP1 RefSeq isoform NP_001128662 create
differences in these domains.
The longest isoform of ARAP1, NP_001035207, which does not contain the index SNPs, has
an additional sterile alpha motif (SAM) domain at its alternative 5’ end, as do homologs ARAP2 and
ARAP3. SAM domains interact with other proteins to facilitate many biological functions.31 In
contrast to the shorter isoform (ARAP1∆SAM), the long isoform of ARAP1 does not catalyze
ARF6-GTP hydrolysis, suggesting that the SAM domain may function as a negative regulator.32
ARAP2 additionally differs from the long isoform of ARAP1 and from ARAP3 in that it contains an
The ARAPs are the only known mammalian proteins containing both ARF-GAP and RHO-GAP
domains.
Though ARAP1 messenger RNA (mRNA) is expressed ubiquitously, ARAP1 protein
expression and localization may be more variable.16–18 Endogenous ARAP1 protein localizes near
the Golgi in resting HeLa cells18,34 and relocates to the cytoplasm and at the plasma membrane in
spreading HeLa cells and NIH3T3 mouse fibroblasts.18 A detailed study in Hela cells demonstrates
that endogenous ARAP1 is positioned at the trans Golgi and with recycling endosomes,
multivesicular bodies, and lysosomes.35 Overexpressed ARAP1 is present throughout the cytoplasm
in HeLa32,35 and NCTC immortalized human keratinocytes.36 Upon cell stimulation with either
epidermal growth factor (EGF)34 or TNF-related apoptosis inducing ligand36, endogenous and/or
overexpressed ARAP1 relocates to foci along the plasma membrane containing the corresponding
receptors. The PH domains also play an important role in ARAP1’s cellular localization. Each PH
domain has varying binding affinities to phosphorylated PIin vitro. Treatment of NRK cells with
PI-3 kinase inhibitors shifts ARAP1’s cellular distribution towards the Golgi, while PI-4 kinase
inhibitors shift ARAP1’s cellular distribution towards the endosomal compartment.35
ARAP1 plays a role in cytoskeletal reorganization18 and in the endocytosis and trafficking of
certain receptors. Conflicting reports suggest that overexpression35 and/or knockdown34 of ARAP1
in HeLa cells leads to increased association of EGF and EGF receptor with early endosomes,
increased EGF receptor degradation and reduced activation of the downstream Erk pathway. ARAP1
catalyzes GTP hydrolysis for ARF GTP-binding proteins ARF1, ARF5, and ARF6 in vitro18 and for
ARF6 but not ARF1 in BHK cells.32 In vitro and in BHK cells, a R338K substitution in the
ARF-GAP domain substantially decreases hydrolysis of GTP-bound ARF1 and ARF6, respectively.
is dependent on the presence of phosphorylated PI; PI 3,4,5 triphosphate (PI(3,4,5)P3) is most
stimulatory, followed by PI(3,4)P2. ARAP1 also catalyzes in vitro GTP hydrolysis for RHO
GTPases RHOA and CDC42, while a R753K substitution in ARAP1’s RHO-GAP domain decreases
CDC42 GTPase activity.18 Over-expressed ARAP1 catalyzes CDC42 GTPase activity in 293T
cells.18
ARAP1 has been demonstrated to regulate GTP hydrolysis in vitro for at least five
GTP-binding proteins: ARF1, ARF5, ARF6, CDC42, and RHOA.18 The literature suggests plausible
biological roles in insulin secretion for four of these. ARF1 might be involved early in the process of
secretion as it is known to regulate transport between the endoplasmic reticulum and Golgi by
recruiting coat proteins that allow vesicle budding when bound to GTP.37 ARF5 associates with the
Golgi apparatus38 and may be involved in regulated secretion. ARF5-GDP binds to
calcium-dependent activator protein for secretion 1 (CAPS1), a protein involved in secretion of dense core
vesicles, in mouse cerebellum lysates.39 This interaction is required for proper KCl-stimulated
release of a secretory protein called chromogranin A from the PC12 rat adrenal medulla cell line.39
ARF6 localizes to the plasma membrane and is well known to regulate both clathrin-dependent and
independent endocytosis as well as membrane recycling, and may play a role in regulated secretion
for certain cell types.37,38 ARF6 is activated upon glucose stimulation in 832/13 cells, and cells
expressing a dominant negative ARF6 mutant show reduced glucose-stimulated insulin secretion.40
MIN6 cells expressing the same ARF6 mutant have reduced glucose- and K+-stimulated insulin
secretion.41 CDC42 is important for glucose-stimulated insulin secretion in MIN6 cells and for the
second phase of insulin secretion in mouse islets.42 Both ARF6 and CDC42 become activated within
transporter 4 (GLUT4) translocation to the plasma membrane of 3T3-L1 mouse adipocytes.43
RHOA regulates actin polymerization;44 however, a potential role for it in insulin secretion is unclear.
In this dissertation, I investigate and describe functional molecular and biological
mechanisms that may underlie the genome-wide association of the 11q13.4 ARAP1 locus with
proinsulin levels and T2D. In Chapter 2, I identify a plausible functional regulatory variant,
rs11603334, and demonstrate its allelic effects on expression of a specific isoform of ARAP1. In
Chapter 3, I characterize localization and isoform expression of ARAP1 protein in the human
pancreatic islet, demonstrate that the ARAP1 isoform implicated in Chapter 2 can regulate
glucose-stimulated islet secretion of proinsulin, and show that this ARAP1 isoform regulates ARF6-GTP
levels in an ARF-GAP domain-dependent manner. Finally, in Chapter 4, I discuss the implications of
CHAPTER 2: A COMMON FUNCTIONAL REGULATORY VARIANT AT A TYPE 2 DIABETES LOCUS UPREGULATES ARAP1 EXPRESSION IN THE PANCREATIC
BETA CELLi,ii
Introduction
Genome-wide association studies have identified more than 70 loci associated with type 2
diabetes [MIM 125853]1,45–52 and 10 loci associated with fasting proinsulin levels.2,53 A locus at
11q13.4 near ARAP1 [MIM 606646], PDE2A [MIM 602658], STARD10, ATG16L2, and
FCHSD2 is strongly associated with T2D (rs1552224, p = 1.4 10-22),1 fasting proinsulin
(rs11603334, p = 3.2 10-102),2 and 32,33-split proinsulin (rs11603334, p = 1.2 10-25).2 This locus
is also nominally associated with insulinogenic index (rs1552224, p = 2 10-6) and both insulin
(p = 0.001) and glucose (p = 2 10-5) levels at 30 minutes during an oral glucose tolerance test.3 The
clustering of multiple phenotypic associations related to proinsulin processing and insulin secretory
response during an oral glucose challenge suggests that the affected target gene(s) may play a role in
pancreatic beta cell function. Currently, the functional DNA variant(s), the affected gene(s), and the
underlying molecular genetic mechanism(s) contributing to these associations are unknown.
iThis chapter previously appeared as an article in the American Journal of Human Genetics. The original citation is
as follows: Kulzer JR, Stitzel ML, Morken MA, Huyghe JR, Fuchsberger C, Kuusisto J, Laakso M, Boehnke M,
Collins FS, Mohlke KL. “A common functional regulatory variant at a type 2 diabetes locus upregulates ARAP1
expression in the pancreatic beta cell.” American Journal of Human Genetics, 94(2):186-97 (2014).
SNPs rs1552224 and rs11603334 are in perfect LD with each other (r2 = 1, EUR) and are
located within the first exon and 5’UTR of ARAP1 RefSeq isoforms NM_015242 and
NM_001135190, at +305 nt and +418 nt, respectively, from the transcription start site (TSS) at 72.11
Mb (hg18) on chromosome 11. A third ARAP1 RefSeq isoform, NM_001040118, is expressed from
an alternative promoter and TSS located at 72.14 Mb. We designate the promoter at 72.11 Mb as P1
and the promoter at 72.14 Mb as P2.
We hypothesized that functional variant(s) at this locus may be in high LD (r2 ≥ 0.8) with
rs1552224 and rs11603334. None of the variants in high LD with these SNPs are within gene coding
regions where they could alter protein function, suggesting that functional common SNP(s) at this
locus may influence gene regulation. Genes within the LD region containing rs1552224 and
rs11603334 have reported expression in human pancreas, islets, and flow-sorted beta cells;1
however, islet expression of ATG16L2, FCHSD2, and PDE2A may not be above background.16,17,54
None of these genes have been demonstrated to play roles in insulin processing or secretion.
ARAP1 is a GTPase activating protein (GAP) that activates ARF and RHO family GTPases, which
regulate membrane trafficking and actin cytoskeleton reorganization.18 STARD10binds and
transfers membrane phospholipids.19 PDE2A is a cyclic nucleotide phosphodiesterase, degrading
second messengers cGMP and cAMP.20 ATG16L2 shares sequence homology with ATG16, a
protein required for autophagy in yeast.21 FCHSD2 is named for its FCH and SH3 protein
domains.22
Here, we show data supporting rs11603334 as a functional variant regulating ARAP1
expression. Dense fine-mapping data and conditional analyses support a single association
signal. We demonstrate that the T2D-risk allele (C) of rs11603334 is associated with increased
containing transcriptional regulators, and increases transcriptional activity at the ARAP1 P1
promoter. These data suggest that increased ARAP1 P1 promoter activity and ARAP1 expression
may be molecular consequences of the T2D-associated variants in this region.
Materials and Methods
Study Population and Phenotypes
We included 8,635 Finnish men without diabetes and not taking diabetes medication
(mean age 57.2 years (range 45-74 years); mean body mass index (BMI) 26.8 kg/m2 (range
16.2-51.6 kg/m2); fasting plasma glucose levels < 7 mmol/l and 2-hour oral glucose tolerance test
plasma glucose levels < 11.1 mmol/l) from the population-based Metabolic Syndrome in Men
(METSIM) study55 in the proinsulin association analyses. Fasting plasma-specific proinsulin
(Human Proinsulin RIA kit, Linco Research, St. Charles, MO; no cross-reaction with insulin or
C-peptide) and fasting insulin (ADVIA Centaur Insulin IRI, 02230141, Siemens Medical
Solutions Diagnostics, Tarrytown, NY; minimal cross-reaction with proinsulin or C-peptide)
were measured by immunoassay. For the T2D association analyses, 1,389 T2D cases and 5,748
normoglycemic controls were included. The study was approved by the ethics committee of the
University of Kuopio and Kuopio University Hospital and informed consent was obtained from
all study participants.
Genotyping
Samples were genotyped with the Illumina HumanOmniExpress BeadChip. In sum,
681,789 autosomal SNPs passed quality control (Hardy-Weinberg equilibrium, HWE
genotyped using the Illumina HumanExome BeadChip,53 which focuses on protein-altering
variants selected from more than 12,000 exome and genome sequences.
Imputation and Reference Panel
A two-step imputation strategy was used, wherein samples were pre-phased using
ShapeIT version 256 before genotypes were imputed with Minimac.57 To increase imputation
quality, 5,474 haplotypes from the 2,737 Central-Northern European samples sequenced within
the Genetics of Type 2 Diabetes (GoT2D) study were used as a reference panel (C. Fuchsberger
et al., and J. Flannick, C. Fuchsberger, et al., 2012, Am. Soc. Hum. Genet., abstracts).
Fine-Mapping and Conditional Analysis
SNP associations with log-transformed fasting plasma proinsulin levels were tested
assuming an additive genetic model, using a linear mixed model with an empirical kinship
matrix to account for relatedness as implemented in EMMAX,58 and with adjustment for age,
BMI, and log-transformed fasting plasma insulin. Both raw residuals and rank-based
inverse-normal transformed residuals were analyzed to assess robustness of rare-variant associations
with outliers. Genotyped variants with minor allele count (MAC) ≥ 5 (MAF ~0.03%); HWE
p ≥ 1 10-6; and imputed variants with imputation quality score Rsq > 0.3 and MAF ≥ 0.03%
were included in the analyses. To identify additional independent signals in the region,
conditional analyses were performed on previously reported lead SNP rs11603334 or on our
fine-mapped lead SNP rs7109575, using allele count (genotyped variants) or allelic dosage
but with adjustment for age only. Kang et al.58 describe and motivate the use of a linear mixed
model for analysis of a binary outcome.
Allelic Expression Imbalance (AEI)
Human islets from non-diabetic organ donors were obtained from the National Disease
Research Interchange (NDRI) and the Islet Cell Resource/Integrated Islet Distribution Program
(ICR/IIDP). DNA and RNA were obtained from 87 primary human pancreatic islet samples using
the PureGene (DNA) or RNAeasy kits (RNA) (Qiagen, Gaithersburg, MD). Reverse transcription of
the RNA was performed using the Superscript III first-strand synthesis system (Life Technologies,
Grand Island, NY). Common, transcribed SNPs (minor allele frequency ≥ 0.1) with the highest LD
values with previously reported lead SNPs rs11603334 and rs1552224 were selected for testing
allelic expression of ARAP1, STARD10, PDE2A, and FCHSD2 (Table 2). LD plots including the
transcribed SNPs were created using the HapMap genome browser (Figure 7).59 High quality
genomic DNA (gDNA) and mRNA were available for five islet samples heterozygous for
rs11603334 and rs1552224; one additional high quality heterozygous sample each was available
for mRNA only or gDNA only. For each transcribed SNP, the relative proportions of each allele
comprising the gDNA and complementary DNA (cDNA) were quantified using Sequenom iPLEX
matrix-assisted laser desorption/ionization-time of flight (MALDI-TOF) mass
spectrometry-based genotyping (Sequenom, San Diego, CA). Primers were designed using MassARRAY
(Sequenom) (Table 3). The primers were designed within a single exon to avoid amplicon size
differences between gDNA and cDNA, except for rs2291289, which is located near an
exon/intron boundary. To control for assay variation, the proportions of each SNP allele
reported as percent of total gDNA or cDNA containing a given transcribed SNP allele.
Statistical significance of differences in allelic representation was determined based on LD
scenarios as previously described.60 Briefly, two-sided t tests were used when the transcribed
SNP and lead SNPs were in perfect LD (D’ = 1.0, r2 = 1.0), or when the transcribed SNP and
lead SNPs were in intermediate LD with low pairwise correlation (D’ ≈ 1.0, r2 < 0.2). For all t
tests, F tests were first used to determine equal or unequal variance. Non-parametric Wilcoxon
pair-wise tests were used instead of t tests when gDNA or cDNA measurement data were not
normally distributed. One-sided F tests were used when the transcribed SNP and lead SNPs
were in low LD (D’ < 0.2, r2 < 0.2).
Regulatory Variant Selection
All known variants in high LD (r2 ≥ 0.8, EUR) with rs11603334 and rs1552224 were
identified using EUR data from Phase 1 of the 1000 Genomes project.61 Variants were prioritized
based on location relative to regions of potential regulatory function, marked by the following: open
chromatin in primary human pancreatic islets detected by formaldehyde-assisted isolation of
regulatory elements (FAIRE)62 and DNase hypersensitivity,63 accessible chromatin in primary
human pancreatic islets detected by chromatin immunoprecipitation (ChIP)-seq for active histone H3
lysine methylation or acetylation modifications (H3K4me3, H3K4me1, and H3K9ac) as reported in
the Human Epigenome Atlas,64 and transcription factor binding in Encyclopedia of DNA Elements
Cell Culture
MIN6 mouse insulinoma beta cell line66 was grown in Dulbecco's Modified Eagle's
medium (DMEM) culture medium (Sigma, St. Louis, MO) supplemented with 10% fetal bovine
serum (FBS), 1 mM sodium pyruvate, and 100 μM 2-mercaptoethanol. INS-1-derived 832/13 rat
insulinoma beta cell line67 (a gift from C.B. Newgard, Duke University, Durham, NC) was
grown in Roswell Park Memorial Institute (RPMI) 1640 culture medium (Corning Cellgro,
Mannassas, VA) supplemented with 10% FBS, 2 mM L-glutamine, 1 mM sodium pyruvate, 10
mM Hepes, and 0.05 mM 2-mercaptoethanol. Both lines were maintained at 37°C and 5% CO2.
One day prior to transfection, MIN6 cells were seeded at a density of 200,000 cells per well on
24-well plates. 832/13 cells were seeded at a density of 300,000 cells per well on 24-well plates,
or 150,000 cells per well on 48-well plates.
Dual-Luciferase Transcriptional Reporter Assay
Genomic regions including variant positions were polymerase chain reaction
(PCR)-amplified from human gDNA using 5 PRIME Mastermix (5 PRIME, Inc., Gaithersburg, MD) or
Expand High Fidelity PCR System (Roche, Indianapolis, IN) with the primers listed in Table 4.
Amplified DNA was subcloned using XhoI, KpnI, and/or NheI restriction enzymes and T4 DNA
Ligase (New England Biolabs, Inc., Ipswich, MA) into the multiple cloning site upstream of the
firefly luciferase gene in the pGL4.10 promoterless vector (Promega, Madison, WI).
Site-directed mutagenesis was performed using the QuikChange II XL Site-Directed Mutagenesis Kit
(Agilent, Santa Clara, CA) and the primers listed in Table 4. For each construct, two to ten
independent clones were selected. The fidelity and genotype of each gDNA construct was
empty pGL4.10 promoterless vector were co-transfected with 80 ng of Renilla luciferase vector
using Lipofectamine 2000 (Life Technologies, Grand Island, NY) into duplicate wells of MIN6
or 832/13 cells. Transfected cells were incubated at 37°C and 5% CO2 overnight and the
transfection media was replaced with fresh culture media after 24 hours. Forty-eight hours
post-transfection, cell lysates were collected and assayed for luciferase activity using the
Dual-Luciferase Reporter Assay System (Promega). Firefly luciferase activity was normalized to that
of Renilla luciferase to control for differences in transfection efficiency. Normalized data are
reported as the fold change (± standard deviation, SD) in relative activity compared to that of the
empty pGL4.10 promoterless vector control. Two-sided t tests were used to compare luciferase
activity between genotypes or haplotypes. F tests were used to determine equal or unequal
variance. Two-way analysis of variance (ANOVA) was used for simultaneous comparisons of
haplotypes resulting from two independently tested SNPs.
Electrophoretic Mobility Shift Assay (EMSA) and Transcription Factor Prediction
Four sets of complementary 21-mer oligonucleotides centered on rs11603334 (C/T) or
rs1552224 (T/G) were generated, containing either of the two alternate alleles, both with and
without biotin end-labeling (Integrated DNA Technologies, Coralville, IA). Each set was
annealed to create double-stranded oligos by incubating 50 pmol of each single-stranded oligo
together in buffer containing 10 mM Tris, 1 mM EDTA, and 50 mM NaCl at 95°C for 5 minutes,
followed by gradual cooling to 4°C. Double-stranded oligo sequences are specified in Table 5.
Nuclear protein lysates were extracted from MIN6 and 832/13 cell pellets with NE-PER Nuclear
and Cytoplasmic Extraction Reagents (Thermo Scientific, Waltham, MA) and protein
were carried out with the LightShift Chemiluminescent EMSA Kit (Thermo Scientific) according to
the manufacturer’s instructions. Each protein-DNA binding reaction contained 1X binding buffer, 1
μg poly(dIdC), 4 μg nuclear protein lysates, and 100 fmol biotin-labeled double-stranded oligo in 20
μl total reaction volume. For samples demonstrating DNA competition, 60-fold excess unlabeled
double-stranded oligo was pre-incubated with nuclear protein lysates in the reaction mixture for 20
minutes before the addition of biotin-labeled oligo. For EMSA reactions with supershift, 4 μg
antibody was added to the final reaction mixture and the samples were incubated for an additional 30
minutes. JASPAR,68 TRANSFAC,69 CONSITE,70 PWMSCAN,71 and Tfsitescan72 were used to
computationally predict transcription factors that may differentially bind at rs11603334 by
contrasting the predictions and/or scores generated for each SNP allele. Transcription factor
ChIP-seq data for the region overlapping rs11603334 were obtained from the ENCODE
project.65 Antibody to PAX6 (PRB-278P) was purchased from Covance (Princeton, NJ).
Antibodies to PAX4 (M-45X, sc-98942X) and AP-2β (H-87X, sc-8976X) were purchased from
Santa Cruz Biotechnology (Dallas, TX). Antibodies to HIF1α (MA1-516) and HIF1β (MA1-515)
were purchased from Thermo Scientific. Additional antibodies to the following factors were also
purchased and tested for supershift: YY1 (39071, 39345), Active Motif (Carlsbad, CA); NFIC
(ab86570), Abcam (Cambridge, UK); AP-2α (C-18, 184X), YY1 (C-20, 281X; H-414,
1703X), MAX (C-124, 765X), p53 (DO-1, 126X), OCT3/4 (C-10, 5279X), SP1 (E-3,
sc-17824X), USF-1 (C-20, sc-229X), EGR-1 (C-19, sc-189X), RXRα (D-20, sc-553X), E4BP4 (V-19,
sc-9549X), PDX1 (N-18, sc-14662X), CEBPβ (C-19, sc-150X), CUX1 (C-20, sc-6327X), and p300
(C-20, sc-585X), Santa Cruz Biotechnology. Protein-DNA complexes were separated by
(Lonza, Rockland, ME), transferred to nylon membranes (Thermo Scientific), and UV
cross-linked before proceeding with chemiluminescent detection.
Results
Fine-Mapping of the 11q13.4 Locus Associated with Fasting Proinsulin and T2D
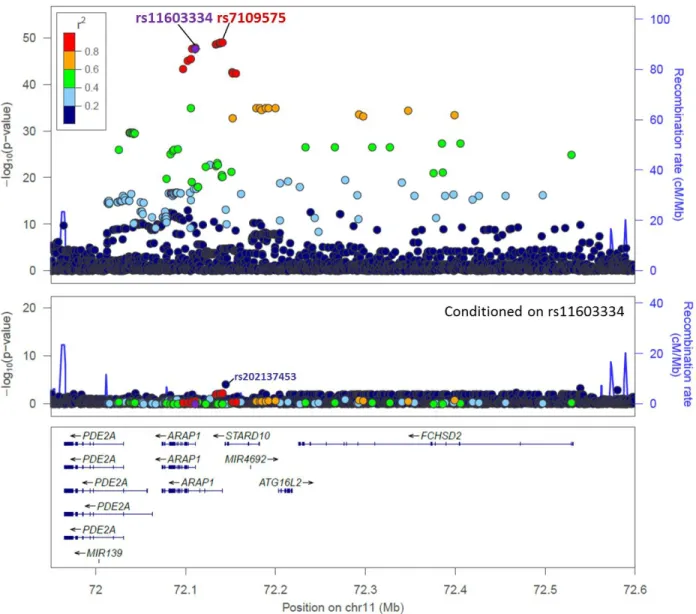
To fine-map the fasting proinsulin association signal, we performed association analyses in
8,635 Finnish subjects from the METSIM study using SNPs imputed from a reference panel of
2,737 sequenced Central-Northern European individuals and SNPs directly genotyped on an
exome array.53 The lead SNP was rs7109575 (p = 7.4 10-50; n = 8,635), a non-coding variant
located at the ARAP1 P2 TSS (Figure 1, Table 6) and in high LD (r2 = 0.94) with previously
reported lead proinsulin-associated SNP rs116033342 (p = 2.2 10-48; n = 8,630). Conditional
analyses using rs11603334 or rs7109575 as covariates largely attenuated the proinsulin
association signal (all SNPs, p > 1.0 10-5; Figure 1, Figure 8, Table 6, and data not shown).
One rare missense variant genotyped in a 1 Mb region on the exome array was associated
(p < 0.05) with proinsulin after conditional analysis (rs202137453, MAF = 0.003, p = 0.015,
pconditional-rs11603334 = 8.5 × 10⁻⁵, Table 6). Association with T2D using 1,389 case and 5,748 control
subjects (rs7109575, p = 2.2 10-3; rs11603334, p = 3.6 10-3) was also attenuated after
conditional analysis (p > 0.05; Table 6, Figure 9, and data not shown). Taken together,
fine-mapping and conditional analyses provide evidence supporting a functional regulatory role for
Figure 1. Variants Associated with Proinsulin in the METSIM Study
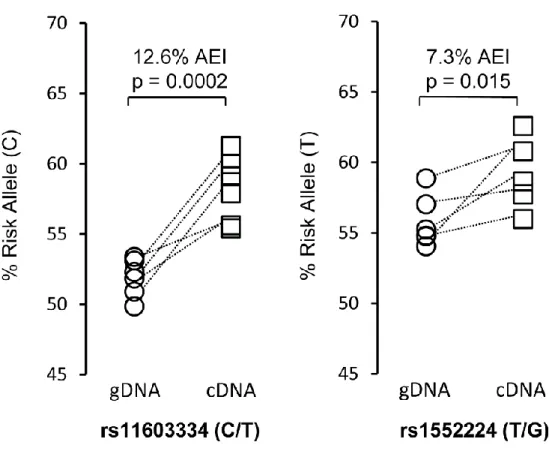
The Proinsulin-Decreasing and T2D-Risk Alleles are Associated with Increased ARAP1 mRNA Levels in Primary Human Pancreatic Islets
To determine if expression of ARAP1, STARD10, PDE2A, or FCHSD2 is associated with
the T2D- and fasting proinsulin-associated lead SNPs, we evaluated allelic expression imbalance
(AEI) in primary human pancreatic islets. AEI maximizes sensitivity and power to detect modest
cis-acting effects on mRNA expression through quantification of allele-specific transcript levels
within heterozygous samples, thereby controlling for differential trans-acting and environmental
exposures between individuals74 as well as differential sample purity and viability between islet
preparations.75,76 The allelic composition of the total transcript levels for each gene was
quantitatively determined with Sequenom MALDI-TOF mass spectrometry, a sensitive approach
that conserves limited biological sample, and statistically analyzed relative to the allelic composition
of the gDNA (Methods). Located in the first exon and 5’UTR of ARAP1 isoforms transcribed
from P1, previously reported lead SNPs rs11603334 and rs1552224 demonstrated AEI (Figure
2). In six samples heterozygous for rs11603334 and rs1552224, we observed ARAP1 expression differences of 7 to 12% between alleles. For both SNPs, the T2D-risk alleles were associated with
higher ARAP1 transcript levels (rs11603334, p = 0.0002; rs1552224, p = 0.015). Due to lower LD
between the lead SNPs and a third ARAP1 transcribed SNP located in a downstream exon,
rs2291289 (r2 = 0.12, D’ = 1.0, rs11603334, EUR), only three samples were heterozygous for
both rs2291289 and rs11603334 (Table 2). The gDNA-to-cDNA comparison showed no AEI,
while a comparison among cDNA samples showed the non-risk allele associated with modestly
increased transcript levels (Figure 10A). We also attempted to evaluate AEI for nearby genes
containing transcribed SNPs in lower LD with rs11603334, using previously described statistical
methods.60 We did not observe significant evidence of AEI for STARD10, PDE2A, or FCHSD2
SNP and rs11603334 (Table 2). Overall, these results suggest that one or more functional variants in
high LD with rs11603334 and rs1552224 may increase the transcriptional activity or message
stability of ARAP1 isoforms containing these SNPs.
Figure 2. The T2D-Risk Alleles of rs11603334 and rs1552224 Are Associated with Increased ARAP1 Expression
Candidate Regulatory Variants at the ARAP1 Promoters
The originally identified lead SNPs rs11603334 and rs1552224 at the P1 promoter overlap
ENCODE transcription factor binding sites within a region of open and accessible chromatin in
human pancreatic islets that is marked by DNase hypersensitivity and active histone H3 lysine
modifications H3K4me3 and H3K9ac (Figure 3 and Table 7). The lead fine-mapped SNP in this
study, rs7109575 (r2 = 0.94 with rs11603334, EUR), is located within an islet DNase hypersensitivity
region and clustered transcription factor binding at the P2 promoter (Figure 11 and Table 7). Among
the 17 additional variants in high LD with rs11603334 (r2 ≥ 0.8, EUR; Table 7), rs77464186
(r2 = 0.95 with rs11603334, EUR) is the next most promising functional candidate due to its location
within a region of islet DNase hypersensitivity and clustered transcription factor binding in the first
intron of ARAP1 isoforms transcribed from the P2 promoter (Figure 11 and Table 7).
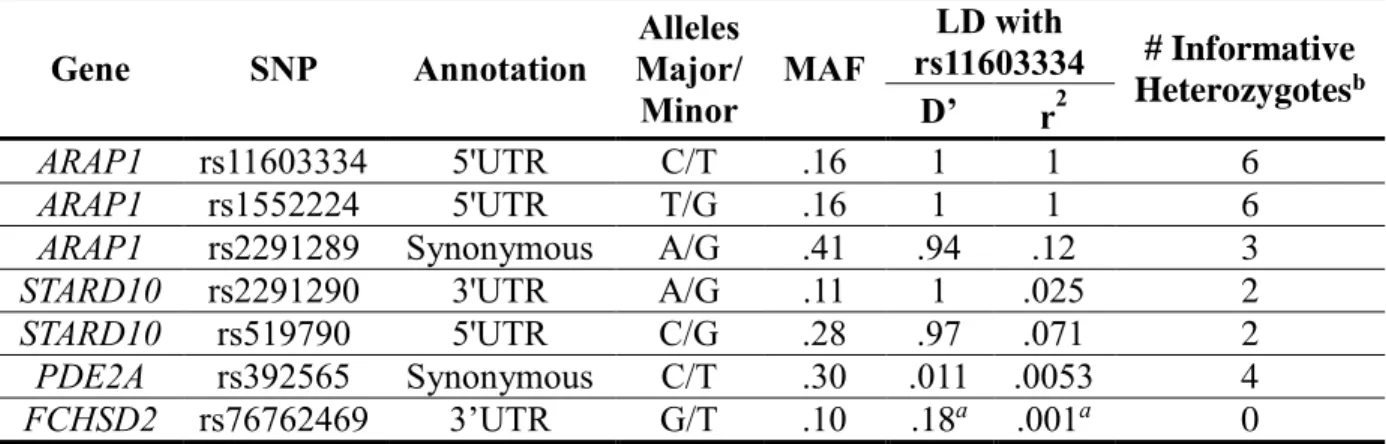
Table 2. Transcribed SNPs Used to Evaluate Allelic Expression Imbalance for ARAP1,
STARD10, PDE2A, and FCHSD2
Gene SNP Annotation
Alleles Major/ Minor
MAF
LD with
rs11603334 # Informative Heterozygotesb D’ r2
ARAP1 rs11603334 5'UTR C/T .16 1 1 6
ARAP1 rs1552224 5'UTR T/G .16 1 1 6
ARAP1 rs2291289 Synonymous A/G .41 .94 .12 3
STARD10 rs2291290 3'UTR A/G .11 1 .025 2
STARD10 rs519790 5'UTR C/G .28 .97 .071 2
PDE2A rs392565 Synonymous C/T .30 .011 .0053 4
FCHSD2 rs76762469 3’UTR G/T .10 .18a .001a 0
MAF, minor allele frequency; LD, linkage disequilibrium; UTR, untranslated region. MAF, D’, and r2 data are estimated from EUR, 1000 Genomes Phase 1, except aCEU, 1000
Figure 3. SNPs rs11603334 and rs1552224 Are Located in a Region with Evidence of Regulatory Potential at the ARAP1 P1 Promoter at 72.11 Mb
University of California Santa Cruz (UCSC) Genome Browser (hg18) diagram showing
rs11603334 and rs1552224 situated at the ARAP1 P1 promoter and 18 additional variants in high LD (r2 ≥ 0.8). ARAP1 is transcribed from right to left. SNPs rs11603334 and rs1552224 overlap regions of accessible chromatin in human pancreatic islets detected by H3K4me3 and H3K9ac ChIP-seq, are situated within or proximal to regions of open chromatin in human pancreatic islets detected by DNase hypersensitivity and FAIRE, and overlap binding sites for Pol2 and other transcription factors detected by ChIP-seq in several ENCODE cell lines (see also Table 7). The DNA sequences cloned for evaluating differential allelic transcriptional activity in the dual-luciferase reporter assays are indicated.
The rs11603334 T2D-Risk and Proinsulin-Decreasing Allele Increases Transcriptional Reporter Activity in Rodent Pancreatic Beta Cell Lines
To interrogate allelic differences in transcriptional activity of rs11603334, rs1552224,
rs7109575, and rs77464186, we cloned DNA sequences containing the T2D-risk
(proinsulin-decreasing) or non-risk (proinsulin-increasing) alleles into a promoterless luciferase vector and
measured luciferase activity in the MIN6 mouse and 832/13 rat beta cell lines. Due to the perfect LD
and short distance between rs1552224 and rs11603334, we first tested them together as a haplotype
hypersensitivity in human pancreatic islets and Pol2 binding in several other cell types (Figure 3),
exhibited strong transcriptional activity compared to empty vector control in both MIN6 (Figure 4A)
and 832/13 (Figure 4B). The rs1552224 and rs11603334 T2D-risk haplotype (TC) demonstrated a
two-fold increase in transcriptional activity compared to the non-risk haplotype (GT) in both MIN6
(p< 0.0001) and 832/13 (p = 0.015), consistent with our finding that the T2D-risk alleles are
associated with increased ARAP1 expression. The 1,357-bp region also contained two short
sequences of variable CT repeat length (CT6-10); however, the numbers of repeats at the two sites did
not influence transcriptional activity (Figure 12A-B). A narrower, 245-bp DNA region (Figure 3)
containing only variants rs1552224 and rs11603334 also exhibited strong transcriptional activity
compared to empty vector control (Figure 4C). As observed with the 1,357-bp region, the two-SNP
T2D-risk haplotype (TC) demonstrated a two-fold increase in transcriptional activity compared to the
non-risk haplotype (GT) (p = 0.012). To determine which of the SNPs is responsible for the
haplotype effects on transcriptional activity at the P1 promoter, we used site-directed mutagenesis to
synthetically create the alternate ‘missing’ haplotypes. The T2D-risk C allele of rs11603334
replicated the previously observed two-fold increase in transcriptional activity compared to the
non-risk T allele (p < 0.0001), while the T2D-risk and non-risk alleles of rs1552224 (T/G) showed
no significant difference (Figure 4D). We did not observe evidence of allelic differences in
transcriptional activity for either rs7109575 (Figure 4E) or rs77464186 (Figure 12C) near the P2
promoter. However, the 287-bp region of DNA surrounding rs7109575 increased transcriptional
activity nine-fold compared to the empty control vector (p < 0.0001), consistent with promoter
Figure 4. The T2D-Risk Allele, C, of rs11603334 Increases Transcriptional Activity of the
ARAP1 P1 Promoter
Transcriptional activity was evaluated with dual-luciferase reporter assays in the MIN6 mouse and 832/13 rat insulinoma β-cell lines 48 hr after transfection with recombinant vector
containing selected regions of the human ARAP1 promoters cloned upstream of the luciferase gene. (A) rs1552224 and rs11603334 evaluated as a haplotype in a 1,357 bp region at the ARAP1 P1 promoter in MIN6. (B) rs1552224 and rs11603334 evaluated as a haplotype in the 1,357 bp region in 832/13. (C) rs1552224 and rs11603334 evaluated as a haplotype in a narrower 245 bp region at the ARAP1 P1 promoter in 832/13. (D) Site-directed mutagenesis separated the effects of rs1552224 and rs11603334 in the 245 bp region in 832/13. (E)
Decreased in vitro Binding of PAX6 and PAX4 to the rs11603334 T2D-Risk and Proinsulin-Decreasing Allele (C)
We performed EMSAs using nuclear protein lysates extracted from MIN6 and 832/13 to
evaluate differences in transcription factor binding to alleles of rs11603334 and rs1552224. Multiple
protein-DNA complexes were observed in the EMSAs, consistent with expectations for DNA within
a promoter region (Figure 5 and Figure 13). At least one protein complex was observed to bind
specifically to the non-risk (T) allele of rs11603334 in MIN6 (Figure 5A, arrow). DNA competition
assays using excess unlabeled oligo containing the T allele reproducibly disrupted the protein-DNA
complex more efficiently than excess unlabeled oligo containing the C allele, further supporting
allelic differences in protein binding (Figure 5A, lanes 8 vs. 9; Figure 13A, lanes 7 vs. 8).
Preferential protein binding to the T allele was also detected in 832/13 for a complex with similar
mobility (Figure 13A, arrow). To identify the differentially bound protein(s), we performed EMSAs
with supershift using antibodies targeting transcription factors selected from those with
computationally predicted or empirically determined (ChIP-seq) binding at rs11603334 (Materials
and Methods). Incubation with antibody targeting Pax6 partially disrupted the T allele-specific
protein-DNA complex (Figure 5A, lane 10; Figure 5B, lane 8) and incubation with antibodies
targeting both Pax6 and Pax4 fully disrupted the complex (Figure 5B, lane 10). Among the other
transcription factors tested with supershift assay, only AP-2β, Hif1α, and Hif1β were observed to
bind to the 21-bp DNA sequence containing rs11603334; these proteins bound to both the C and T
alleles with approximately equal affinity (Figure 13B-C, arrows). We did not observe clear evidence
Figure 5. The T2D-Risk Allele, C, of rs11603334 Disrupts Binding of Transcriptional Regulators PAX6 and PAX4
Differential allelic protein-DNA binding was evaluated in vitro with EMSAs. Biotin-labeled 21 bp double-stranded DNA oligonucleotide centered on the reference (C) and alternate (T) alleles of rs11603334 was incubated with MIN6 nuclear lysate, and resulting protein-DNA complexes were separated by electrophoresis (A and B: lanes 2 and 7, respectively). For the competition assays, EMSA reactions were incubated with 60-fold excess unlabeled DNA oligonucleotide containing either the T or C allele (A: lanes 8 and 9, respectively). For the supershift assays, EMSA reactions were incubated with antibody targeting PAX6 (A: lane 10; B: lane 8), PAX4 (B: lane 9), or both PAX6 and PAX4 (B: lane 10).
Discussion
For most T2D-associated loci identified through GWAS, the functional variants and affected
genes are not known. In this study, we identify a plausible functional regulatory variant, rs11603334,
and demonstrate its allelic effects on expression of ARAP1, a gene at the 11q13.4 locus. We
provide evidence suggesting that the C allele of rs11603334 disrupts binding of transcriptional
regulators and increases transcriptional activity at the ARAP1 P1 promoter, leading to higher
ARAP1 expression in pancreatic islets. Increased ARAP1 expression may be one molecular
We conducted association analyses using the densest set of variants to date, reporting
rs7109575 as the lead fine-mapped SNP, and confirming the primary robust association with
fasting proinsulin for previously reported lead SNPs rs11603334 and rs1552224. Although not
the most strongly associated SNP in this study, the association p-value for our proposed
functional SNP rs11603334 (p = 2.2 10-48) was similar to that of rs7109575 (p = 7.4 10-50);
sampling variability, missing genotypes, or imputation uncertainty may influence the relative
p-values. Conditioning on either rs11603334 or rs7109575 attenuated the proinsulin association at
this locus, consistent with a single signal at this locus and supporting the use of the r2 measure of
LD to identify candidate functional SNPs. Rare variants may also contribute to variation in
proinsulin levels among carriers. The variant that became more significant after adjusting for
rs11603334 (rs202137453, STARD10 Pro196Ser) may be a true signal or a false positive among
3,818 variants tested. Further fine-mapping and conditional analyses using a larger T2D
case-control population will be needed to determine if other variants in the region also contribute to
T2D risk.
We demonstrate for the first time that the T2D-risk alleles of rs11603334 and rs1552224 are
associated with increased ARAP1 mRNA expression in primary human pancreatic islets. This
finding was reproducibly evident with a small number of samples because AEI compares
quantification of allele-specific mRNA levels within heterozygous individuals, thereby minimizing
confounding effects such as inter-individual environmental exposures that can mask genotypic
effects in eQTL studies. We had the best power to detect association of rs11603334 and rs1552224
with ARAP1 mRNA expression because the SNPs are located within an exon; this exon is specific to
ARAP1 isoforms transcribed from the P1 promoter. Previously, rs519790 was reported to be a strong
(r2 = 0.071, EUR), which shows only a modest, residual eQTL association with STARD10 (blood, p
= 8.6 10-7; liver, p= 1.79 10-5; omental adipose tissue, p= 1.21 10-6).25 A nominal
association between rs1552224 and ARAP1 (CENTD2) expression has been previously reported
in T-cells (p = 0.019) in a direction consistent with our results.77,78
In agreement with our finding that the T2D-risk alleles of rs11603334 and rs1552224 are
associated with increased ARAP1 expression, our experiments using the transcriptional reporter
assay show that the T2D-risk allele of rs11603334 upregulates transcriptional activity at the
ARAP1 P1 promoter. While transcriptional activity at a gene promoter may be expected, allelic
differences in promoter activity cannot be predicted easily; functional assays are necessary to
demonstrate allelic effects. Among three tested variants situated at the ARAP1 P1 and P2
promoters in this study, only rs11603334 demonstrated allelic effects on promoter activity.
Taken together, the results from the AEI and transcriptional reporter assays implicate increased
expression of ARAP1 isoforms containing rs11603334 and transcribed from the P1 promoter
(NM_015242, NM_001135190) in T2D susceptibility.
We show that the beta cell transcriptional regulator Pax6 preferentially binds to the
mRNA-lowering (T) allele of rs11603334 in a protein-DNA complex that may also contain
Pax4, suggesting a repressive role for one or both factors in transcription at the ARAP1 P1
promoter (Figure 6). Pax6 and Pax4 have similar binding sequences, although they bind DNA
with different relative affinities.79–81 In the endocrine pancreas, Pax6 is often reported to
function as a transcriptional activator, while Pax4 often functions as a repressor. Pax4 has been
shown to inhibit the transcriptional activity of co-expressed Pax6 in the HIT-T15 hamster beta
cell line and in 293T cells, possibly through competition for DNA binding sites.80 Pax4 also
strongly represses Pax6-activated transcription of the both the glucagon81 and insulin
promoters.82 However, repressive activity for human and mouse PAX6 has also been
demonstrated for specific regulatory elements in other cell types.83–85 The observed inhibition of
transcriptional activity for ARAP1 transcripts containing the rs11603334-T allele may be
mediated by PAX4, PAX6, or both. Human coding variants in PAX4 or PAX6 have been
previously implicated in impaired glucose tolerance,86,87 early-onset diabetes,86,88 ketosis-prone
diabetes,89 and proinsulin processing.90 Recently, genome-wide association signals for T2D have
also been identified near PAX4 in East Asian45 and Chinese populations.91
Figure 6. Proposed Model for PAX6 and PAX4 Repression of Transcriptional Activity at
ARAP1
PAX6 and PAX4 at rs11603334 in a complex with stronger binding to the ARAP1