Lauren Michelle Abbate
A dissertation submitted to the faculty of the University of North Carolina at Chapel Hill in partial fulfillment of the requirements for the degree of Doctor of Philosophy in the
Department of Epidemiology.
Chapel Hill 2009
Approved by: June Stevens (chair) Leigh F. Callahan Joanne M. Jordan Charles Poole Todd A. Schwartz
ii
©2009
iii
ABSTRACT
LAUREN ABBATE: Associations of Obesity and Weight Change with Onset and Progression of Radiographic Knee Osteoarthritis
(Under the direction of June Stevens)
Background: Obesity is a well-established risk factor for radiographic knee osteoarthritis
(rKOA), but less is known about the relationships between fat distribution and weight change and rKOA. Though reduction in weight is one recommendation to reduce the incidence of rKOA, weight loss is difficult to achieve, and it is possible that weight maintenance is a more attainable goal for some individuals. Objectives: The relationships between
iv
v
ACKNOWLEGEMENTS
This work would not have been possible without the funding and support that I have received over the past several years. The Thurston Arthritis Research Center at the
University of North Carolina, Chapel Hill, NC (Graduate Student Research Assistantship); The Arthritis Foundation, Atlanta GA (Doctoral Dissertation Award); and the Triangle Community Foundation, Research Triangle Park, NC (Gertrude B. Elion Mentored Medical Student Research Award) all provided generous financial support.
The Thurston Arthritis Research Center has provided me with an incredibly rich multi-disciplinary training environment since 2001, and I thank all of the faculty, staff, fellows, and students at the Center for sharing their knowledge and expertise and for creating such a wonderful and collaborative environment in which to work. In addition, I would like to thank the Johnston County Osteoarthritis Project participants for their contributions to the project. My heartfelt thanks go to Joanne Jordan, my research advisor and mentor, whose support and encouragement has been endless.
I consider myself lucky to have been able to be a part of the UNC community. The Gillings School of Global Public Health is filled with compassionate, ambitious, and collaborative students, faculty, and staff. I worked most closely with those in the
vi
dedication to the students and the department is incredible, and I appreciate all of their efforts on my behalf. I want to thank all of the members of the OP group over the years for their insight, support, and friendship. I thank the original members of my dissertation support group, Myduc Ta, Whitney Robinson, and Jen Brown as well as others that participated throughout the process.
To my committee members, June Stevens, Leigh Callahan, Joanne Jordan, Charlie Poole, and Todd Schwartz, thank you for your guidance and support, for always finding the time for discussions, and for challenging me to be a better researcher. I learned so much from all of you.
vii
Table of Contents
Abstract ...iii
ACKNOWLEGEMENTS ... v
Table of Contents ... vii
List of Tables ... x
List of Figures ... xi
List of Abbreviations ... xii
Introduction ... 1
Critical Review of the Literature ... 3
Knee osteoarthritis etiopathogenesis ... 3
Definition of knee osteoarthritis ... 4
Prevalence of knee osteoarthritis ... 5
Obesity and knee osteoarthritis ... 6
Measuring obesity ... 7
Waist circumference and BMI in relation to knee osteoarthritis ... 10
Weight change, weight maintenance, and knee osteoarthritis ... 15
Conclusion ... 18
viii
Methods... 21
POPULATION ... 21
VARIABLES ... 23
ANALYTIC STRATEGY ... 26
STATISTICAL MODELS ... 26
Overview ... 26
Other statistical approaches considered ... 28
Initial weight value: Aim 2 ... 31
Aim 1. Associations between BMI and WC and the incidence and progression of radiographic KOA ... 33
ABSTRACT ... 33
INTRODUCTION ... 34
METHODS ... 36
Study Design ... 36
Measurements ... 37
Participants at risk for incidence and progression ... 37
Statistical Analysis ... 38
RESULTS ... 40
Incidence analysis ... 41
Progression analysis ... 42
DISCUSSION ... 44
TABLES AND FIGURES ... 50
Aim 2. Associations between weight change and incident rKOA ... 56
ix
INTRODUCTION ... 57
METHODS ... 59
Study Design ... 59
Measurements ... 60
Statistical Analysis ... 61
RESULTS ... 63
DISCUSSION ... 64
TABLES AND FIGURES ... 69
Discussion ... 71
SUMMARY ... 71
LIMITATIONS AND STRENGTHS ... 72
PUBLIC HEALTH IMPLICATIONS ... 74
CONCLUSION ... 75
Appendix A: Evaluation of potential statistical approaches ... 77
Appendix B: Spline Regression ... 81
x
List of Tables
Table 1.1 Select variables collected in The JoCo OA Project ... 24
Table 2.1. Characteristics of the incidence and progression samples by sex at T0 ... 51
Table 2.2. Sex-specific hazard ratios and 95% confidence intervals for the associations of BMI and WC with incident rKOA ... 52
Table 2.3. Sex-specific hazard ratios and 95% confidence intervals for the associations of BMI and WC with incident rKOA within NHLBI BMI categories ... 53
Table 2.4. Sex-specific hazard ratios and 95% confidence intervals for the associations of BMI and WC with rKOA progression ... 54
Table 2.5. Sex-specific hazard ratios and 95% confidence intervals for the associations of BMI and WC with rKOA progression withing NHLBI BMI categories ... 55
Table 3.1. Characteristics of the incidence sample at T0 ... 70
Table 3.2. Hazard ratios and 95% confidence intervals for the associations between
percent weight change categories and incident rKOA ... 70
Table 3.3. Hazard ratios and 95% confidence intervals for the associations between percent weight change categories and rKOA incidence stratified by BMI
xi
List of Figures
Figure 1.1. Status of participants in the Johnston County Osteoarthritis Project ... 23
Figure 2.1. Incidence and progression ... 50
xii
List of Abbreviations
AP Anteroposterior
BMI Body mass index CI Confidence interval CRP C-reactive protein
GEE General Estimating Equations
HR Hazard ratio
IL-6 Interleukin-6
JoCo OA The Johnston County Osteoarthritis Project K-L Kellgren-Lawrence
KOA Knee osteoarthritis
rKOA Radiographic knee osteoarthritis MRI Magnetic resonance imaging
NHANES National Health and Nutrition Examination Survey NHLBI National Heart, Lung and Blood Institute
OA Osteoarthritis
OR Odds ratio
Introduction
“You can study my knees,” is often the response I get when I mention that my area of research is obesity and knee osteoarthritis. One does not need to be a scientist to know that both obesity and arthritis are common conditions in the United States (US), and many people with whom I have spoken are either affected themselves or have friends and/or relatives who live with arthritis. In particular for obesity, many people know it is not good for their health, yet they struggle to achieve and maintain a healthy weight. It is well accepted in the
healthcare community that obesity is related to knee osteoarthritis, but the importance of this relationship cannot be overstated enough. Knee osteoarthritis is a painfully debilitating chronic condition for which treatments are limited, and obesity is one of few potentially modifiable risk factors for this condition. With obesity rates on the rise not only in the US but around the world, more focus must be placed on understanding the intricacies of this relationship and on identifying individuals who are most at risk if we hope to reduce the burden of knee osteoarthritis and improve the quality of life for those living with this condition.
2
Furthermore, I intended to apply newer methodologies to aid in our understanding. By going back to the basics, I hoped to confirm what we did know and fill in the gaps I found in the literature. Moreover, I wanted to find an answer to a simple question I was once asked at a conference, “so what does this mean for my patients?” Years later, it turned out not to be so simple. What I thought was a straightforward question mushroomed into many more complicated questions.
3
Critical Review of the Literature
Arthritis is the leading cause of disability in the United States (1), is estimated to affect 21% of the US population in 2005 (2), and is projected to affect 67 million adults by the year 2030 (3). OA is the most common form of arthritis, seen most frequently in the hand, knees, and hips. Knee osteoarthritis (KOA) is highly prevalent in women, African-Americans, and older individuals (4-6) with prevalence estimates ranging from 13.8 to 37.4% depending on the cohort (7). Additionally, the prevalence of obesity has been increasing since 1960 (8), with the greatest prevalence, among African-American women (9). Since obesity is strongly associated with osteoarthritis (OA), especially knee osteoarthritis (KOA) (10-13), and obesity is associated with disability (14), the impact of these conditions on public health is staggering for both individuals and for the US health care system. In 1997, there were 744,000 hospitalizations with a principle arthritis diagnosis and 256,000 knee replacements (15). In that same year, the total cost of arthritis and other rheumatic conditions was estimated to be 86.2 billion dollars (16). Thus, it is critical to understand the relationship between obesity and KOA. The following sub-sections will summarize the current literature the relationships of BMI and body fat distribution with KOA.
Knee osteoarthritis etiopathogenesis
4
functions to both distribute the load over the joint as well as facilitate movement. Synthesized by chondrocytes, articular cartilage is made up of various types of collagens and is notably avascular, aneural, and alymphatic, limiting its ability to regenerate easily once damaged (18). Increased intra-articular stress, caused by any number of mechanical factors, including obesity, creates injury to the both the cartilage and subchrondral bone. This injury then stimulates repair mechanisms, which is now thought to be the most appropriate characterization of the OA process (17). Thus, removing the mechanical insults prior to damage or when damage is minimal and still within the possibility of repair, is one potential method for managing the onset and
progression of OA (17). Given our current knowledge of this process, prevention plays a critical role in the reducing the burden of KOA. For these reasons, it is important to examine the
development of KOA and the factors that are most likely to initiate the process.
Definition of knee osteoarthritis
KOA is measured most commonly by radiographic changes, in particular with the use of the Kellgren-Lawrence (K-L) scale (19). This scale uses four grades (0-4) to assess the presence and severity of disease with 0 = none, 1 = doubtful OA characterized by questionable joint space narrowing, 2 = minimal OA characterized by definite presence of osteophytes and possible joint space narrowing, 3 = moderate OA characterized by multiple osteophytes, joint space narrowing, some scelerosis, and possible bone deformity, and 4 = severe OA characterized by large
5
for defining KOA, such as joint space narrowing, are also used and accepted, the K-L scoring system is well-known and its use is widespread. In addition, the K-L grade is often combined with the presence of knee symptoms to identify those with “symptomatic KOA.” Using either the symptomatic KOA or the radiographic KOA definition depends on the proposed research question as the relationship between radiographic score and reported symptoms is not necessarily highly related (20). For purposes of understanding etiopathogenesis, using radiographic
outcomes is common whereas symptomatic outcomes are often used when the purpose is related to the pain and disability experienced.
Prevalence of knee osteoarthritis
Radiographic KOA, has been estimated to affect between 4.3% and 37% of the adult population (4, 7, 21-24), depending on the method of radiographic assessment. The prevalence rKOA increases with age, is higher among females and among African-Americans compared to Whites (4, 6, 11, 22, 24), with African-American women having the greatest prevalence of the four gender-ethnic subgroups (4, 11, 22). Recent estimates from the third National Health and
6 Obesity and knee osteoarthritis
The prevalence of obesity, defined as BMI ≥ 30 kg/m2, in the US has been increasing since 1960 with the largest increases occurring in the past two decades (8). The most recent estimates from NHANES 2003 – 2004 indicated that 32.2% of US adults aged 20 or older were obese and that the prevalence was greatest among non-hispanic black women (53.9%) compared to non-hispanic white women (30.2%), non-hispanic black men (34.0%), and non-hispanic white men (31.1%) (9).
Numerous studies have shown that obesity is strongly associated with rKOA (10-13, 22, 23, 27-33). Obesity most likely affects rKOA via biomechanical pathways by causing excess forces on the joint (17, 34, 35). It has been postulated that the decreased quadriceps strength observed with aging in combination with obesity exhibits excess loading of the joint in older, overweight individuals leading to cartilage degradation that is characteristic of KOA. In addition, it has been suggested that obese women are at increased risk for KOA because they have less muscle mass than men to absorb these forces (36). Furthermore, there is evidence to suggest that limb alignment modifies the effect of obesity (37-39). In addition to a
7 Measuring obesity
As stated above, association between obesity and KOA has been well established using the measure of BMI. Obesity, defined as excess adiposity, is often measured using body mass index (BMI) which standardizes weight for height [weight (kg)/height (m)2] (43). However, BMI, as an indicator of adiposity, performs differently at various ages and between genders and
ethnicities (44-46). Although BMI is not a perfect measure of adiposity because it does not distinguish between fat mass and lean mass, it has been shown to be an appropriate proxy in the general population, including the elderly (47-49). Since lean masses (bone and muscle) weigh more than fat mass and men have a greater lean mass compared to women, total adiposity as measured by BMI, is overestimated in men than in women (44, 45). This is particularly
important when studying normal weight and possibly overweight individuals as studies of obese men and women have shown that BMI is a more accurate indicator of obesity with increasing BMI values (45). For these reasons, although BMI is widely used, other measures, such as waist circumference, have been proposed.
8
Men and women are known to have different body fat distributions with men carrying most of their fat in the abdominal region (i.e. apple shape) and women tending to carry most of their fat peripherally (i.e. pear shape); therefore, in general, men have larger WC measures than women. Thus, in men, WC provides information about visceral fat and also about total adiposity since most of it is stored centrally, and, in women, WC provides information regarding visceral adipose tissue, but may not tell us as much about total body adiposity, as body fat tends to be stored more peripherally in women. This relationship has made studying BMI and WC
challenging. Therefore, there are two distinct reasons for using WC, 1) as a measure of visceral adiposity and 2) as an indicator of total adiposity in circumstances where BMI may not be adequate (i.e. in men of normal or overweight status). The latter is rarely considered, but may have implications for some outcomes, such as KOA.
These uses of WC are subtle and often combined and thus overlooked in epidemiological studies of BMI and WC. In studies of cardiovascular disease risk factors, WC emerged as useful tool because it captured the risk of metabolically active visceral adipose tissue that was
minimized when BMI was used alone. In 1988, The National Heart Lung and Blood Institute (NHLBI) suggested sex-specific waist circumference cut-points (>102 cm in men and >88 cm in women) (52) based data from Glasgow, United Kingdom (53), which indicated that waist
9
and waist circumference be measured in clinical practice, and more recent research has proposed the following at-risk criteria for BMI and/or WC categories be used to achieve greater sensitivity than BMI alone for cardiovascular risk outcomes: Normal, BMI <25 kg/m2 and WC <90 cm, male (83 cm, female); Action Level I, BMI <30 kg/m2 and WC <100 cm, male (93 cm, female) or BMI ≥25 kg/m2 or WC ≥90 cm, male (83 cm, female); Action Level II, BMI ≥30 kg/m2 or WC ≥100 cm, male (93 cm, female) (55).
Several studies have been designed to explore and recommend the best measure to assess health risk, with continued interest in BMI and WC. Within all categories of BMI examined in the NHANES III sample, including normal weight (<25.0 kg/m2), overweight (25.0-29.9 kg/m2), and Class I obese (>30.0-34.9 kg/m2), those with greater waist circumference measures were more likely to have cardiovascular disease indicators (54). While some studies have found similar findings in support of measuring WC (56, 57), other studies have found that WC provides nothing more in addition to BMI (58, 59). It is possible that in studies finding that WC provides no additional information beyond that of BMI, the outcome of interest may not be strongly related to visceral adipose tissue or that BMI and WC are each measuring total body adiposity equally well (very highly correlated) and that after obtaining information from one measure, the other can tell you nothing more. Likewise, in studies that are showing a benefit to measuring WC in addition to BMI, the outcome of interest may be highly related to visceral adipose tissue (WC is important independent of the BMI effect) or it may be that in the population studied (i.e. normal or overweight men) that WC is simply a better indicator of adiposity than BMI.
10
conditions, and providing additional studies in areas such as KOA will help in recognizing the benefit, if any, in obtaining this measure.
Waist circumference and BMI in relation to knee osteoarthritis
Cross-sectional associations
BMI has been well studied in relation to KOA. WC has been less widely studied in
relation to KOA than has BMI. Older studies including those using data from NHANES and the Baltimore Longitudinal Study on Aging and the Chingford Study have found no advantages for the use of WC. Men and women carry their weight differently (50). Data examining the association between waist circumference and cardiovascular outcomes has indicated gender differences in the ability of waist circumference and BMI to predict risk (55, 60), such that after waist circumference is used to assess risk, BMI is able to identify additional men but not women at risk. Therefore, Zhu et al. suggest using a combination of BMI and waist circumference in men and waist circumference only in women to predict cardiovascular risk (55). This support for sex-specific cut-points has not been shown in KOA, and there are few studies that have
11
A recent analysis of NHANES data offered support for the use of WC. In a previous analysis of women from JoCo OA, we found that waist circumference offered no distinct advantage over BMI, after assessing for and taking measures to avoid collinearity in the models by including one variable as a continuous measure and the other as a categorical measure (58). It is plausible that the differences may lie in the degree of obesity, such that at very high BMIs, there is little or no difference in the measure used, whereas at lower BMIs, information provided by WC is more important in assessing risk. Indeed, the mean BMI in our sample was greater (~30.0 kg/m2) compared to the sample from NHANES III (25.1 kg/m2) (60). Furthermore, the outcomes of cardiovascular disease and KOA are different and obesity and fat distribution may act along different pathways. Thus, while the literature on using BMI or WC to assess risk of cardiovascular outcomes is extensive, it is not directly applicable to KOA. Though the
relationships of WC and WHR with various chronic disease outcomes, such as cardiovascular disease and diabetes, have been studied extensively (54, 60), very little work has been done in KOA.
12
Recently, investigators have begun to explore the issue of BMI vs. WC in KOA. In a cross-sectional study using data from NHANES III, Janssen and colleagues reported that both BMI and waist circumference were independently associated with rKOA and that increasing tertiles of waist circumference were associated with increased risk of within tertiles of BMI, for which the authors argued that both BMI and WC should be measured (64). As previously
mentioned, we found that WC offered no advantage over BMI or weight, but we did not examine the effect of body fat distribution or body composition measures within categories of BMI due to small numbers (58). Furthermore, our analysis was restricted to women whereas the NHANES III sample included both men and women with WC tertiles calculated based on the BMI tertiles in the sample (64). Therefore, depending on how many men or women were in each tertile of BMI, the waist circumference tertiles may have been skewed. Furthermore, Janssen et al.’s analysis showed that increases in the magnitude of association reached statistical significance in some but not all of the categories of BMI (64), perhaps due to small numbers, in particular for waist circumference/BMI tertile combinations. Finally, the NHANES III sample was older (mean age = 70.6 years) (64) compared to our study (mean age = 64.8 years) (58), and, as body fat distribution changes with age, it is possible that the NHANES III sample had increases in body fat or different body composition compared the women in our sample. There is certainly a need to further investigate the additional benefit of measuring waist circumference and BMI, as the work in this area is limited.
Longitudinal associations - Incidence
13
more likely to develop rKOA over four years of follow-up and that each 5-kg increase in weight was associated with approximately a 30% increase in risk of rKOA (65). In study of 354 men and women from a general practice in Bristol, United Kingdom, those in the highest compared to the lowest tertile of BMI were nine times more likely to develop rKOA defined as K/L grade ≥ 1 and were 18 times more likely to develop rKOA defined as K/L grade ≥ 2 over five years, though these estimates were fairly imprecise due to the small number of incident cases (n=45) (27).
A longitudinal study of men and women from Norway found that, compared to normal-weight individuals, overnormal-weight (BMI = 26-30 kg/m2) or obese (BMI >30 kg/m2) individuals were 2.02 (1.29, 3.16) and 2.81 (1.32, 5.96) times more likely to develop knee OA over ten years, respectively, after adjusting for age, gender, work type, and leisure time activities (66). As these findings are based on self-reported BMI and self-reported physician diagnosed knee OA data, it is likely that these individuals sought medical attention because they had symptomatic KOA. Nevertheless, these data further support that obesity is a strong risk factor for incident knee OA. Interestingly, weight earlier in life (approximately 35 years) did not appear to be associated with incidence of radiographic disease in some (28, 65, 67) but not all studies (68), suggesting an interaction between age and weight.
Longitudinal associations - Progression
14
individuals progress compared to normal individuals (69) and that heavier individuals are 1.5 to 2.5 times more likely to progress than lighter individuals, depending on the baseline disease status (27). Data from a group of Veterans with symptomatic rKOA showed that the odds of progression increased by 1.08 (95% CI: 1.00, 1.16) for every 2-unit increase in BMI after adjustment for age, sex, and limb alignment (70). Because the mechanism by which obesity is most likely to affect rKOA is biomechanical, this is one of several studies to have investigated limb alignment (38, 70-73). This work by Felson et al. further went on to show that, the relationship between progression of rKOA and BMI varied depending on the degree of limb alignment, with the strongest association among those with moderate malalignment (3°–6° either varus or valgus) (70). The authors postulated that increased BMI was not a strong predictor for radiographic progression among those with severe malalignment (≥7°) because, in these knees, the forces on the cartilage created by the malalignment were sufficient to cause damage
regardless of the effect of excess load by obesity status, though these associations were not statistically significantly different, and the authors did not report testing for interactions.
15
identification and treatment of rKOA because compared to weight loss as a strategy for prevention or treatment, re-aligning limbs may be more successful given the difficulty in
maintaining weight loss over time (74). To our knowledge, there have been no studies that have addressed the progression of sKOA or knee symptoms.
Unlike other KOA outcomes, the association between obesity and progression does not appear to be different in men and women, though these data are from a single cohort. Data from an elderly sample of the Framingham cohort indicated that women were not at greater risk for radiographic progression after adjustment for age, however the investigators did not adjust for obesity (75). In this same sample, women were not more likely than men to progress from unilateral to bilateral rKOA over approximately eight years after adjustment for age (75).
Weight change, weight maintenance, and knee osteoarthritis
16
It has been shown that weight-loss can reduce the odds of developing symptomatic KOA in women (77). Data from the Arthritis Diet and Activity Promotion Trial (ADAPT) showed that while modest weight loss, just 5.7%, reduced the pain and disability of KOA, no differences were seen in radiographic progression between the diet and exercise group and the healthy lifestyle intervention groups. Weight loss has been suggested as the one of the first line therapies for KOA (81, 82), yet weight-loss is difficult for the average individual to attain (74, 83). In addition, it is unclear as to whether weight-loss in fact prevents or delays the onset of rKOA. If this were true, identifying, targeting, and intervening on potentially high-risk populations could help reduce the burden of KOA.
Coggon and colleagues estimated from a case-control study of men and women from England that weight loss from an overweight or obese BMI status to a normal BMI category would have reduced the number of cases of primary knee OA severe enough to warrant surgical treatment by more than one-half (84). Data from the Framingham cohort supported this idea by showing that weight change over approximately 4 years was related to incident rKOA such that individuals that gained ≥5 lbs. tended to be at increased risk and those that lost ≥5 lbs. tended to be at reduced risk for incident rKOA compared to all others (28). Furthermore, data from this same study indicated that increasing weight (per 10 lb. increments) over approximately 4 years was associated with increased odds of developing rKOA (28). These data suggest that the effect of weight-loss may be significant, but these cohorts included homogenous samples and more evidence is needed to confirm these findings in more diverse samples.
17
period of time, where the starting weight and length of time vary depending on the scenario. For example, weight maintenance is often studied during the period following a weight loss trial, where the starting weight is the weight at the end of the intervention and the participants are followed for months or even years after to determine if and how much weight is re-gained.
An analysis of 2,617 women from NHANES I (baseline assessment 1971-75 and follow-up assessment 1982-84) indicated that weight change was not associated with self-reported physician-diagnosed arthritis after adjustment for baseline BMI, age, race, and education (78). In addition, among women who were classified as obese at baseline (BMI >29 kg/m2), those who gained weight (>10% of baseline) or maintained their weight (≤10% change from baseline) were at higher risk for incident self-reported physician-diagnosed arthritis compared to individuals at a healthy weight (BMI <25 kg/m2). Furthermore, those who lost weight (>10% baseline) did not have increased risk of physician-diagnosed arthritis. (78). Although this study suggests that weight maintenance may not decrease the risk of developing arthritis, the outcome was self-reported and included all types of arthritis and all joints. It is possible that weight maintenance may be more relevant to KOA. In addition, this population was restricted to women.
18
increased risk from ages 40 to 50 may indicate that these individuals had already begun the disease process and that the weight loss may not prevent disease progression. This study was also interesting in that it suggested that individuals who gained weight had higher risk estimates for developing severe KOA as those individuals who maintained an overweight status when both groups were compared to those who were normal weight from age 20 (85).
Drawing conclusions from the literature is difficult as each study has used different methods of assessing weight change and the time intervals also vary between studies. Much work needs to be done in this area to determine how weight change and, specifically, weight maintenance affects KOA outcomes.
Conclusion
Specific Aims
Knee osteoarthritis is a common chronic condition in the United States. BMI is a well-established risk factor for KOA, though fat distribution measures, such as WC, have been less widely studied. Nevertheless, there appear to be significant associations between fat distribution measures and KOA, though not independently of BMI. Moreover, very few studies have examined WC in association with the incidence and progression of KOA, and these included women only. In addition, the effect of weight change over time has not been widely studied in relation to KOA. Although weight loss has been shown to be an effective treatment for knee symptoms and to delay or prevent the onset of KOA, it is difficult to achieve and maintain, and weight maintenance may be a more attainable goal for some. However, weight maintenance has not been examined in relation to the onset and progression of KOA. Given the increasing obesity and the aging population, both of which are potent risk factors for KOA, it is critical to understand the relationship between obesity and KOA.
The goals of this study were to investigate the associations between BMI, WC, and weight change and the incidence and progression of KOA in a community-based sample of male and female Whites and African-Americans from a rural county in North Carolina. The specific aims of this research were to:
20
2) Determine the associations between weight change (i.e. weight loss, maintenance or gain) and the incidence radiographic KOA
These specific aims were met using information previously collected in the Johnston County Osteoarthritis Project (JoCo OA). The JoCo OA cohort is a community-based sample of over 3,000 Whites and African-Americans residing in a rural county in North Carolina. Extensive measures, including radiographic and symptomatic assessment of KOA,
Methods
This study used a community-based cohort of Whites and African-Americans from Johnston County, NC to investigate the associations between BMI, WC, and weight change and the development and progression of rKOA. We hypothesized that increased BMI, WC, and weight gain would be associated with the incidence and progression of rKOA while weight maintenance would offer some protection from or delay of the onset and progression of rKOA. This study uses existing data from the Johnston County Osteoarthritis Project; therefore, no new data collection was conducted.
Population
The Johnston County Osteoarthritis Project began in 1990 with funding through the Centers for Disease Control and Prevention (CDC). The study is now dually funded by the CDC and the National Institute of Arthritis and Musculoskeletal and Skin Diseases
(NIAMS). Established to estimate the prevalence of knee and hip OA, among Whites and African-Americans in a rural county in North Carolina, JoCo OA is a community-based sample designed to oversample African-Americans. Eligibility criteria for the study include being at least 45 years of age, civilian, non-institutionalized, African-American or Caucasian, a permanent resident of Johnston County for at least one year, and being mentally and
22
At the T0 examination, the participants were asked multiple questions in a home interview, which included a health questionnaire and demographical information. The participants then scheduled a clinic visit at which they underwent radiography of the knees and hips, a musculoskeletal and functional exam, anthropometry, and a blood draw. Participants then completed a second home interview. At T1 (approximately five to seven years later), these procedures were repeated (i.e. initial home interview, clinic visit, and second home interview).
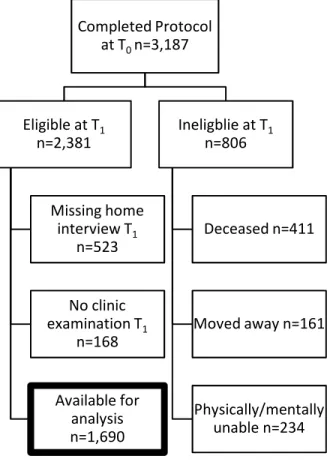
At T0, 3,187 individuals completed the home interview and clinical assessment, and, of these, 2,381 were eligible to participant at T1. Efforts were made to contact and
characterize the 806 individuals who were ineligible at T1, including those who moved away (n=161), were physically or mentally unable to participate (n=234), or were deceased
23
Figure 1.1. Status of participants in the Johnston County Osteoarthritis Project
Variables
The JoCo OA Project collected data on hundreds of variables at each time-point. Questionnaire data was collected by trained interviewers in the home of the participants as well as during the clinic visits and included, demographics, health information, and health behaviors. Other data, such as x-rays, musculoskeletal examination, and phlebotomy were collected by certified technicians and trained research staff. Table 1.1 contains a description of pertinent variables selected for this analysis. Information on these variables was also collected at T1.
Completed Protocol at T0 n=3,187
Eligible at T1 n=2,381
Missing home interview T1
n=523
No clinic examination T1
n=168
Available for analysis n=1,690
Ineligblie at T1 n=806
Deceased n=411
Moved away n=161
24
Table 1.1 Select variables collected in The JoCo OA Project
Description at T0 Demographics
Age Calculated from reported date of birth
Race White/Black, African American/Other
Gender Male/Female
Anthropometry
Height Measured, inches
Weight Measured, lbs
BMI (kg/m2) Calculated from height and weight Waist circumference Measured, cm
Health behaviors
Smoking Current smoker, Yes/No
Physical Activity Activity in past month, Yes/No Number of sessions/month Number of minutes/session
Radiographs
Knee osteoarthritis Yes/No based on K-L grades from weight-bearing anteroposterior films*
Other
Knee injury, Right/Left Ever injured, Yes/No *K-L = Kellgren-Lawrence
Outcome variables
25
Most commonly, radiographic KOA is defined as K-L grades ≥2 in either knee, and K-L grades 0 and 1 are included in the non-case group. This definition was used for these analyses. An incident case was defined as K-L grade 0 or 1 at T0 and K-L grade ≥ 2 at T1. A progressive case was defined as K-L grade 2 or 3 at T0 and +1 K-L grade at T1. Knees that were K-L 4 at T0 were excluded from analysis as they were unable to progress. During the study some participants underwent a total knee replacement (TKR). Information on the reason for the knee replacement was obtained at T1 by asking for each knee, “Have you ever had a knee joint replacement?” Possible answers included: no; yes, for OA; yes, for other reason; yes, do not know the reason. Because it was possible to determine the reason for the joint replacement, those knees that were disease free at T0 with a TKR at T1 were classified as a case if it was indicated that the TKR was for OA. For progression, because it could not be determined whether or not TKR was equivalent to an increase in radiographic grade, knees that had undergone a TKR over the follow-up were excluded. Radiographs were read paired at T1 by a single bone and joint radiologist. The inter- and intra-reader reliability has been shown to be excellent with kappa equal to 0.86 and 0.89, respectively (87).
Exposure variables
The main exposures included BMI, WC, and weight change. BMI and WC were evaluated both continuously and categorically. Categories were based on current guidelines (88) and thirds based on sex-specific cut-points the sample. Weight change was defined as the absolute difference in weight between T1 and T0. It was also represented as a percent change from the mean of weights at T0 and T1 (weightT1 - weightT0 / [(weightT1
26
Analytic strategy
Initial analyses included descriptive analyses of outcome measures, exposure
variables, and potential confounding factors. Examination of the exposure variables was also performed. Unadjusted bivariate relationships were examined for each of the exposure measures and each outcome of incidence and progression. Both person-based and knee-based analyses were evaluated. After completion of the initial analyses, multivariable modeling was performed. Data management and analysis was performed using both
Statistical Analysis System (SAS), Version 9.1 (SAS Institute, Cary, NC) as well as Stata/SE 10 (StataCorp LP, College Station, TX).
Statistical Models
Overview
The objective of Aim 1 was to determine the associations between BMI and WC and the incidence and progression of rKOA and to determine if WC provides additional
information regarding risk beyond that obtained by BMI. The exposures of BMI and WC were measured at T0 and the associations between each measure and each outcome, either development of rKOA or progression of rKOA, at T1. The analysis for Aim 1 included a comprehensive examination of each of these measures using both a categorical and continuous approach using flexible modeling.
The objective of Aim 2 was to determine the association between weight change and the incidence rKOA. The exposure of weight change was derived from the difference in weight between T0 and T1 and then was evaluated as a continuous variable and also
27
weight maintenance as an alternative to weight loss as a potential intervention to reduce or delay the onset of rKOA. A limitation of this aim is that data were available for only two time-points; therefore, it was not possible to determine whether weight change occurred prior to onset of rKOA.
Both Aim 1 and Aim 2 use the same statistical model, the proportional hazards form of the Weibull model, which is discussed in detail below. In Aim 1, the outcomes are the development and progression of rKOA at T1, while for Aim 2 the outcome was incident rKOA. The main difference is in the exposure variables such that Aim 1 examines BMI and WC measured at T0 and Aim 2 examines weight change over the interval between T0 and T1.
Models for Aim 1 were sex-specific and included age and race as covariates. Sex-specific models were used because body fat distribution is different between men and women (89, 90). Separate models were constructed to examine the various categories of BMI and WC. Because examination of linearity in the log hazard and categorical results provided evidence of non-linearity, spline regression was performed. Restricted cubic splines with knots at the 5th, 25th 50th, 75th, and 95th percentiles were evaluated for BMI and WC in men and women. Although both quadratic and cubic splines were evaluated and found to produce similar results, restricted cubic splines were chosen for comparison with the existing
literature on BMI and WC (91). Finally, in order to determine if WC provides additional information beyond that provided by BMI, models were constructed that included both BMI and WC.
28
T0 and with mean weight, were used to inform final models and the denominator for the percent change in weight categories. As BMI categories (normal, overweight, and obese) (88) are well recognized and used in both clinical and research settings, models were constructed to examine the effect of weight change on incident rKOA within each weight status category.
Other statistical approaches considered
Selecting a longitudinal statistical approach required careful consideration, and numerous models were evaluated (Appendix A). The considerations for the approach included: 1) ability to accommodate varying follow-up times 2) appropriate estimation of time to incidence and 3) adjustment for correlation between knees. Evaluation of various approaches considered each of these requirements and carefully rated how well each approach addressed these issues.
Since, restricting the dataset to individuals with equal follow-up time (i.e. 4 to 7 years) resulted in a loss of over 350 observations, the first criterion, accommodating varying follow-up time, was paramount. This requirement left us with two primary approaches for estimating the incidence and progression of rKOA using cohort data, Poisson Regression and Time-to-Event Analysis. The following discussion considers these two methods, beginning with Poisson Regression, in relation to the remaining three criteria listed above to support our final choice of a statistical approach.
29
difficult to assess because rKOA is not a sudden event and we have not fully characterized nor can we estimate with any precision from radiographs the exact timing of disease onset. In order to use Poisson Regression and obtain accurate parameter estimates, we would have to first create estimates of incidence for each individual. There are various ways to estimate incidence time from simply assigning the median follow-up time for each person who
developed the outcome to the more complex multiple imputation methods. Simple methods do not yield very accurate results (92); therefore, more complex methods using imputation (i.e. bootstrapping) would be required. While valid, these methods are time consuming, and furthermore, existing rKOA incidence time data, on which imputation would be based, are scarce. Therefore, the error potentially introduced by incidence time imputation might be greater than acceptable, which was a potential drawback for this approach.
The third criterion, adjustment for the correlation between knees, could easily be handled with the use of Generalized Estimating Equations (GEE) methodology. While the Poisson approach has the strengths of producing incidence rate ratios and can easily incorporate methods to adjust for the correlation between knees, the multiple imputation method for appropriately assigning incidence time is cumbersome and may introduce more error than is acceptable. These issues led us to evaluate Time-to-event Analysis as an alternate statistical approach.
30
function, which describes the probability that an event will occur at a particular time given that an individual has remained event-free up until that time. Using these models, we can estimate hazard rates and hazard ratios.
Two proportional hazards models were considered: the classic, semi-parametric Cox model, and the less widely used fully parametric Weibull model, which is similar to the Cox model, but where an underlying Weibull probability distribution for the event times is assumed (93). In our case, the Weibull model was more appropriate because it
accommodates interval censoring whereas the Cox model does not. Interval censoring arises when an event occurs during a widow of time (an interval) rather than at a specific,
identifiable, and measured time point (94). Interval censoring is critical to this analysis because, as previously mentioned, accurately accounting for time of rKOA onset is nearly impossible given the insidious nature of the disease. Since our study had only two time-points, T0 and T1, the interval in which disease onset could have occurred is defined and specific for each person as the time between T0 and T1.
While the Weibull model does not estimate an incidence time, per se, for each individual, it describes what happened to an individual during the course of study by accounting for three things for each person in the sample: whether or not the event (rKOA onset) occurred, the total follow-up time, and that individual’s covariate pattern. Using these three pieces of information, the Weibull model calculates a individual-specific probability density function and uses the product of these in forming the likelihood function (93, 94). This likelihood function is then maximized to produce the estimates that have the highest probability of representing what we have in fact observed (i.e., Maximum Likelihood
31
incidence time contributed by each individual, thus avoiding an additional source of error, but rather we are using information from our data and having the model estimate the likelihood from this information.
Finally, the last criterion, adjustment for the correlation between knees, was feasible using the Weibull approach, though only using STATA software. In considering these two approaches, both appropriately met the first criterion. The second criterion was more adequately met by the Weibull model as it accommodated interval censoring and more accurately handled the issue of unknown time to onset of rKOA by avoiding error potentially introduced by the use of imputation for the Poisson model. Adjustment for the correlation between knees can be easily applied to both models. For these reasons, the Weibull model was chosen as the best statistical approach to answer our proposed questions.
Initial weight value: Aim 2
A final methodological decision involved issues surrounding the inclusion of the initial weight value in models that include change in weight. Despite being long-recognized as problematic (95-98), there is no consensus on the best methodological approach. The problem arises when a variable is measured with error. Although the measurement from the scale is small, individual fluctuation in weight at the time of measurement, due to hydration status or time of day, may be quite large. This error is especially problematic when
32
also included change in weight from T0 and T1, Glymour et al. have shown that the negative association between the initial value and the change score creates spurious associations in regression models and causes inflated estimates and recommend that models not include initial values when studying change (97). However, not including initial value may also be problematic if the initial value is truly associated with the change score, as was observed in our data. In the case of weight, heavier individuals tend to gain more weight than leaner individuals and therefore, initial weight is positively associated with weight change. Since weight is also associated with the outcome in this study, rKOA, initial weight confounded the association between weight change rKOA.
Statistical methods to reduced or eliminate the associations due to error have been proposed, such as using the mean value of the initial and final values (95, 98). In this way, since mean weight and the change in weight are statistically independent, models including both variables provided less biased results. All of these models are examined in greater detail below. For these reasons, all models examining weight change including mean weight as a covariate. Similarly, In the case of percent weight change, it was decided that using mean weight as the denominator would be more appropriate than using weight at T0.
33
Aim 1. Associations between BMI and WC and the
incidence and progression of radiographic KOA
Abstract
Objective: BMI is a well-established risk factor for incident radiographic knee osteoarthritis
(rKOA), but few studies have examined the association with waist circumference (WC). The purpose of this study is to examine the relationships of BMI and WC with the incidence and progression of rKOA and determine if WC adds additional information beyond that provided by BMI. Methods: Data were from the Johnston County Osteoarthritis Project, a
longitudinal study of African-Americans and Whites aged 45 years and older in Johnston County, NC from 1990 - 2003 (n=1,690). Age and race adjusted Weibull proportional hazards models were used to calculate sex-specific hazard ratios of BMI and WC with rKOA overall and within normal, overweight, and obese categories. Results: For incidence, among men, increasing thirds of WC were associated with increased rKOA (lowest
34
smaller in magnitude among women and similar among men. Conclusion: For men, but not women, WC provided additional information regarding risk of rKOA beyond that provided by BMI, especially among the overweight. This work supports recommendations to measure WC in addition to BMI in overweight men.
Introduction
Measurement of waist circumference (WC) in addition to body mass index (BMI) has been recommended for the assessment of the risk of diabetes and cardiovascular disease (55, 88, 99, 100). While BMI is well-established as an important risk factor for radiographic knee osteoarthritis (rKOA), less is known about the importance of WC. Currently measurement of WC is not usually included in an assessment of risk of rKOA. Although there are several studies confirming the association between BMI and rKOA (11, 13, 27, 29, 65, 75, 101), few longitudinal studies have examined men and women separately. Of the prospective studies of BMI and the incidence and/or progression of rKOA (27, 28, 65, 101-105), three studied only women (65, 102, 104), and one examined men and women separately (28). Gender-specific studies of associations of BMI and WC could be important because of the well known and large differences in body composition and body circumferences in men and women.
35
(58). Similarly, in a cross-sectional study of middle-aged women from the United Kingdom, WC was not associated rKOA after adjustment for BMI (12). However, in an analysis of men and women using data from the Third National Health and Nutrition Examination Survey (NHANES III), which studied BMI and WC using thirds of the sample distribution, indicated that the middle and upper thirds of WC categories were associated with rKOA within the middle and upper categories of BMI (64). That study was cross-sectional, and, other than two recent longitudinal studies that examined WC as a predictor of knee
osteoarthritis severe enough to require surgery (106, 107), we know of no longitudinal studies that have examined the relationship between WC and rKOA in men and no prospective studies that have examined the relationship between WC and radiographic progression in either men or women.
With the high prevalence (9) and projected increases in obesity (108) in the United States and the high prevalence of arthritis (2) in the aging population, it is critical to
36
Methods
Study Design
The Johnston County Osteoarthritis Project, which began in 1990, is an ongoing, population-based cohort study designed to estimate the incidence and progression of knee and hip osteoarthritis among African-Americans and Whites in a rural county in North Carolina. The sampling methods and study protocol have been previously reported (87). Individuals from the civilian, non-institutionalized population of Johnston County were eligible for participation if they were at least 45 years of age, African-American or
Caucasian, a permanent resident of Johnston County for at least one year, and were mentally and physically able to complete the study protocol.
Data for this longitudinal analysis were collected at two time-points, T0 (1990-1998) and T1 (1999-2003), and included those who completed a home interview and examination at the research clinic. At T0, 3,187 individuals were enrolled in and completed the study
37 Measurements
Radiographic changes were measured with the use of the Kellgren-Lawrence (K-L) scale (109). This scale uses four grades (0-4) to assess the presence and severity of disease with 0 = none; 1 = doubtful OA characterized by questionable joint space narrowing; 2 = minimal OA characterized by definite presence of osteophytes and possible joint space narrowing; 3 = moderate OA characterized by multiple osteophytes, joint space narrowing, some scelerosis, and possible bone deformity; and 4 = severe OA characterized by large osteophytes, marked joint space narrowing, severe sclerosis, and definite bone deformity (109).
All radiographs were taken in the anteroposterior (AP) view with weight-bearing and were read by a single bone and joint radiologist. The inter- and intra-reader reliability have been previously reported with kappa equal to 0.86 and 0.89, respectively (87).
Height, in inches, was measured using a stadiometer, and weight, in pounds, was measured using a balance beam scale. BMI was calculated as weight (kg) divided by height squared (m2). Waist circumference was measured in centimeters at the height of the
umbilicus. Prior knee injury (yes/no), smoking (never, past, current), and education (≥ high school/< high school) were self-reported in study questionnaires.
Participants at risk for incidence and progression
38
visual inspection of 2-way plots between BMI and WC. Points designated as implausible fell more than 4 standard deviations outside the bounds of the correlation between the 2 variables
Both knees were evaluated separately for each participant. Knees were excluded if K-L grades were missing at T0 or T1 (25 in men, 97 in women) or if a total knee replacement (TKR) had been performed on the knee before T0, (2 in men, 14 in women). Following these exclusions data were available from 1,143 knees from men and 2,071 knees from women (Figure 2.1).
Incidence was defined as K-L grade 0 or 1 at T0 and K-L grade ≥ 2 at T1 (109) Knees of participants who had undergone a TKR during the follow-up (2 knees in men, 6 knees in women) and indicated the reason was for osteoarthritis were considered incident cases because it was likely that the K-L grade was ≥ 2 prior to the surgery. The sample for the studies of incidence included 1,017 knees from 542 men and 1,757 knees from 931 women (Figure 2.1). Progression was defined as K-L grade 2 or 3 at T0 and an increase of at least 1 K-L grade at T1. Since an increase in K-L grade (i.e. progression) prior to TKR could not be confirmed, knees that had undergone at TKR were excluded (4 knees in men, 30 knees in women). Using these criteria there were 109 knees from 88 men and 261 knees from 189 women included in the analyses of progression (Figure 2.1).
Statistical Analysis
39
event is measured only to occur during a widow of time (an interval) and not at a specific, identifiable time point (94). Because rKOA onset is not a sudden event, and the exact date of its onset cannot be known with certainty, interval censoring was intrinsic to this analysis. Since our study had only two time-points, T0 and T1, the interval in which disease onset could have occurred is defined and specific for each person as the time between T0 and T1.
Sex-specific Weibull proportional hazards models were constructed to estimate the association between BMI or WC and incident rKOA or rKOA progression. BMI and WC were categorized two ways, 1) using recommended National Heart, Lung, and Blood Institute (NHLBI) cut-points (88) (BMI: underweight, <18.5 kg/m2; normal, 18.5 – 24.9 kg/m2; overweight, 25.0 – 29.9 kg/m2; obese, ≥ 30 kg/m2, WC: >102 cm (men) and >88cm (women)) and 2) using sex-specific thirds. The referents for these categories were defined as the lowest third or the normal weight BMI category (18.5 – 24.9 kg/m2).
Finally, to determine if WC provided additional information beyond BMI, models were constructed to include both WC and BMI. Additionally, WC and BMI were modeled within categories of BMI (<18.5 kg/m2, 18.5 – 24.9 kg/m2, 25.0 – 29.9 kg/m2, ≥ 30 kg/m2). Categories of BMI and WC were created based on sex- and BMI category- specific thirds. Examination of both WC and BMI in these models enabled a more careful evaluation of the separate associations of these highly correlated measures with rKOA.
40
(HR) estimate with the subsequent removal of each covariate. Covariates were retained when the change in estimate was ≥ 10% (110, 111). All of these covariates were removed from the models because the estimates for BMI and WC remained essentially unchanged. Adjustment for the correlation between the right and left knees was achieved using a robust standard error for correlated measures. Analysis was performed using Stata/SE 10 (StataCorp LP, College Station, TX).
Results
Table 2.1 describes both the incidence and progression samples at T0 by sex-groups. In the incidence sample, approximately one-fifth of men and one-third of women were
African-American. Among men, during the follow-up time [mean (SD) = 5.7 yrs (1.3), range = 3.6-11.0 years], rKOA developed in 152 knees (15.0%). Among women, during the
follow-up time [mean (SD) = 6.1 yrs (1.3), range = 3.6-13.2 years], rKOA developed in 265 knees (15.1%). The correlation between BMI and WC was 0.88 among men and 0.83 among women.
Compared to the incidence sample, the progression sample included a higher
41 Incidence analysis
We evaluated the associations of BMI and WC with incident rKOA two ways, using sex-specific thirds and NHLBI recommended cut-points. For the analysis of thirds, in men, compared to knees from men with a BMI in the lowest third, knees from men in the middle and upper thirds of BMI were at increased risk (Table 2.2), but a monotonic increase across categories was not observed. Compared to men in the lowest third of WC, those in
increasingly higher categories of WC were more likely to develop rKOA. The estimates across comparable thirds tended to be larger for WC than for BMI. Second, when we evaluated the data using the recommended NHLBI cut-points, compared to normal weight men, those in overweight and obese categories were more likely to develop rKOA and the hazard ratios tended to increase across weight status groups. For WC, men with a WC greater than 102 cm were 55% more likely to develop rKOA compared to those with WC measurement less than 102 cm (Table 2.2).
Among women, when BMI and WC were categorized into thirds, compared to the lowest third, women in the middle and upper thirds were increasingly more likely to develop rKOA. When NHLBI cut-points were used, overweight women were nearly 1.6 times and obese women were more than 3 times as likely to develop rKOA compared to those of normal weight, and women with a WC greater than 88 cm were more than twice as likely to develop disease (Table 2.2).
42
middle [1.02 (0.60, 1.74)] and upper [0.80 (0.42, 1.50)] thirds of BMI, compared to men in the lowest third of BMI, were not at increased risk. Among women, in models that included both BMI and WC, comparing the upper third to lowest, both BMI [1.74 (1.02, 2.95)] and WC [2.15 (1.21, 3.81)] were significantly associated with rKOA. Comparing the middle to lowest thirds, both BMI [1.14 (0.68, 1.91)] and WC [1.41 (0.83, 2.40)] indicated elevated risk, though the increases failed to reach statistical significance.
Finally, Table 2.3 shows results from another strategy to compare the effects of BMI and WC. Here the risk of BMI and WC thirds were examined within weight status groups. In men, WC was associated with a significant increase in risk in upper compared to lower thirds only in men in the overweight category. For BMI, the risk estimates were also not uniformly increased across thirds among normal weight men, and the hazard ratio in the second BMI third tended to be lower than that in the first. In women, the highest third of both WC and BMI was associated with increased risk in all the weight status categories, although the estimates were sometimes small (example 1.13 for BMI in normal weight), and were not always statistically significant.
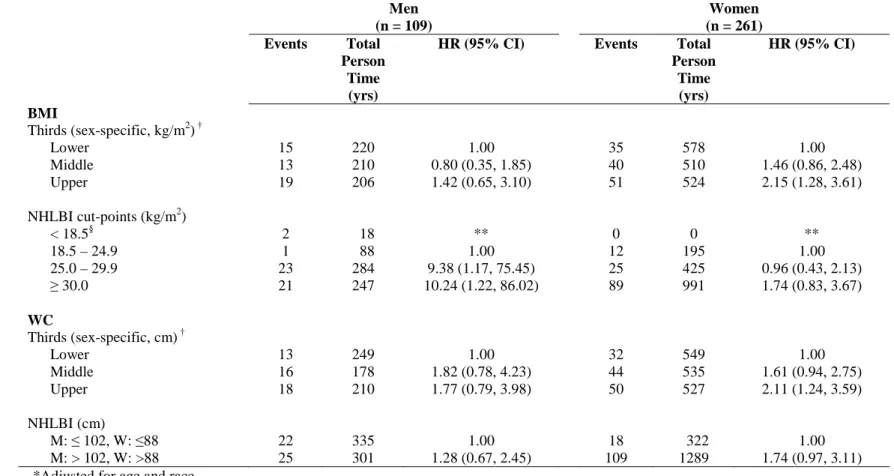
Progression analysis
43
and obese men were at increased risk for progression. Using the recommended cut-point for WC, men with a higher WC were not at significantly increased risk (Table 2.4).
Among women, when BMI and WC were categorized into thirds, increasing categories were associated with increased risk of progression for both measures, and the magnitude of the estimates were also similar. When NHLBI cut-points were used, compared to normal weight women, increased risk was observed for obese women, but not overweight women. In addition, women with a WC greater than 88 cm were 1.7 times as likely to progression compared to women with a WC less than 88 cm (Table 2.4).
For men, in models that included both BMI and WC simultaneously, with both expressed in thirds, compared to the lowest third of BMI, neither the middle [0.43 (0.14, 1.32)] nor the upper [0.75 (0.21, 2.63)] third of BMI was at increased risk. However, compared to the lowest third of WC, both the upper [2.15 (0.55, 8.40)] and middle [2.87 (0.95, 8.63)] thirds were at increased risk, though the increase failed to reach statistical significance. For women, when BMI and WC were in the same model, the estimates for the upper [1.64 (0.64, 4.19)] and middle [1.20 (0.63, 2.29)] thirds compared to the lowest third of BMI were similar compared to those for the upper [1.64 (0.65, 4.19)] and middle [1.39 (0.73, 2.67)] thirds of WC.
44
Discussion
This study provides a comprehensive examination of BMI and WC and the incidence and progression of rKOA among a bi-racial cohort of men and women from Johnston County, NC. Our results suggest that, among men, WC may be as good or better indicator of rKOA risk than BMI, especially among men with BMIs ranging from 25.0 to 29.9 kg/m2. This study also confirms that, in women, after accounting for BMI, WC does not provide
additional information about the risk of developing rKOA. Additionally, our results confirm that the relationship of BMI with rKOA progression does not appear to be as strong as was observed for incidence.
Few studies, one cross-sectional (13) and two longitudinal (23, 28), have examined BMI or weight in relation to rKOA in men, and in most analyses higher BMIs were
associated with increased risk. In a cross-sectional study using data from the Baltimore Longitudinal Study of Aging (BLSA), men in the lowest third compared to men in the
45
adjusted for weight change simultaneously. Our results are consistent with those from BLSA (13) and the earlier and more statistically powerful study of the Framingham cohort (23) that indicated that men with higher BMIs (i.e. greater than 30 kg/m2) were at increased risk for incident rKOA.
In women, longitudinal studies have indicated strong associations between BMI and incident rKOA including a study a women in the United Kingdom (65), an analysis of black and white women in Michigan (102), and an analysis from the Framingham cohort (75), and our results support these previous findings. Compared to BMI, studies of WC and rKOA are less common. In a previous cross-sectional analysis of women in this same cohort, we found that measures of body fat distribution, including WC and waist-to-hip ratio, and measures of body composition offered no advantage over BMI or weight (58). The results of this
longitudinal analysis support our prior result. Similar findings have been reported in a longitudinal study of women in Michigan (102), and in cross-sectional analyses of data from NHANES III (64) and from a cohort of women in the United Kingdom (12). In both cross-sectional studies, when BMI was added to models containing WC, the estimate for WC was attenuated. These findings suggest that BMI appears to be an adequate predictor of rKOA risk compared to WC.
46
the highest [2.91 (1.06, 8.00)] and middle [OR=1.25, (0.50,3.16)] thirds of WC. In our study men in the middle and upper thirds of WC were at increasing risk of rKOA, while men in the middle and upper third of BMI were at similar risk. These differences may be due to study design (cross-sectional vs. longitudinal) or the samples studied and the category cut-points. The cut-points were not provided for the NHANES III sample, and thus could not be directly compared to the ones used here.
In the same study of NHANES III (64), investigators examined the association of WC within thirds of BMI and found that increasing thirds of WC were significantly associated with rKOA in the middle third of BMI in an analysis that included both men and women. In addition, they found that increasing BMI thirds was also associated with rKOA within both the middle and upper thirds of WC. The authors concluded that both BMI and WC have effects independent of one another in relation to rKOA. Since associations of both WC and BMI with rKOA could increase within, as well as between, the standard BMI categories, we were concerned that associations of WC with rKOA within BMI categories might not indicate an additional effect of WC, i.e., an effect that was independent of BMI. To aid our interpretation of results within BMI categories, we examined both BMI and WC using a similar approach.
47
third, and this association was not seen with BMI thirds. Therefore, our work provided some evidence that WC may increase the risk prediction of rKOA in overweight men more than BMI alone, especially since the effect of WC in overweight men was relatively large (hazard ratios were over 3.5 for the upper thirds compared to the lowest third).
Nevertheless, it is possible that the association of BMI with KOA in overweight men was attenuated compared to that of WC because the approach used restricted the values of BMI within each weight status category while WC was allowed to vary. It is also possible that this finding was not an artifact, but instead occurred because WC separated overweight men into body composition categories indicating different amounts of lean versus fat mass in men with similar BMI levels. In men, BMI has been shown to correlate better with lean mass (ρ=0.73) than with percent body fat (ρ=0.65) (45), and some of the men in the overweight category may not have had elevated body fat, but instead had an elevated BMI due to having a large muscle mass. These men with elevated muscle mass may be at lower risk of rKOA compared to men with a similar BMI, but with less muscle mass, though this has not been studied. This differentiation of muscle and fat mass could be less critical for the prediction of rKOA in normal weight men and in obese men compared to overweight men, and therefore the additive value of WC was not seen in those groups. Future work in which body composition is measured directly will be needed in order to fully understand the possible interplay between muscle mass, fat mass and rKOA in men.
48
(27, 101). Cooper et al. found no association across all categories of BMI and rKOA progression (27), while Reijman et al. found a positive association between the highest category of BMI and rKOA progression. In both cases, estimates for the association between BMI and rKOA progression were not as large as for the association between BMI and
incident rKOA (27, 101). We also found that the estimates for the association between BMI and rKOA were smaller than those for BMI and incident rKOA in men and women.
Though we observed large estimates for NHLBI BMI categories in men, this was due to only one event among normal weight men, and no association was found between BMI and rKOA progression in men. Among women, our findings are similar to those of Reijman et al. where we found increased risk for rKOA progression among those women in the highest category of BMI. In both men and women estimates for BMI and WC were similar, and both estimates were attenuated with additional adjustment for the other (i.e. BMI adjusted for WC and WC adjusted for BMI), suggesting that WC provides no additional information beyond that provided by BMI, in regard to risk of rKOA progression.
The study of BMI and WC is complicated by the high correlation between these two measures. Nevertheless, independent effects, as seen in this analysis, have been observed when both measures are examined simultaneously (91). In addition, the units of BMI and WC are different (kg/m2 vs. cm), and this makes direct comparison between estimates difficult. One method used in the literature to overcome this issue is standardization of beta coefficients. This approach has the limitation that estimates are influenced by the