MBoC
|
ARTICLE
Spatial analysis of Cdc42 activity reveals a role
for plasma membrane–associated Cdc42 in
centrosome regulation
ABSTRACT The ability of the small GTPase Cdc42 to regulate diverse cellular processes de pends on tight spatial control of its activity. Cdc42 function is best understood at the plasma membrane (PM), where it regulates cytoskeletal organization and cell polarization. Active Cdc42 has also been detected at the Golgi, but its role and regulation at this organelle are only partially understood. Here we analyze the spatial distribution of Cdc42 activity by moni toring the dynamics of the Cdc42 FLARE biosensor using the phasor approach to FLIMFRET. Phasor analysis revealed that Cdc42 is active at all Golgi cisternae and that this activity is controlled by Tuba and ARHGAP10, two Golgiassociated Cdc42 regulators. To our surprise, FGD1, another Cdc42 GEF at the Golgi, was not required for Cdc42 regulation at the Golgi, although its depletion decreased Cdc42 activity at the PM. Similarly, changes in Golgi morphology did not affect Cdc42 activity at the Golgi but were associated with a substantial reduction in PMassociated Cdc42 activity. Of interest, cells with reduced Cdc42 activity at the PM displayed altered centrosome morphology, suggesting that centrosome regulation may be mediated by active Cdc42 at the PM. Our study describes a novel quantitative approach to determine Cdc42 activity at specific subcellular locations and reveals new regula tory principles and functions of this small GTPase.
INTRODUCTION
Tight spatial regulation of the small Rho GTPase Cdc42 is required for many cellular processes, including cell polarity, cell survival, ad-hesion, migration, cell cycle progression, and membrane trafficking (Coso et al., 1995; Nobes and Hall, 1995; Kroschewski et al., 1999; Etienne-Manneville and Hall, 2001). Each of these functions de-pends on regulated localization and activation of Cdc42, which is achieved through its recruitment to a specific cellular membrane. Membrane association of Cdc42 is necessary for its activation and
requires the modification of its C-terminal end with a geranylgeranyl anchor (Michaelson et al., 2001). Activation is catalyzed by guanine nucleotide exchange factors (GEFs) and guanine nucleotide disso-ciation inhibitors (GDIs), which assist in the translocation between the membrane and cytosol (Ku et al., 2001; Michaelson et al., 2001; Salazar et al., 2003; Egorov et al., 2009). Membrane trafficking has also been found to be critical for control of Cdc42 localization and activation (Osmani et al., 2010).
Monitoring Editor Rong Li
Johns Hopkins University
Received: Sep 19, 2016 Revised: May 5, 2017 Accepted: May 15, 2017
This article was published online ahead of print in MBoC in Press (http://www .molbiolcell.org/cgi/doi/10.1091/mbc.E16-09-0665) on May 24, 2017.
K.A.H. and C.S. conceived and designed the experiments; K.A.H. performed the experiments; K.A.H. analyzed the data; K.A.H., K.M.H., E.G., M.A.D., and C.S. drafted the article; K.A.H. prepared the digital images; A.L.T. performed migration experiments; C.D. aided with cloning and data analysis; E.O. devel-oped the Cdc42-FLRE biosensor; K.M.H. provided the Cdc42-FLARE biosensor; E.G. provided FRET expertise; M.A.D. provided microscope and FLIM-FRET expertise.
*Address correspondence to: Christine Sütterlin ([email protected]).
© 2017 Herrington et al. This article is distributed by The American Society for Cell Biology under license from the author(s). Two months after publication it is avail-able to the public under an Attribution–Noncommercial–Share Alike 3.0 Unported Creative Commons License (http://creativecommons.org/licenses/by-nc-sa/3.0). “ASCB®,” “The American Society for Cell Biology®,” and “Molecular Biology of
the Cell®” are registered trademarks of The American Society for Cell Biology.
Abbreviations used: CBD, Cdc42-binding domain; FLIM, fluorescence lifetime imaging; FRET, Förster resonance energy transfer; GAP, GTPase-activating pro-tein; GDI, guanine nucleotide dissociation inhibitor; GEF, guanine nucleotide exchange factor; ManII, mannosidase II; PM, plasma membrane.
Kari A. Herringtona, Andrew L. Trinhb, Carolyn Danga, Ellen O’Shaughnessyc, Klaus M. Hahnc,
Enrico Grattona,b,d, Michelle A. Digmana,b,d, and Christine Sütterlina,*
Fluorescence lifetime imaging (FLIM) is a powerful method to measure FRET. It detects the specific rate of fluorescence decay, or lifetime, of only the donor fluorophore, which is constant unless an acceptor fluorophore is close enough to absorb the emitted en-ergy, for example, when FRET occurs (Elangovan et al., 2002). FLIM is superior to traditional intensity-based ratiometric methods because it eliminates fluorescence artifacts inherent to biosensor design, which may lead to false measurements of Rho GTPase activity (Wallrabe and Periasamy, 2005; Hinde et al., 2012). For example, FRET detection by FLIM eliminates the effects of varia-tions in biosensor concentration on activity measurements (Hinde et al., 2012). FLIM measurements also avoid issues with spectral bleedthrough, channel alignment, and photobleaching (Chen et al., 2003; Wallrabe et al., 2006). Because the fluorescence life-time is sensitive to changes in the cellular environment, FLIM can be performed in living cells, which avoids fixation artifacts (Michaelson et al., 2001; Chen et al., 2003; Wallrabe and Pe-riasamy, 2005). In addition, FLIM can readily differentiate between different fluorophore species and generate quantitative maps showing the average fraction of molecules at a given location that are undergoing FRET (Hinde et al., 2012).
FLIM data can be readily analyzed using the phasor approach, which describes the transformation of the numerous exponential fluorescence decay curves of each pixel into a two-dimensional plot called the phasor plot (Digman et al., 2008). This transforma-tion plots each pixel to a unique place on the phasor plot accord-ing to lifetime. Because the phasor plot is directly linked to the image, it allows the mapping of the lifetimes back to the image to provide a clear view of spatial changes in lifetime within the image. Overall, the phasor approach to FLIM simplifies the analysis of large FLIM data sets and provides a global view of FLIM data inside a cell.
This study aimed at identifying factors that control Cdc42 activity at the Golgi. Using the phasor approach to FLIM-FRET, we show that the activity of Cdc42, which was present throughout the Golgi, was regulated by ARHGAP10 and Tuba but not FGD1. Although Cdc42 activity at the Golgi was independent of Golgi structure, a connected Golgi ribbon was necessary for Cdc42 activity at the plasma membrane (PM). Finally, we found that Cdc42 activity at the PM, not the Golgi, contributed to the control of centrosome organi-zation and function.
RESULTS
Spatial detection of Cdc42 activity using the phasor approach to FLIMFRET
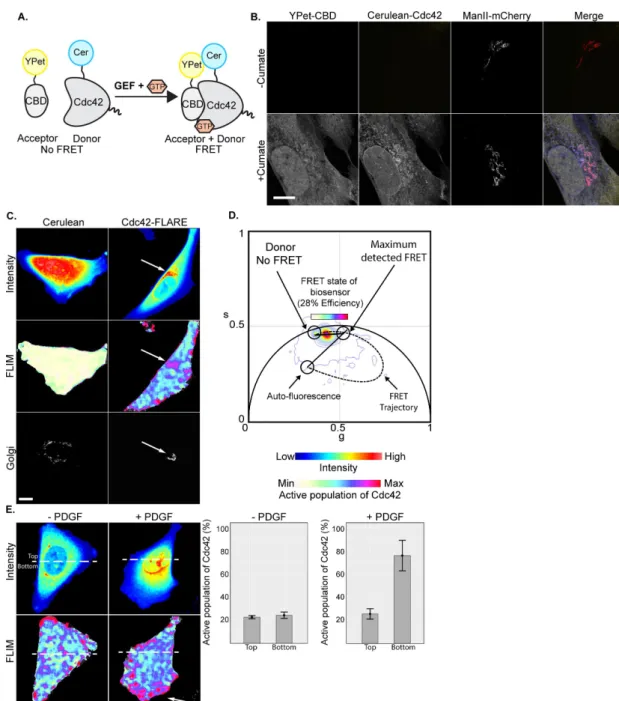
We generated a stable cell line expressing the Cdc42-FLARE bio-sensor, which employs the cerulean/YPet FRET pair in a dual-chain design (donor fluorophore on the N-terminus of Cdc42, acceptor fluorophore YPet on the CRIB domain of the Cdc42 effector N-WASP; Figure 1A). To avoid excessive expression of the biosensor and achieve similar expression levels in all cells, we generated a stable clonal U2OS (human osteosarcoma) cell line that expresses Cdc42-FLARE from an inducible promoter. Induction for 48 h resulted in expression levels of the biosensor that were about eightfold higher than those of endogenous protein (Supplemen-tal Figure S1A) but did not affect cell morphology or function (Supplemental Figures S1B and S2). The imaging cell line also constitutively expressed the Golgi protein mannosidase II (ManII) fused to mCherry to label the medial-Golgi cisternae (Figure 1B). We routinely induced this imaging cell line for 48 h, which led to an enrichment of cerulean-Cdc42 at the Golgi, as previously re-ported (Erickson et al., 1996; Michaelson et al., 2001). To evaluate Cdc42 is proposed to be a functional component of the Golgi.
The localization of this small GTPase to the Golgi was detected with diverse methods, including fractionation, immunofluorescence, and electron microscopy (Erickson et al., 1996; Luna et al., 2002; Matas et al., 2004; Osmani et al., 2010). Golgi-associated Cdc42 is active, as observed directly through biosensor experiments and indirectly through visualization of the Cdc42 effectors Arp2/3 and N–Wiskott– Aldrich syndrome protein (N-WASP) at the Golgi (Luna et al., 2002; Nalbant et al., 2004; Dubois et al., 2005; Baschieri et al., 2014). Cdc42 at the Golgi has been implicated in typical Golgi functions because disrupting its activity caused defects in protein transport through the Golgi (Wu et al., 2000; Luna et al., 2002; Egorov et al., 2009; Hehnly et al., 2009; Park et al., 2015). It has also been linked to the regulation of centrosome organization and function (Kodani et al., 2009). However, it is not clear whether the Golgi-associated pool of Cdc42 is controlling these processes because it has not been possible to selectively disrupt the activity of this specific pro-tein population.
Several factors have been implicated in the regulation of Cdc42 activity at the Golgi. Two Cdc42-specific GEFs, Tuba and FGD1, are reported to localize to the Golgi. Tuba was observed at the Golgi in rat brain cryosections and in the perinuclear region of HeLa cells (Salazar et al., 2003; Kodani et al., 2009), and FGD1 lo-calized to the trans-Golgi of HeLa, COS-7, and MC3T3 osteoblasts (Estrada et al., 2001; Egorov et al., 2009). Golgi membranes also host the Cdc42-specific GTPase-activating protein (GAP) ARH-GAP10 (Dubois et al., 2005). In addition, GM130 and coronin7, two resident Golgi proteins without typical GEF and GAP domains, are proposed to contribute to Cdc42 regulation at the Golgi (Kodani et al., 2009; Bhattacharya et al., 2016). Biochemical assays in total cell lysates showed that GM130 controls ∼50% of cellular Cdc42 activity (Kodani et al., 2009). This peripheral Golgi protein is proposed to contribute to Cdc42 regulation by binding and sequestering RasGRF2, a Ras GEF that binds inactive Cdc42 at the plasma membrane (Calvo et al., 2011; Baschieri et al., 2014). Coronin7, in contrast, may limit Cdc42 activity at the Golgi. Its loss resulted in excessive N-WASP–mediated actin polymerization at the Golgi and a disrupted Golgi phenotype (Bhattacharya et al., 2016). In spite of these studies, it remains unclear whether these regulatory proteins actually contribute to the control of Cdc42 activity at the Golgi.
enough to allow an interaction between these two proteins and fairly constant between samples (unpublished data). For this en-tire study, we focused on cells with a maximum of one to three neighboring cells, so the majority of its PM was not in contact with other cells.
donor and acceptor concentrations under these experimental conditions, we analyzed cells by cross-raster image correlation spectroscopy (ccRICS), a fluctuation method that detects protein complexes that are mobile and diffusing together. ccRICS re-vealed that donor and acceptor protein concentrations were high
maximal detected FRET efficiency was 28% for our experimental conditions (Figure 1D). Given that this biosensor is either on or off, the line that connects the high FRET (“on”) state to the no FRET (“off”) state of the phasor describes the fractional population of the active biosensor. In this study, the results are reported as the fraction of active Cdc42 molecules, with 0% showing no active small GTPase and 100% indicating the highest detectable fraction of active Cdc42. Cerulean-Cdc42 was enriched in the perinuclear region of Cdc42-FLARE–expressing cells, where it colocalized with the Golgi marker ManII-mCherry (Figure 1C, right). In these cells, the fraction of active Cdc42 molecules was highest at the Golgi and PM compared with the rest of the cell (Figure 1D; Hinde et al., 2012). These data are consistent with reports by the Hahn lab with the MeroCBD bio-sensor, which detected activity of endogenous Cdc42 at the Golgi in nonpolarized cells (Nalbant et al., 2004).
We validated our assay by monitoring Cdc42 activity at the lead-ing edge of polarized cells, a well-established site of active Cdc42 (Nalbant et al., 2004; Monypenny et al., 2009; Hanna et al., 2014). We stimulated cell polarization and migration in collagen I–coated chemotaxis chambers using platelet-derived growth factor (PDGF) and performed FLIM-FRET measurements. As expected, there was high FRET at the leading edge of the cell (arrow) during cell migration, which was ab-sent from unstimulated control cells (Figure 1E and Supplemental Figure S3). Similarly, higher levels of FRET were also detected throughout cells that transiently expressed a constitutively active form of the Cdc42-FLARE biosensor compared with the wild-type biosensor (Supplemental Figure S4).
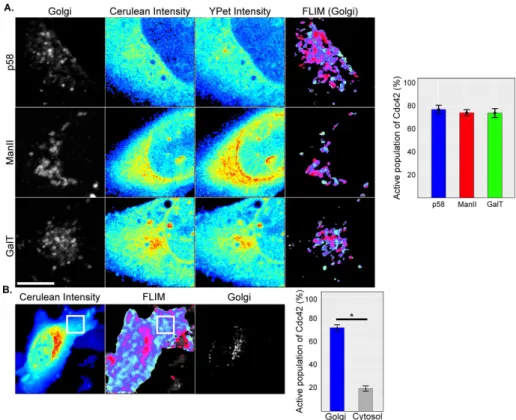
We next monitored Cdc42 activity at indi-vidual Golgi cisternae. We generated addi-tional U2OS cell lines that inducibly ex-pressed Cdc42-FLARE together with low levels of specific cis- or trans-Golgi markers (Figure 2A). To increase the resolution at the Golgi, we focused on a 25.29 × 25.29 µm2
region (∼100 nm/pixel), which we found to be the smallest area to contain most Golgi membranes. Cdc42-FLARE was enriched at the Golgi in each of the cell lines. To isolate Cdc42 activity at each individual Golgi cis-ternae, we overlaid the FLIM data with a mask of Golgi cisternae–specific markers, which we generated by thresholding images of mApple-p58, ManII-mCherry, or GalT-mCherry recorded in parallel. This approach revealed similar average fractions of active Cdc42 of 76.98, 74.13, and 73.8% at the cis -Golgi (mApple-p58), medial--Golgi (ManII-mCherry), and trans-Golgi (GalT-mCherry), respectively. The signal at the Golgi was spe-cific because the fraction of active Cdc42 at the Golgi was significantly higher than in ran-domly selected areas in the cytosol at half the distance between the Golgi and the PM and that did not overlap with the Golgi area (Figure 2B). These experiments show that the Cdc42-FLARE biosensor with the phasor approach to FLIM-FRET is capable of detect-ing enrichment in active Cdc42 at the lead-ing edge and all Golgi cisternae.
Inducible expression of Cdc42-FLARE did not alter cell morphol-ogy and behavior. A comparison of wild-type U2OS and uninduced and induced U2OS-Cdc42-FLARE cells in an immunofluorescence analysis showed no difference in the organization of the endoplas-mic reticulum (ER), Golgi, and cytoskeleton (Supplemental Figure S1B). In addition, Cdc42-dependent functions, such as anterograde and retrograde protein transport at the Golgi, as well as filopodia formation, were unaffected by expression of this biosensor (Supple-mental Figure S2, A and B). Finally, the organization of the centro-some, which we reported to be altered in cells with reduced Cdc42 activity, was normal (Supplemental Figure S1B; Kodani et al., 2009).
We used the phasor approach to FLIM-FRET to detect the activ-ity of this biosensor at the Golgi and the PM. We first defined the range of FRET efficiencies in cells. The intensity map of cells express-ing cerulean in the absence of an acceptor showed greater intensity in the center of the cell (Figure 1C, left, blue-to-red scale). Because FLIM is independent of fluorophore concentration, the fluorescence lifetime of cerulean was uniform (Figure 1C, middle), corresponding to ∼2.8 ns on the universal semicircle of the phasor plot (Digman et al., 2008), and was quenched to a maximum of ∼1.9 ns. The ellipti-cal trajectory shown in the phasor plot coordinates indicates that the
FIGURE 2: FLIM-FRET measurements detect Cdc42 activity at the Golgi. (A) Cdc42 activity measurements in a 25.29 × 25.29 µm2 square containing the cis-, medial-, or trans-Golgi
cisternae in U2OS-Cdc42-FLARE imaging cell lines constitutively expressing p58-mApple, ManII-mCherry or GalT-mCherry, respectively (left). Intensity maps for cerulean-Cdc42 and YPet in this region (middle two) are also shown. The percentages of active Cdc42 at specific Golgi cisternae were determined by overlaying FLIM maps with thresholded images of each Golgi marker (right). Graph shows the average percentage of active Cdc42 at each Golgi cisternae from eight cells per experiment and three independent experiments. (B) A comparison of Cdc42 activity at the Golgi and a random area in the cytosol. For a representative U2OS-Cdc42-FLARE imaging cell, the cerulean intensity (left) and the FLIM map (middle) are shown for the entire cell. Expression of ManII-mCherry (right) was used to mark the Golgi so that the specific FLIM signal at this location could be extracted. The position of the area in the cytosol (11.8 × 11.8 µm2,
We performed a similar analysis for Golgi-localized Cdc42 GEF FGD1 (Estrada et al., 2001), which was found to be necessary for Golgi-to-PM transport (Egorov et al., 2009). To our surprise, the frac-tion of active Cdc42 at the Golgi was similar in control and FGD1-depleted cells—74.28 and 73%, respectively. However, there was a reduction in the percentage of active Cdc42 at the PM from 73.9% in control cells to 51.9% in FGD1-depleted cells (t(36) = 5.8322, p < 0.0001; Figure 4B and Supplemental Figure S6). Thus, in spite of its Golgi association, this Cdc42 GEF does not appear to contribute to Cdc42 activation at the Golgi. For this entire set of experiments, we verified that our manipulations did not affect fluorescence intensi-ties of donor and acceptor proteins (Supplemental Figure S6).
Ribbonlike Golgi organization is important for Cdc42 activation at the PM
We next measured Cdc42 activity in cells with altered Golgi organi-zation. The Golgi ribbon was reported to be maintained by the structural Golgi protein GM130, with GM130 loss leading to discon-nected Golgi stacks (Puthenveedu et al., 2006). GM130 was de-pleted from the U2OS-Cdc42-FLARE imaging cell lines, followed by Cdc42 activity measurements with our FLIM-FRET assay. We then fixed the cells and stained them with an antibody to GM130 to confirm protein depletion in the cells that we had imaged. To our surprise, the fractions of active Cdc42 at the Golgi were similar in control and GM130-depleted cells—70.4 and 71.8%, respectively (Figure 5A and Supplemental Figure S7). However, at the PM of these cells, there was a significant decrease in the fraction of active Cdc42, from 69.0 to 50.8% (t(40) = 8.9123, p < 0.0001), which was not observed in control cells. This effect was specific and not due to reduced levels of donor or acceptor molecules (Supplemental Figure S7). This result suggests that either GM130 or Golgi ribbon organization is important for Cdc42 activation at the PM.
To differentiate between these possibilities, we analyzed cells with an extensively fragmented Golgi. We focused on golgin-84, a structural Golgi protein whose loss leads to Golgi fragmentation, dispersal, and a reduction in protein transport (Diao et al., 2003). Control and golgin- 84–depleted cells showed similar FRET percentages at the Golgi (Figure 5B and Supplemental Figure S7) but not at the PM, where golgin-84 de-pletion caused a decrease in the fraction of active Cdc42 from 69.82 to 45.17% (t(38) = 11.1093, p < 0.0001). These results suggest that Cdc42 activation at the Golgi is inde-pendent of Golgi organization but that dis-ruption of Golgi organization prevents Cdc42 activation at the PM.
Cdc42 controls centrosome organization from the PM
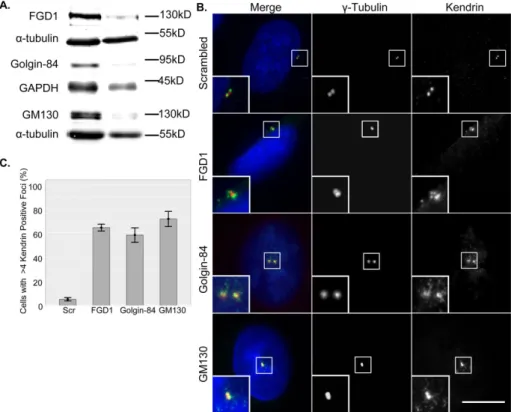
We next tested whether Cdc42 activity at the PM is critical for the regulation of the centrosome. We previously reported cen-trosome abnormalities in cells in which total cellular Cdc42 activity was reduced through depletion of GM130 or Tuba or overexpres-sion of dominant-negative Cdc42 (Kodani et al., 2008, 2009). We focused our analysis on FGD1- and golgin-84–depleted cells because they displayed reduced Cdc42 ac-tivity only at the PM (Figures 4 and 5). As a readout for centrosome organization, we Golgiassociated Cdc42 regulators have differential roles in
controlling Cdc42 activity at the Golgi
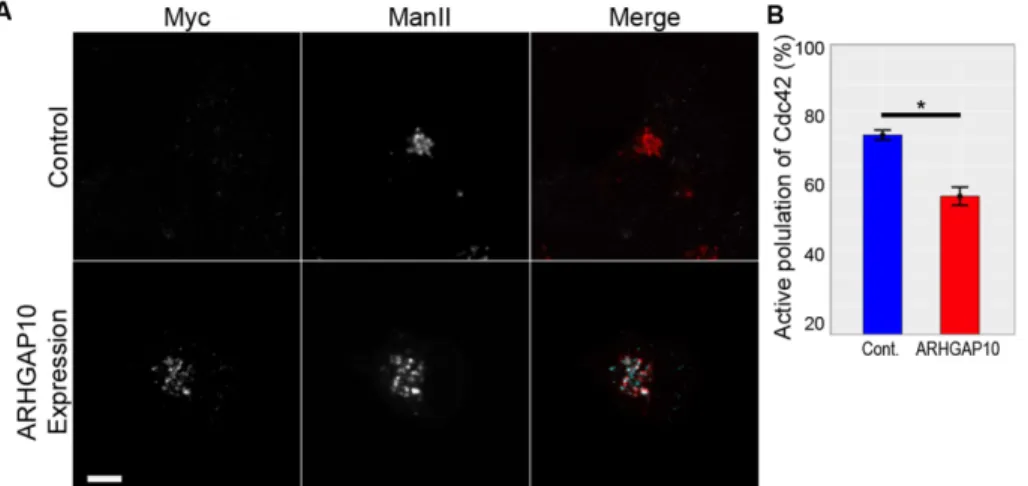
We used the U2OS-Cdc42-FLARE cell line to investigate the role of the Golgi-associated GAP ARHGAP10 in the regulation of Cdc42 activity at the Golgi. This protein has been implicated in Cdc42 regulation at the Golgi through indirect measurements of protein transport (Dubois et al., 2005). Consistent with published data, a truncated form that only contains the PH and GAP domains but lacks the PM targeting domain localized to the Golgi in our imaging cell line (Figure 3A and Supplemental Figure S5; Dubois et al., 2005). FLIM-FRET analysis in cells expressing this construct revealed a significant decrease in Cdc42 activity at the Golgi, with a reduction in the percentage of active Cdc42 from 71.46 to 49.2% (t(52) = 18.1771, p < 0.0001; Figure 3B). This reduction was not due to ef-fects on donor or acceptor levels because fluorescence intensities of these proteins were similar in both samples (Supplemental Figure S5). We conclude that the Golgi-associated pool of ARHGAP10 is able to inactivate Cdc42 at the Golgi and provide the first direct evi-dence that manipulations of a Cdc42 regulator lead to a decrease in Golgi-associated Cdc42 activity.
We next examined whether activation of Cdc42 at the Golgi de-pends on Tuba, which is reported to associate with the Golgi and the PM. We transfected U2OS-Cdc42-FLARE imaging cells with either control (scrambled) or Tuba-specific small interfering RNA (siRNA) and collected FLIM data at the Golgi, which was marked by ManII-mCherry. We also collected FLIM data at the PM, which was labeled by expression of the PM marker mApple-farnesyl. For this experiment, we zoomed in on the PM to the same extent as the Golgi, focusing on a region of the PM not in contact with other cells. After data collection, we verified protein loss in the cells that we had imaged through immunofluorescence analysis on gridded dishes (Supplemental Figure S6). Tuba-depleted cells contained a much smaller fraction of active Cdc42 at the Golgi and the PM than control cells, with decreases from 72.7 to 52.1% (t(52) = 9.9833, p < 0.0001) and 70.2 to 49.9% (t(56) = 14.9569, p < 0.0001), respectively (Figure 4, A and B).
We used novel tools to map Cdc42 activity in living cells. We established stable U2OS imaging cell lines for Cdc42 activity mea-surements, which inducibly expressed the Cdc42-FLARE biosensor. These imaging cell lines also expressed Golgi and PM markers, which facilitated measurement of Cdc42 activity at these specific locations at high pixel resolution (25.29 × 25.29 µm2; ∼100 nm/
pixel). We measured FRET with the phasor approach to FLIM in live cells, which allowed us to obtain quantitative measures of Cdc42 activity at specific cellular locations. There were approximately four times more active Cdc42 molecules at the Golgi than in randomly selected areas in the cytosol.
FLIM-FRET is highly suitable for this study because artifacts that are either caused by sample fixation or inherent to ratiometric FRET measurements were avoided. It also allowed for the detection of Cdc42 activity in areas with low biosensor expression levels. This became evident in migration experiments, in which the increase in the percentage of active Cdc42 molecules at the leading edge was not caused by a change in cerulean-Cdc42 intensity.
Our study is the first to provide direct support for the differential regulation of Cdc42 activity at the Golgi and PM in live cells. At the Golgi, Cdc42 activity was down-regulated when we expressed a Golgi-targeted form of ARHGAP10 or depleted Tuba. At the PM, Cdc42 activity was reduced when FGD1 was removed or Golgi monitored the centrosomal protein kendrin, which reveals
centro-some abnormalities in cells with reduced Cdc42 activity (Kodani et al., 2009). Whereas control cells displayed the typical comple-ment of two to four centrioles, there were aberrant kendrin foci next to the centrioles in FGD1- and golgin-84–depleted cells (Figure 6B, right). γ-Tubulin organization, in contrast, was unal-tered, which is consistent with earlier reports (Kodani et al., 2009). Thus, because golgin-84– and FGD1-depleted cells phenocopied the centrosome defects of GM130-depleted cells (Figure 6, B and C), we conclude that Cdc42 activity at the PM, and not the Golgi, may be critical for the maintenance of proper centrosome organization.
DISCUSSION
This study provides new insights into the control of Cdc42 activity at different cellular locations. The use of a dual-chain FRET biosensor and the phasor approach to FLIM led to three novel findings with regard to the spatial regulation and function of Cdc42 activity. We show that 1) Golgi-associated Cdc42 activity is controlled by ARHGAP10 and Tuba but not FGD1 and GM130, 2) Cdc42 activity at the PM depends on an intact Golgi ribbon, and 3) PM-associated Cdc42 activity is critical for the organization and function of the centrosome.
FIGURE 4: Tuba, but not FGD1, regulates Cdc42 activity at the Golgi. FLIM-FRET analysis of cells lacking the Golgi-associated GEFs Tuba or FGD1. The U2OS-Cdc42-FLARE imaging cell line, which also
expressed ManII-mCherry or mApple-farnesyl to label the Golgi or PM, respectively, was transfected with scrambled-, Tuba-, or FGD1-specific siRNA and subjected to FLIM-FRET analysis at the Golgi or PM. Average percentage of active Cdc42 at the Golgi (left) or the PM (right). For each condition, eight cells were analyzed per experiment, and three independent experiments were performed. *p < 0.0001. (A) FLIM-FRET analysis of scrambled (Scr) and Tuba-depleted cells (Tuba). (B) FLIM-FRET analysis of scrambled (Scr) and FGD1-depleted cells (FGD1).
aspect of Golgi function is required to acti-vate Cdc42 at the PM because GM130 or golgin-84 depletion may interfere with pro-tein modification, sorting, or transport of Cdc42 itself or a specific regulator. A mech-anism involving post-Golgi transport would be consistent with previous findings on the requirement for membrane trafficking for Cdc42 activation at the leading edge of cells (Osmani et al., 2010).
Our results led to a revised model of Cdc42-mediated regulation of the centro-some. We previously proposed that Cdc42 activity at the Golgi controls centrosome organization because GM130-depleted cells displayed reduced Cdc42 activity in biochemical assays and centrosome de-fects (Kodani et al., 2009). However, the spatial analysis of Cdc42 activity estab-lishes a strong correlation between Cdc42 activity at the PM and centrosome regula-tion. Cells in which PM-associated Cdc42 activity was specifically reduced—for ex-ample, as a result of FGD1 or golgin-84 depletion, displayed abnormal centrosome morphology, with an increased number of kendrin foci but normal γ-tubulin organiza-tion. These experimental conditions had no effect on Cdc42 activity at the Golgi, suggesting that Golgi-associated Cdc42 does not contribute to the regulation of this adjacent organelle. This revised model is consistent with previous findings on ab-normal centrosomes in cells that either lacked Tuba or expressed dominant-nega-tive Cdc42 (Kodani et al., 2009).
It is not known how PM-associated Cdc42 controls the centro-some. A possible mechanism involves microtubules, which are necessary for centrosome assembly and whose dynamics depend on binding of activated Cdc42 to the PAR complex at the PM (Young et al., 2000; Etienne-Manneville and Hall, 2003). Consistent with this idea, microtubule depolymerization with low concentra-tions of nocodazole caused changes in centrosome organization that phenocopied the depletion of GM130 or golgin-84 (Dammer-mann and Merdes, 2002). Microtubule attachment to the PM also promotes tension, which helps position the centrosome (Burakov et al., 2003). Alternatively, active Cdc42 may contribute to the ac-tivation of the PAR complex, possibly controlling the centrosomal localization of the PAR6 isoforms Par6α and Par6γ, which are nec-essary for centrosome assembly (Kodani et al., 2010; Dormoy et al., 2013).
Baschieri et al. (2014) reported a role for GM130 in the control of Cdc42 activity at the Golgi, which contradicts our findings. They found that GM130-depleted HEK293T cells had reduced levels of active Cdc42 at the Golgi, whereas activity levels at the PM were unaffected. Their model suggests that GM130-mediated Cdc42 regulation does not involve a GEF but, instead, GM130 binding to RasGRF2, a known negative regulator of the small GTPase Ras (Fernández-Medarde and Santos, 2011). There are several possible explanations for the discrepancies between our findings and those of Baschieri et al. (2014). For example, they used a single-chain biosensor in which the Rho GDI–binding site in Cdc42 is blocked. organization was disrupted. Of interest, these latter factors did not
affect Cdc42 activity at the Golgi, suggesting that the population of Cdc42 activity at the Golgi is independent of its PM-associated counterpart. Only Tuba controlled activity at the Golgi and the PM, which is likely due to its presence at both locations. It remains un-clear whether Golgi-associated Cdc42 activity affects the popula-tion of this small GTPase at the PM.
The role of FGD1 at the Golgi is unclear. This GEF is reported to contribute to Cdc42 recruitment to the Golgi, but its depletion had no effect on the fraction of active, Golgi-associated Cdc42. It is possible that FGD1 at the Golgi may not be active or that it as-sociates with inactive Cdc42. Alternatively, previous studies with FGD1 relied on overexpression of FGD1 mutants, which may have affected FGD1 function at the Golgi (Egorov et al., 2009). Although additional experiments are needed to better understand the Golgi-associated pool of FGD1, our results demonstrate a role for this GEF at the PM, which is consistent with the reported reduction of Cdc42 activity in total lysates of FGD1-depleted cells (Egorov et al., 2009).
Of interest, Cdc42 activity at the PM depended on an intact Golgi ribbon. We manipulated Golgi organization in two ways. We removed GM130, which leads to disconnected Golgi ministacks, glycosylation defects, and delayed protein transport (Puthenveedu et al., 2006; Marra et al., 2007). We also depleted golgin-84, which induces extensive Golgi fragmentation and a general reduction in protein transport (Diao et al., 2003). We do not yet know which
the Suetterlin lab) was inserted between EcoRI/NotI of PB-EF1-MCS-IRES-Neo. PB-GalT-mCherry: mCherry cDNA was inserted be-tween NheI/NotI in PB-EF1-MCS-IRES-Neo; then GalT cDNA was PCR amplified from pYFP-GalT (a generous gift from John Presley, McGill University, Montreal, Canada; Yilmaz Dejgaard et al., 2007) and inserted between SacII/NotI 5′ of the mCherry cDNA. PB-mApple-p58: mApple cDNA (a generous gift from Michael David-son, Florida State University, Tallahassee, FL; Kremers et al., 2009) was first inserted between NheI/EcoRI of PB-EF1-MCS-IRES-Neo; then p58 cDNA was PCR amplified from pYFP-p58 (a generous gift from John Presley; Yilmaz Dejgaard et al., 2007) and inserted into EcoRI downstream of mApple using the Cold Fusion kit (Systems Biosciences). ARHGAP10-myc: The fragment encoding for amino acids 885–1346 of ARHGAP10, which contains the PH and GAP do-mains, was amplified from the KIAA1424 template (Nagase et al., 2000) and cloned into the EcoRI site of PCDNA3.1+.
RNA interference
Protein depletion was carried out by transfecting U2OS cells (HTB96; American Type Culture Collection [ATCC]) with 200 nM (GM130, gol-gin-84, and scrambled) or 50 nM (Tuba, FGD1, and scrambled) siRNA duplexes using Oligofectamine as described by the manufacturer. The following sequences were used to target GM130: 5′ -AAGT-TAGAGAGATGACGGAACTC-3′ (Puthenveedu et al., 2006), Tuba: 5′-GAGCTTGAGGGAACATACAAGATTT-3′ (Kodani et al., 2009), gol-gin-84: 5′-AAGTAGGATCTCGGACACCAG-3′ (Diao et al., 2003), FGD1-Smartpool (M-009612-01-0005; Dharmacon), and a scrambled control sequence, 5′-AAACTAAACTGAGGCAATGCC3′ (Sutterlin et al., 2005). All siRNA duplexes were obtained from Life Technolo-gies unless noted otherwise.
Antibodies
Primary antibodies to the following proteins were used in this study: calreticulin (C4606; Sigma-Aldrich), Tuba (a gift from Frank Gertler, MIT; and B01P, Abnova), centrin2 (a gift from Jeffery L. Salisbury, Mayo Clinic; and Clone 20H5, Millipore), FGD1 (HPA 000911; Sigma-Aldrich), myc (Clone 9E10; Cal Biochem), GM130 (Clone 35; BD Biosciences; and G7295, Sigma-Aldrich), giantin (a gift from Vivek Malhotra, Center for Genomic Regulation, Barce-lona, Spain), kendrin (a gift from Mikiko Takahashi, Teikyo Heisei University), α-tubulin (T5168; Sigma-Aldrich), γ-tubulin (ab11310; Abcam), Cdc42 (Clone 44; BD Biosciences), and vesicular stomati-tis virus G-protein (VSVG; BWG85; a gift from Victor Hsu, Harvard Medical School). Secondary antibodies for immunofluorescence were from Theromo Fisher or Biotium, and near-infrared antibodies for Western blots were from LI-COR (Lincoln, NE). For immunofluo-rescence, cells were fixed in either 100% ice-cold methanol (JT Baker) or 4% formaldehyde (Ted Pella), blocked and permeabilized with 2% blocking buffer (2% fetal bovine serum [FBS], 0.01% Triton X-100, and 1× phosphate-buffered saline), stained with primary an-tibodies for 1 h at room temperature, and stained with secondary antibodies for 1 h. Coverslips were mounted with ProLong Gold (Thermo Fisher), and imaging dishes were filled with Ibidi Mount-ing Medium (Ibidi).
Cell culture, establishment of stable cell lines, and protein expression
Parental U2OS cells (HTB96; ATCC) and all derived clonal cell lines were cultured in Advanced DMEM supplemented with 10% FBS (Hy-clone) and 2 mM GlutaMAX-I (GIBCO, Rockville, MD) at 37°C with 5% CO2. Stable cell lines were generated using the PB transposon
system (System Biosciences). In brief, U2OS cells were cotransfected However, the GDI–Cdc42 interaction was recently found to be
criti-cal for the spatiotemporal regulation of Cdc42 activity (Hodgson et al. 2016). Furthermore, they performed FRET measurements with the acceptor photobleaching method after cell fixation, which is reported to affect small GTPase localization (Michaelson et al., 2001). In addition, they relied on the expression of their Cdc42 biosensor to mark the Golgi instead of labeling it with a specific marker. Finally, they used different cell lines, with depletions of GM130 and the various Cdc42 GEFs in HEK293T but experiments with RasGRF in HeLa cells.
In our study, in contrast, we detected the fractional population of active Cdc42 at the Golgi and the PM in living U2OS cells, using a dual-chain biosensor that maintains GDI binding, and measured FRET with the phasor approach to FLIM. Focus in our study was given to the specific locations of our FRET measurements, which were determined through coexpression of markers and only on cells in which manipulations were confirmed. Attempts to corroborate the results of Baschieri et al. (2014) were unsuccessful. We were unable to detect RasGRF2 in U2OS and HeLa cells by immunofluo-rescence or Western blot with the reported antibody (sc-863 C18; Santa Cruz Biotechnology) or two other commercial antibodies (sc-224 C-20, ProteinTech; 19717-1-AP; Santa Cruz Biotechnology; unpublished data). We also failed to deplete RasGRF2 from HeLa or U2OS cells with the reported siRNA (SI04235147; Qiagen). Thus better reagents have to be developed to resolve the discrepancies between these two studies.
In conclusion, we used the phasor approach to FLIM-FRET and a biosensor with an intact GDI interaction domain to demonstrate for the first time how manipulations of cellular factors, including GEFs, GAPs, and structural Golgi proteins, affect Cdc42 activity at the Golgi and the PM in live cells. Future studies will focus on under-standing how Golgi organization and/or function controls Cdc42 activation at the PM and how active Cdc42 at the PM in turn regu-lates the centrosome. The assay and cell lines that we developed will help develop a comprehensive model of Cdc42 regulation at the Golgi, the PM, and other cellular locations.
MATERIALS AND METHODS Molecular biology
The Cdc42-FLARE biosensor was based on the dual-chain biosen-sors described in Machacek et al. (2009). Cerulean fluorescent pro-tein (CFP; Rizzo et al., 2004) replaced CyPet to improve brightness and FRET efficiency, and residues 201–293 of WASP were used as the affinity reagent. The two biosensor chains were expressed on one open reading frame with two consecutive 2A viral peptide se-quences from porcine teschovirus-1 (P2A) and Thosea asigna virus (T2A) inserted between them, leading to the production of two chains during translation (Kim et al., 2011). The biosensor is under-going further optimization, which will be described in detail in a separate publication. For the establishment of stable Cdc42-FLARE cell lines, we used the PiggyBac (PB) all-in-one cumate expression system PB-Cuo-MCS-IRES-GFP-EF1-CymR-Puro (PBQM812A-1; Systems Biosciences) and EF1 constitutive active expression system PB-EF1-MCS-IRES-Neo (PB533A-2; Systems Biosciences). The con-structs were generated as follows: PB-CuRo-MCS-EF1-CymR-Puro: PB-Cuo-MCS-IRES-GFP-EF1-CymR-Puro was digested with XcmI/ AvrII to release IRES-GFP, followed by a Klenow and religation.
PB-Cdc42-FLARE: the Cdc42-FLARE fragment was released from
(Hinde et al., 2012). In brief, files were calibrated against the couma-rin 6 control, which has a known lifetime of 2.6 ns. The fluorescence lifetime of each pixel of the image was then mapped to the phasor plot. The lifetime of the cerulean in control cells and the autofluores-cence signal were set on the phasor, and the FRET calculator in SimFCS was used to generate the FRET trajectory for mapping ac-tivity in cells. These measurements revealed a maximal detectable FRET efficiency of 28% for this biosensor. This maximal FRET effi-ciency was defined as 100% of the active Cdc42 population. Given that all of the FLIM images were collected for both donor and ac-ceptor emission using a pixel of ∼100 nm, ccRICS was performed with SimFCS to demonstrate that donor and acceptor proteins inter-acted in the selected regions of interest in biosensor-expressing cells. The cross-correlation method detects molecules of the two colors (donor and acceptor) diffusing together, also referred to as dynamic colocalization. In principle, cross-correlation does not dem-onstrate FRET but only that a complex is formed. In addition, the RICS method is sensitive to only diffusing molecules, with immobile molecules in the same pixel not contributing to the cross-correlation signal.
For intensity measurements, we used SimFCS to generate inten-sity histograms (photon counts/frame/pixel) for representative cells for each experimental condition.
To determine the average percentage of active Cdc42 at a spe-cific location, we imported images of the Golgi or PM marker taken at the time of live imaging into Fiji using BioFormats and subjected them to thresholding using the IsoData method for the Golgi or hand tracing with a 20-pixel overlay brush for the PM (Ridler and Calvard, 1978; Linkert et al., 2010; Schindelin et al., 2012). These images were then imported into SimFCS and used to mask the FLIM data for the corresponding cell at the Golgi and the PM. To analyze the data, analysis of variance was created with post hoc t tests in R software.
For polarized cells, cells were divided into two regions by draw-ing a line through the nucleus perpendicular to the gradient (or where the gradient would have been in control cells) and then calculating the average Cdc42 activity for each region.
Protein transport
VSVGts045-myc or VSVG-KDELR (a generous gift from Jennifer Lippincott-Schwartz, National Institutes of Health; Cole et al., 1998) was transiently transfected into wild-type U2OS or U2OS-Cdc42-FLARE cells using X-treme Gene 9 and incubated at 37°C at 5% CO2 for 18 h. Before transport experiments, medium was sup-plemented with 25 µM 4-(2-hydroxyethyl)-1-piperazineethanesul-fonic acid, pH 7.4. Cells were then incubated at 40.5°C for 4 h to accumulate VSVG in the ER, followed by a shift to the permissive temperature of 32°C to allow the protein to exit the ER. Cells were fixed in 4% formaldehyde (Ted Pella) at 0, 20, 60, or 120 min after shift to 32°C and processed for immunofluorescence analysis using an Axiovert 200 M microscope with AxioVision software (Zeiss). Cells with VSVG-KDELR were incubated for 2 h at 32°C to accumu-late protein in the Golgi, followed by a shift to 37°C for 0, 2, 4, or 6 h to permit retrograde transport the ER. Image analysis was done with ImageJ.
with a PB-transposon construct (PB-mApple-p58, PB-GalT-mCherry, PB-ManII-mCherry, PB-mApple-Farnesyl, or PB-Cdc42-FLARE) and PB-transposase using X-tremeGENE 9 (Roche) as described by the manufacturer. Cells were selected for integration of the transposon using G418 at 500 µg/ml or puromycin at 2 µg/ml (Gold Biotechnol-ogy). Clonal cell lines were generated through serial dilution in 96-well plates.
Expression Cdc42-FLARE was accomplished by incubating the cells with 300 µg/ml water-soluble cumate (Systems Bio Sciences) for 48 h. For transient transfections, DNA constructs were intro-duced into cells using Lipofectamine 3000 (Life Technologies) or X-treme Gene 9 according to manufacturer’s protocol.
FLIMFRET experiment and analysis
Cell preparation. Inducible Cdc42-FLARE cell line was seeded in
six-well dishes 60 h before imaging at 50% confluency. At 48 h before imaging, the cells were induced with 300 µg/ml cumate (Systems Biosciences), and cumate concentration was maintained constant throughout the experiment. For protein depletion assays, 48 h before imaging, cells were transfected with RNAi using Oligofectamine. For protein expression, ∼18 h before imaging, cells were transiently transfected with ARHGAP10 constructs using Lipofectamine 3000 (Life Technologies) or the cerulean control using X-treme Gene 9. At 24 h before imaging, cells were transferred to a µDish35 mm, high with Grid-500 (81166; Ibidi), which
was used for live imaging and locating the previously imaged cells after fixation.
Imaging. All FLIM experiments were done in living cells, which
were maintained at 37°C with 5% CO2. After live imaging, cells were fixed, and the imaged cells were identified using the grid on the dish and analyzed using immunofluorescence to confirm protein de-letion or expression. All data were acquired using a Zeiss LSM780 laser scanning microscope equipped with an incubation chamber and coupled to a two-photon Ti:sapphire laser (Spectra-Physics) and an ISS A320 FastFLIM box to acquire the lifetime data. An LD C-Apochromat 63×/1.15 water immersion objective (Zeiss) was used for all live-cell experiments, and a Plan-Apochromat 63×/1.40 Oil DIC was used for all fixed experiments. Cerulean was excited at 800 nm with 2.5% laser power from the two-photon laser pulsing at 80 fs at a repetition of 80 MHz. The laser light was separated from the fluorescence signal using an SP 760-nm dichroic filter. The fluores-cence signal was directed through a 509 LP CFP/yellow fluorescent protein (YFP) filter; the signal was then split between two photomul-tiplier detectors (H7422P-40; Hamamatsu),equipped with either a CFP 470/22 or YFP 542/27 bandwidth filter. FLIM data were ac-quired with the SimFCS software developed at the Laboratory of Fluorescence Dynamics at the University of California, Irvine, with a dwell time of 25.61 µs/pixel and the pixel frame size set to 256 × 256, and the electronic zoom used to enhance resolution produced an image size of 24.53 × 24.53 µm (pixel size of ∼100 nm). Fifty frames were collected per sample to limit exposure time to the laser to ∼1.5–2 min. For each experiment, a solution of 50 µM coumarin 6 (Sigma-Aldrich) dissolved in 100% ethanol was imaged as a calibra-tion control. Zen Black 2012 (Zeiss) was used to control the microscope and collect confocal images of the mCherry/mApple cellular markers acquired in parallel with FLIM data and images of fixed cells.
Data analysis. FLIM data were processed to map the fraction of
FRET for each cell using the SimFCS software (Laboratory of Fluo-rescence Dynamics, University of California, Irvine) as described
ACKNOWLEDGMENTS
Hinde E, Digman MA, Welch C, Hahn KM, Gratton E (2012). Biosensor Förster resonance energy transfer detection by the phasor approach to fluorescence lifetime imaging microscopy. Microsc Res Tech 75, 271–281.
Hodgson L, Spiering D, Sabouri-Ghomi M, Dagliyan O, DerMardirossian CEL, Danuser G, Hahn KM (2016). FRET binding antenna reports spatio-temporal dynamics of GDI-Cdc42 GTPase interactions. Nat Chem Biol 12, 802–809.
Itoh RE, Kurokawa K, Ohba Y, Yoshizaki H, Mochizuki N, Matsuda M (2002). Activation of Rac and Cdc42 video imaged by fluorescent resonance energy transfer-based single-molecule probes in the membrane of living cells. Mol Cell Biol 22, 6582–6591.
Kim JH, Lee SR, Li LH, Park HJ, Park JH, Lee KY, Kim MK, Shin BA, Choi SY (2011). High cleavage efficiency of a 2A peptide derived from porcine Teschovirus-1 in human cell lines, zebrafish and mice. PLoS One 6, e18556.
Kodani A, Kristensen I, Huang L, Sütterlin C (2009). GM130-dependent control of Cdc42 activity at the Golgi regulates centrosome organiza-tion. Mol Biol Cell 20, 1192–1200.
Kodani A, Tonthat V, Wu B, Sütterlin C (2010). Par6 alpha interacts with the dynactin subunit p150 Glued and is a critical regulator of centrosomal protein recruitment. Mol Biol Cell 21, 3376–3385.
Kremers G-J, Hazelwood KL, Murphy CS, Davidson MW, Piston DW (2009). Photoconversion in orange and red fluorescent proteins. Nat Methods 6, 355–358.
Kroschewski R, Hall A, Mellman I (1999). Cdc42 controls secretory and endocytic transport to the basolateral plasma membrane of MDCK cells. Nat Cell Biol 1, 8–13.
Ku GM, Yablonski D, Manser E, Lim L, Weiss A (2001). A PAK1-PIX-PKL complex is activated by the T-cell receptor independent of Nck, Slp-76 and LAT. EMBO J 20, 457–465.
Kunida K, Matsuda M, Aoki K (2012). FRET imaging and statistical signal processing reveal positive and negative feedback loops regulating the morphology of randomly migrating HT-1080 cells. J Cell Sci 125, 2381–2392.
Linkert M, Rueden CT, Allan C, Burel JM, Moore W, Patterson A, Loranger B, Moore J, Neves C, Macdonald D, et al. (2010). Metadata matters: access to image data in the real world. J Cell Biol 189, 777–782. Luna A, Matas OB, Martínez-Menárguez JÁ, Mato E, Durán JM, Ballesta J,
Way M, Egea G (2002). Regulation of protein transport from the Golgi complex to the endoplasmic reticulum by CDC42 and N-WASP. Mol Biol Cell 13, 866–879.
Machacek M, Hodgson L, Welch C, Elliott H, Pertz O, Nalbant P, Abell A, Johnson GL, Hahn KM, Danuser G (2009). Coordination of Rho GTPase activities during cell protrusion. Nature 461, 99–103.
Marra P, Salvatore L, Mironov A, Di Campli A, Di Tullio G, Trucco A, Beznoussenko G, de Matteis MA (2007). The biogenesis of the Golgi ribbon: The roles of membrane input from the ER and of GM130. Mol Biol Cell 18, 1595–1608.
Matas OB, Martínez-Menárguez JÁ, Egea G (2004). Association of Cdc42/ N-WASP/Arp2/3 signaling pathway with golgi membranes. Traffic 5, 838–846.
Michaelson D, Silletti J, Murphy G, D’Eustachio P, Rush M, Philips MR (2001). Differential localization of Rho GTPases in live cells: regulation by hypervariable regions and RhoGDI binding. J Cell Biol 152, 111–126. Monypenny J, Zicha D, Higashida C, Oceguera-Yanez F, Narumiya S,
Watanabe N (2009). Cdc42 and Rac family GTPases regulate mode and speed but not direction of primary fibroblast migration during platelet-derived growth factor-dependent chemotaxis. Mol Cell Biol 29, 2730–2747.
Nagase T, Kikuno R, Ishikawa KI, Hirosawa M, Ohara O (2000). Prediction of the coding sequences of unidentified human genes. XVI. The complete sequences of 150 new cDNA clones from brain which code for large proteins in vitro. DNA Res 7, 65–73.
Nalbant P, Hodgson L, Kraynov V, Toutchkine A, Hahn KM (2004). Activa-tion of endogenous Cdc42 visualized in living cells. Science 305, 1615–1619.
Nobes CD, Hall A (1995). Rho, rac, and cdc42 GTPases regulate the assem-bly of multimolecular focal complexes associated with actin stress fibers, lamellipodia, and filopodia. Cell 81, 53–62.
Osmani N, Peglion F, Chavrier P, Etienne-Manneville S (2010). Cdc42 local-ization and cell polarity depend on membrane traffic. J Cell Biol 191, 1261–1269.
Park S-Y, Yang J-S, Schmider AB, Soberman RJ, Hsu VW (2015). Coordi-nated regulation of bidirectional COPI transport at the Golgi by CDC42. Nature 521, 529–532.
generously providing reagents. This work was supported by Grant R01GM089913 from the National Institute of General Medical Sciences and Grants P41-GM103540 and P50-GM076516 (E.G. and M.A.D.) from the National Institutes of Health.
REFERENCES
Baschieri F, Confalonieri S, Bertalot G, Di Fiore PP, Dietmaier W, Leist M, Crespo P, Macara IG, Farhan H (2014). Spatial control of Cdc42 signal-ling by a GM130-RasGRF complex regulates polarity and tumorigenesis. Nat Commun 5, 4839.
Benard V, Bokoch GM (2002). Assay of Cdc42, Rac, and Rho GTPase activation by affinity methods. Methods Enzymol 345, 349–359. Bhattacharya K, Swaminathan K, Peche VS, Clemen CS, Knyphausen P,
Lammers M, Noegel AA, Rastetter RH (2016). Novel coronin7 interac-tions with Cdc42 and N-WASP regulate actin organization and Golgi morphology. Sci Rep 6, 25411.
Burakov A, Nadezhdina E, Slepchenko B, Rodionov V (2003). Centrosome positioning in interphase cells. J Cell Biol 162, 963–969.
Calvo F, Sanz-Moreno V, Agudo-Ibanez L, Wallberg F, Sahai E, Marshall CJ, Crespo P (2011). RasGRF suppresses Cdc42-mediated tumour cell movement, cytoskeletal dynamics and transformation. Nat Cell Biol 13, 819–826.
Chen Y, Mills JD, Periasamy A (2003). Protein localization in living cells and tissues using FRET and FLIM. Differentiation 71, 528–541.
Cole NB, Ellenberg J, Song J, DiEuliis D, Lippincott-Schwartz J (1998). Retrograde transport of Golgi-localized proteins to the ER. J Cell Biol 140, 1–15.
Coso OA, Chiariello M, Yu JC, Teramoto H, Crespo P, Xu N, Miki T, Gutkind JS (1995). The small GTP-binding proteins Rac1 and Cdc42 regulate the activity of the JNK/SAPK signaling pathway. Cell 81, 1137–1146.
Dammermann A, Merdes A (2002). Assembly of centrosomal proteins and microtubule organization depends on PCM-1. J Cell Biol 159, 255–266. Diao A, Rahman D, Pappin DJC, Lucocq J, Lowe M (2003). The coiled-coil membrane protein Golgin-84 is a novel rab effector required for Golgi ribbon formation. J Cell Biol 160, 201–212.
Digman MA, Caiolfa VR, Zamai M, Gratton E (2008). The phasor approach to fluorescence lifetime imaging analysis. Biophys J 94, L14–L16. Dormoy V, Tormanen K, Suetterlin C (2013). Par6 gamma is at the mother
centriole and controls centrosomal protein composition through a Par6 alpha-dependent pathway. J Cell Sci 126, 860–870.
Dubois T, Paléotti O, Mironov AA, Fraisier V, Stradal TEB, de Matteis MA, Franco M, Chavrier P (2005). Golgi-localized GAP for Cdc42 functions downstream of ARF1 to control Arp2/3 complex and F-actin dynamics. Nat Cell Biol 7, 353–364.
Egorov MV, Capestrano M, Vorontsova OA, Di Pentima A, Egorova AV, Mariggiò S, Ayala MI, Tetè S, Gorski JL, Luini A, et al. (2009). Faciogeni-tal dysplasia protein (FGD1) regulates export of cargo proteins from the Golgi complex via Cdc42 activation. Mol Biol Cell 20, 2413–2427. Elangovan M, Day RN, Periasamy A (2002). Nanosecond fluorescence
resonance energy transfer fluorescence lifetime imaging microscopy to localize the protein interactions in a single living cell. J Microsc 205, 3–14.
Erickson JW, Zhang CJ, Kahn RA, Evans T, Cerione RA (1996). Mammalian Cdc42 is a brefeldin A-sensitive component of the Golgi apparatus. J Biol Chem 271, 26850–26854.
Estrada L, Caron E, Gorski JL (2001). Fgd1, the Cdc42 guanine nucleotide exchange factor responsible for faciogenital dysplasia, is localized to the subcortical actin cytoskeleton and Golgi membrane. Hum Mol Genet 10, 485–495.
Etienne-Manneville S, Hall A (2001). Integrin-mediated activation of Cdc42 controls cell polarity in migrating astrocytes through PKCzeta. Cell 106, 489–498.
Etienne-Manneville S, Hall A (2003). Cdc42 regulates GSK-3β and adeno-matous polyposis coli to control cell polarity. Nature 421, 753–756. Fernández-Medarde A, Santos E (2011). The RasGrf family of mammalian
guanine nucleotide exchange factors. Biochim Biophys Acta 1815, 170–188.
Hanna S, Miskolci V, Cox D, Hodgson L (2014). A new genetically encoded single-chain biosensor for Cdc42 based on FRET, useful for live-cell imaging. PLoS One 9, e96469.
Sutterlin C, Polishchuk R, Pecot M, Malhotra V (2005). The Golgi-associated protein GRASP65 regulates spindle dynamics and is essential for cell division. Mol Biol Cell 16, 3211–3222.
Wallrabe H, Chen Y, Periasamy A, Barroso M (2006). Issues in confocal mi-croscopy for quantitative FRET analysis. Microsc Res Tech 69, 196–206. Wallrabe H, Periasamy A (2005). Imaging protein molecules using FRET and
FLIM microscopy. Curr Opin Biotechnol 16, 19–27.
Wu WJ, Erickson JW, Lin R, Cerione RA (2000). The gamma-subunit of the coatomer complex binds Cdc42 to mediate transformation. Nature 405, 800–804.
Yilmaz Dejgaard S, Murshid A, Dee KM, Presley JF (2007). Confocal microscopy-based linescan methodologies for Intra-Golgi localization of proteins. J Histochem Cytochem 55, 709–719.
Young A, Dictenberg JB, Purohit A, Tuft R, Doxsey SJ (2000). Cytoplasmic dynein-mediated assembly of pericentrin and gamma tubulin onto centrosomes. Mol Biol Cell 11, 2047–2056.
Puthenveedu MA, Bachert C, Puri S, Lanni F, Linstedt AD (2006). GM130 and GRASP65-dependent lateral cisternal fusion allows uniform Golgi-enzyme distribution. Nat Cell Biol 8, 238–248.
Ridler TW, Calvard S (1978). Picture thresholding using an iterative selection method. IEEE Trans Syst Man Cybernet 8, 630–632.
Rizzo MA, Springer GH, Granada B, Piston DW (2004). An improved cyan fluorescent protein variant useful for FRET. Nat Biotechnol 22, 445–449.
Salazar MA, Kwiatkowski AV, Pellegrini L, Cestra G, Butler MH, Rossman KL, Serna DM, Sondek J, Gertler FB, de Camilli P (2003). Tuba, a novel protein containing bin/amphiphysin/Rvs and Dbl homology domains, links dynamin to regulation of the actin cytoskeleton. J Biol Chem 278, 49031–49043.