ISSN 0974-2255 Volume 4, Number 1 (2012), pp. 1-9 © International Research Publication House
http://www.irphouse.com
Rule based Classification of BSE Stock Data with
Data Mining
Anil Rajput 1 , S.P. Saxena 2, Ramesh Prasad Aharwal 3 and Ritu Soni 4
1
Principal, Bhabha Engineering Research Institute-MCA, Bhopal-26, India E-mail: [email protected]
2
HOD, T.I.T. Engineering college-MCA, Bhopal, India
3
Asstt. Prof., Department of Mathematics and Computer Science, Govt. P.G. College Bareli (M.P.), India:
E-mail: [email protected]
4
Asstt Prof., Department of Computer Science, N.R.I. Group of Institute Bhopal (M.P.) India
Abstract
Data mining aims to discover hidden knowledge, unknown patterns, and new rules from large databases that are potentially useful and ultimately understandable for making crucial decisions. This paper focuses for the rule based classification model of historical BSE stock data with data mining techniques. In this Paper we have used decision tree and rule induction method with the help of data mining software. We have to create classification rules and induction rules with the use of J48 and PRISM classifiers under WEKA software.
Keywords: Decision tree, Stock market, Data mining, PRISM, Moving average, WEKA
Introduction
Data mining is able to uncover hidden patterns and predict future trends and behaviors in financial markets [2].Data mining is the process of extraction of interesting (nontrivial, implicit, previously unknown and potentially useful) patterns or
knowledge from huge amount of data [3]. There is still a nontrivial gap between general principals of Data Mining and domain specific, effective Data Mining tools for particular applications. Data mining techniques have been profitably have to shown to generate high forecasting accuracy of stock price movement. Financial stock market is a complex, non inactive, noisy, disordered, nonlinear and dynamic system but it does not follow random walk process. There are many factors that may cause the rise and fall of financial market movement. Predictions of stock market price and its direction are quite difficult. In answer to such difficulty, data mining techniques and data mining software also have been applied for this task.
Stock Market Prediction Techniques
Commonly, techniques on stock market prediction can be divided in two main categories. They are traditional techniques and intelligent techniques. The traditional techniques can be further categorized into fundamental and technical analysis. today, intelligent techniques have become the main focus of the current researches and have widely applied in stock market prediction. We have used some important indicator functions such as moving average (MA), Exponential moving average (EMA). Another indicator functions are used in this paper for transforming new attributes which are used for data mining algorithm, Such as DM+, DM- .
Learning Environment
The Weka Data Mining Environments were used for carrying out the experiments. Waikato Environment for Knowledge Analysis, called shortly WEKA, is a set of state-of-the art data mining algorithms and tools to in-depth analyses. The author of this environment is University of Waikato in New Zealand. The programming language of WEKA is Java and its distribution is based on GNU General Public License. The general setup used is as follows:
Data mining
Fayyad (1997) viewed data mining as a single step in the knowledge discovery in databases (KDD) process that consists of applying data analysis and discovery algorithms that produce a particular enumeration of patterns (or models) over the data [4]. Data mining involves applying different operations such as classification, prediction, clustering and Association rule mining. During the implementation of these operations, specific algorithms need to be constructed.
Data mining refers to the process of finding interesting patterns in data that are not explicitly part of the data [9]. Data mining uses two strategies: supervised and unsupervised learning. In supervised learning, a training set is used to learn model parameters whereas in unsupervised learning no training set is used (e.g., kmeans clustering is unsupervised) [5]. In this research we used supervised learning. There are
different data mining methods are available in the literature of data mining. Some of them are applicable in the Finance domain.
Data Mining Techniques
Author Norashikin [6], described data mining operations as belongs to several categories like classification, clustering, association and prediction. Besides that, researchers have widely used data mining operations such as classification, clustering and time series prediction in [7]. Among a variety of data mining techniques that have been used in finance, we mainly focus on one commonly used technique, namely Rule induction method.
Rule Induction
Rule induction models belong to the logical, pattern distillation based approaches of data mining. Based on data sets, these techniques produce a set of if-then rules to represent significant patterns and create prediction models. Such models are fully transparent and provide complete explanations of their predictions. One commonly used and well-known type of rule induction is the family of algorithms that produce decision trees. A decision tree, which is usually constructed using a training data set, consists of hierarchically organized sets of rules. It is a simple recursive structure for representing a decision procedure in which a new instance is classified into one of the predefined classes. In decision trees, instances are represented as feature vectors containing a list of attribute-value pairs. Each internal node represents a decision attribute-value test. Each branch represents an outcome of the test, and each leaf node denotes a decision class. The decision tree technique is based on a divide-and-conquer approach to the classification problem. It works in a top-down manner: at each stage, it seeks an attribute that separates classes the best to split on, and then recursively processes the partitions resulted from the split. The basic principle is to maximize the entropy of the split subsets, while recursive partitioning is designed to minimize the expected cost of misclassification.
Data Collection
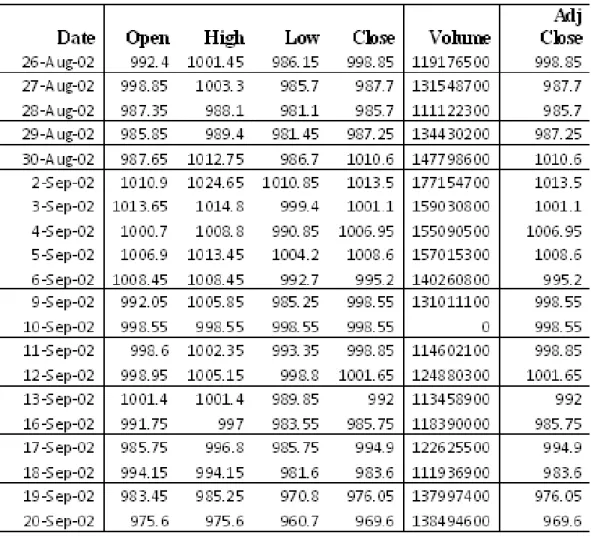
Considering all kinds of available data source, we chose Yahoo! It is because Yahoo! provided Indian, American’s and other countries stock market data, so that we didn’t need to collect the stock data from different places, this could ensure a uniform style format of data, which could facilitate our data pre-processing. Besides, it is free to download the data from Yahoo! which is also another reason that we chose to use it. Data were collected from [10]. Common fields of stock market datasets are Date, open, high, low, close, volume and adj. close. Dataset format is shown as following.
Table 1: Raw data
Data Pre-processing
Sometimes, data in the stock market is dirty, this means the data may be: incomplete: lacking attribute values, deficient certain attributes of interest, or containing only aggregate data noisy. Therefore, if no quality data, then the result will be no quality too. Good result must be based on quality data. For example, duplicate or missing data may cause incorrect or even misleading statistics. Thus, in this section, it is important that the missing values have been filled, smooth noisy data, identify or remove outliers, and resolve inconsistencies
Data Preparation
Before implementing the data mining algorithm, we did some preparation work, it was collecting the financial data. Because we were using the technical analysis way to do the forecasting, but not the fundamental analysis, when we prepared our data, we were not looking for the financial statement like the annual reports of the company
nor the interest rate of the country. What we needed are the historical stock quotes. Intuitively, based on the EMH, the price of the stock yesterday is going to have the most impact on the price of the stock today. Thus as we go along the time-line, data-points which are nearer to today’s price point are going to have a greater impact on today’s price. We add one more attribute to the above attributes; this attribute will act as our label for predicting the movements of the stock price. This attribute will be called “Indicator” and will be dependent on the other available attributes. For our experiments we use the EMA (Exponential Moving Average) as the indicator function.
Data Representation
After selecting the features or attributes to be included in the training and testing sets and proper data segments for encoding, the focus is on the representation of the data in the datasets. The data sets in this study are further transformed into ten days closing prices and the training entries are based on these scaled closing prices values.
The un-processed data were full of noises, which mean there were instances that would impede our later data processing, and would affect the result of the data mining if we didn’t clear away the noises. Because the un-processed data fie is in comma separate value format (.csv) which can be open by the Microsoft Excel.
Data Transformation
Before the data mining, we did one more data preparing step; that is data transformation. In this step, we create more attributes on our stocks’ data, and we also included the class labels in the data file. This stage is important because our data mining methods required this kind of data to work. There are more 20 attributes and 2 class labels we added to our pre-processed data. Each attribute is a TRUE/FALSE question.
For example: 1. Close > EMA20
2. Vol_Avg(1) > Vol_Avg(3)
The 21 TRUE/FALSE-question attributes are generated based on the pre-processed data, which means we would use the combination among OPEN, HIGH, LOW, CLOSE, DM+, DM-, EMA20 and EMA30.
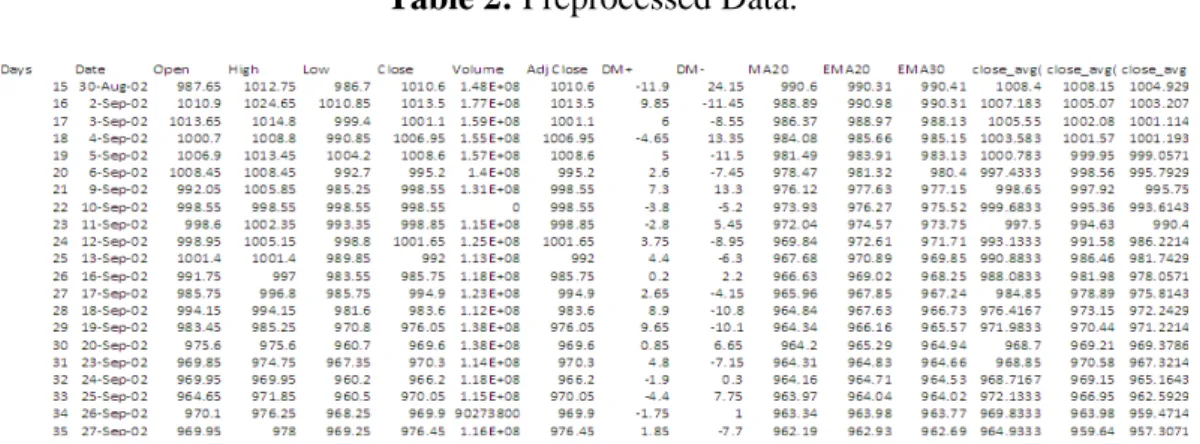
Besides generating the attributes, we also to generate the class labels to our data with the help of Microsoft Excel, because class label is one important element for classification type data mining methods. Table 2 shows the attributes and their values. Table 3 present the transformed attributes. These attributes were transformed from the technical indicators and auxiliary attributes which are shown the right hand side of the table 2.
Table 2: Preprocessed Data.
Table 3: Experimental Attributes (Transformed data).
Attributes Description Values
a1 Close_avg(3)>close_avg(5) TRUE/FALSE
a2 Close_avg(5)>close_avg(7) TRUE/FALSE
a3 Open_avg(3)> Open _avg(5) TRUE/FALSE
a4 Open_avg(5)>Open_avg(7) TRUE/FALSE
a5 Open_avg(3)>Open_avg(7) TRUE/FALSE
a6 low_avg(3)>low_avg(5) TRUE/FALSE
a7 Low_avg(5)>low_avg(7) TRUE/FALSE
a8 High_avg(3)>High_avg(5) TRUE/FALSE
a9 High_avg(5)>High_avg(7) TRUE/FALSE
a10 DM+_avg(3)>DM+_avg(5) TRUE/FALSE
a11 DM+_avg(5)>DM+_avg(7) TRUE/FALSE
a12 DM-_avg(3)>DM-_avg(5) TRUE/FALSE
a13 DM-_avg(5)>DM-_avg(7) TRUE/FALSE
a14 DM+>DM+_avg(3) TRUE/FALSE
a15 DM->DM-_avg(3) TRUE/FALSE
a16 Close>close_avg(3) TRUE/FALSE
a17 Open>open_avg(3) TRUE/FALSE
a18 High>High_avg(3) TRUE/FALSE
a19 Low>Low_avg(3) TRUE/FALSE
a20 EMA20>EMA20_avg(3) TRUE/FALSE
a21 EMA20_avg(3)>EMA20_avg(5) TRUE/FALSE
A22 EMA20_avg(5)>EMA20_avg(7) TRUE/FALSE
CLASS10_2PER Stock price will be increase 2 percent within 10 days
BUY/SALE CLASS15_3PER Stock price will be increase 3 percent
within 15 days
Experimental Setup Rule-Based Classification
Rule-based classification is another type of supervised learning data mining method. The learned model of the rule-based classification is represented as a set of IF-THEN rules. This algorithm provides mechanisms that generate rules by concentrating on a specific class at a time and maximizing the probability of the desired classification. PRISM Algorithm
Prism algorithm generates rules for each class by looking at the training data and adding rules that completely describe all tuples in that class. PRISM identifies a rule that covers many instances in the class, separates out the covered instances, and continues the process with the rest. It measures the success of a rule by the formula: p/t, where t is a total number of instances, and p is number of those that are positive. Screen Shots
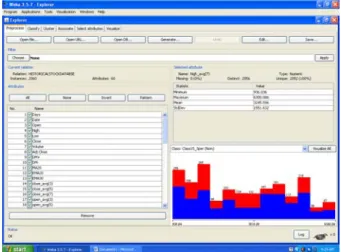
Figure 1: Weka Explorer for Experiment
Rules Generated from Prism Algorithm Test mode: split 66% train, remainder test === Classifier model (full training set) === Prism rules
---
If a22 = TRUE and a20 = FALSE and a19 = TRUE and a2 = TRUE then BUY If a22 = TRUE and a4 = FALSE and a9 = TRUE and a6 = TRUE then BUY If a22 = TRUE and a6 = FALSE and a5 = TRUE and a4 = FALSE then BUY
If a22 = TRUE and a20 = FALSE and a15 = FALSE and a4 = TRUE and a6 = FALSE then BUY
If a21 = TRUE and a20 = FALSE and a13 = TRUE and a16 = TRUE then BUY If a22 = TRUE and a2 = FALSE and a13 = TRUE and a7 = TRUE then BUY
If a22 = TRUE and a6 = FALSE and a19 = TRUE and a21 = FALSE and a16 =FALSE then BUY
If a21 = TRUE and a6 = FALSE and a20 = FALSE and a1 = TRUE then BUY If a21 = TRUE and a4 = FALSE and a7 = TRUE and a11 = FALSE then BUY
If a22 = TRUE and a7 = FALSE and a12 = TRUE and a14 = FALSE and a4 = TRUE then BUY
…. …. …. …. …. …. …. …. ….
…. …. …. …. …. …. …. …. ….
If a8 = TRUE and a3 = FALSE and a4 = FALSE and a6 = TRUE and a14 = FALSE then BUY
If a22 = TRUE and a12 = FALSE and a1 = TRUE and a8 = FALSE then BUY
If a22 = TRUE and a8 = TRUE and a15 = TRUE and a13 = FALSE and a6 = FALSE then BUY
Conclusion
This paper present induction rules of BSE (Bombay Stock Exchange) Data which may be useful for stock market investors. These rules are generated from Data mining methods with the help of WEKA machine learning Software. Rules were shown in the above section.
References
[1] Chu, F. and Wang, L. (2003). Gene Expression Data Analysis using Support Vector Machine. IEEE.
[2] Dongsong Zhang and Lina Zhou(2004), Discovering Golden Nuggets: Data Mining in Financial Application, Ieee Transactions On Systems, Man, And Cybernetics—Part C: Applications and reviews, vol. 34, no. 4, pp: 513-521. [3] Fayyad, U., Piatetsky-Shapiro, G., and Smyth, P. (1996). From Data Mining to
Knowledge Discovery in Databases. AI Magazine. American Association for Artificial Intelligence.PP- 37-54.
[4] Fayyad, U. (1997). Data Mining and Knowledge Discovery in Database:Implications for Scientific Databases.Proceedings of the IEEE.
[5] Mary K. Obenshain, MAT (2004): Application of Data Mining Techniques to Healthcare Data, Statistics for Hospital Epidemiology,(25),(8), 690-695.
[6] Norashikin binti Ahmad (2003). Pengkelasan Data Kajicuaca Di Dalam Peramalan Hujan Dari Pelbagai Sumber Menggunakan Rangkaian Neural.Universiti Teknologi Malaysia: Master Thesis.
[7] Povinelli, R. J. (2001): Identifying Temporal Patterns for Characterization and Prediction of Financial Time Series Events.J.F. Roddick and K. Hornsby (Eds.): TSDM 2000, LNAI 2007. Springer-Verlag Berlin Heidelberg : 46-61. [8] Weka: Data mining software in java.
[9] Witten I. H., Frank E. (2005): Data Mining, Practical Machine Learning Tools and Techniques, 2nd Elsevier.