2B30: PRACTICAL ASTROPHYSICS
FORMAL REPORT:
O6: The Diffraction
Grating Spectrometer
Adam Hill
Lab partner: G. Evans
Abstract
The calibration of a diffraction grating spectrometer using a source of known wavelength was made. The calibrated spectrometer was then used to determine the wavelengths of lines in the spectra of atomic hydrogen and other atoms. This was achieved by calibrating a transmission diffraction grating using a sodium spectral source, whose line wavelengths were well known. The spectral lines in atomic hydrogen and helium were then measured and their corresponding wavelengths calculated using the data obtained through the calibration. The experimental results yielded an approximation of the Rydberg constant, R, was found; R ≈ 1.09 x 10⁻⁷ m-1.
Contents
Abstract 2
Contents 3
Introduction 4
Experimental Method 5
Experimental Data
• Diffraction Grating Calibration 7
• Measuring the Sodium doublet 8
• Measuring the Hydrogen Balmer series 9
• Measuring the Helium spectral lines 10
Error Analysis 11
Summary of Results 11
Conclusion 13
Appendix A 14
Introduction
When atoms or molecules are excited, for example through heating, then electrons gain energy and are promoted to higher energy levels within the atom or molecule. When the electrons drop down again a photon of light is given off with a specific wavelength corresponding to the energy lost by the electron. Every element or compound has a specific line spectrum associated with it. This leads to spectroscopy being a fundamental tool used by astronomers to determine what astronomical bodies are made up of.
In this experiment a transmission diffraction grating is used. This consists of a mask with a large number of evenly spaced slits. A light from the source passes through a
collimator so that parallel rays of light fall onto the diffraction grating. The rays of light are diffracted through the slits and the diffracted rays recombined to form an image of the collimator slit at the telescope focus. For the diffracted image to have a maximum
intensity the path difference between adjacent slits must contain an integral number of wavelengths, see Fig. 1.
This results in the equation,
1/N (sinθp - sinθi) = pλ (1) Where: -
θp = diffracted angle
θi = incident angle
N = number of lines per unit length of grating p = order of interference
λ = wavelength of light
θ
pθ
i1/N Figure 1: Diffraction at the grating
The angular deviation of the beam, D, is given by the formula below, D = θp - θi (2)
The undeviated beam, when D=0, corresponds to the zeroth order, i.e. p=0.
When the grating is normal to the beam, θi =0°, θp=D. From equation (1) we thus get, SinD = pNλ (3)
Experimental Method
The experimental apparatus was set up as shown below, Fig. 2.
Spectra source
Telescope
Turntable vernier
Collimator Telescope
vernier
Diffraction
grating Turntable
slit
Angular scale Figure 2: Experimental apparatus
Procedure
Before any measurements were taken the spectrometer had to be adjusted and calibrated.
• The telescope eyepiece was focussed on the crosswire and adjusted until the crosswire was in sharp focus.
• The axes of the telescope and collimator were set to be perpendicular.
• The vertical angle of the grating plane was made perpendicular to the incident beam and the grating is set to be normal to the beam in the horizontal plane. To make these adjustments the following procedure was carried out.
1. The telescope was set on the undeviated image of the slit and its angular position recorded.
2. The telescope was rotated through ninety degrees to make the telescope and collimator axes perpendicular.
3. The grating was rotated so that the reflected image from its front was centred in the telescope. This set the grating at a 45° angle to the horizontal.
4. To adjust the vertical angle of the grating, the vertical centre of the collimator slit was reduced in length to a small element about the centre. 5. The reflected image was observed in the telescope and the grating
levelling screws adjusted until the slit centre was aligned with the horizontal crosswire.
6. The grating angle was recorded and the grating rotated 45° to make it perpendicular to the collimator axis.
• To ensure that the grating rulings were parallel to the spectrometer axis, the levelling screws were adjusted such that on rotation of the telescope the image of the slit centre stays in the same place.
Experimental Data
Calibration of the grating
Through the calibration of the grating we found the number of lines per unit length of the grating. This was done using the sodium lamp as the light source. The diffraction angle, θp (deviation from straight through image), was measured for one of the
sodium lines in as many orders as possible. Table 1
Order (p) Telescope Angle θθθθp Sin (θθθθp)
(º) (º) (4 s.f.)
0 220.1011 0.0000 0
1 210.0333 10.0678 0.1748
2 199.5000 20.6011 0.3519
3 188.0056 32.0956 0.5313
4 174.5611 45.5400 0.7137
5 155.6389 64.4622 0.9023
-1 230.1861 -10.0850 -0.1751
-2 240.4278 -20.3267 -0.3474
-3 251.2750 -31.1739 -0.5176
-4 262.2389 -42.1378 -0.6709
The data in Table 1 was plotted resulting in Graph 1.
To find the equation of the line the least squares method was used. This yielded a measurement for the gradient of the line, m, of m = 1.75 +/- 0.01 x10⁻¹.
Equation (3) gave,
Sin(D) = N p
Therefore the gradient of the line should be m = N .
N = 1.75 +/- 0.01 x10-1 = 589 x 10-9 m N = 297 +/- 2 x 10³ m-1
This gives the number of lines per mm for the diffraction grating at, N ≈ 300 lines mm-1 (2 s.f.)
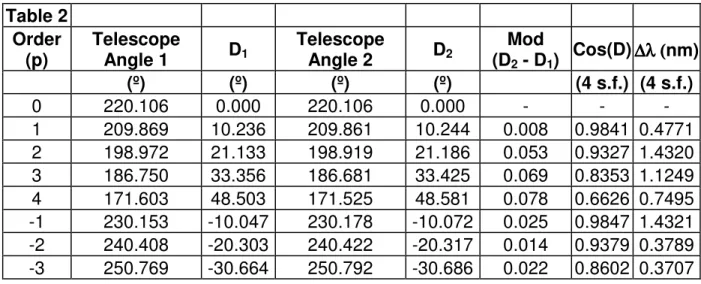
The Sodium Doublet
The separation of the sodium doublet was also measured to as many orders as possible. The data collected is displayed below in Table 2.
Table 2 Order
(p) Telescope Angle 1 D1 Telescope Angle 2 D2 (DMod
2 - D1) Cos(D) ∆λ (∆λ (∆λ (∆λ (nm)
(º) (º) (º) (º) (4 s.f.) (4 s.f.)
0 220.106 0.000 220.106 0.000 - - -
1 209.869 10.236 209.861 10.244 0.008 0.9841 0.4771
2 198.972 21.133 198.919 21.186 0.053 0.9327 1.4320
3 186.750 33.356 186.681 33.425 0.069 0.8353 1.1249
4 171.603 48.503 171.525 48.581 0.078 0.6626 0.7495
-1 230.153 -10.047 230.178 -10.072 0.025 0.9847 1.4321
-2 240.408 -20.303 240.422 -20.317 0.014 0.9379 0.3789
-3 250.769 -30.664 250.792 -30.686 0.022 0.8602 0.3707
The data shown in Table 2 was used to calculate the angular separation of the sodium doublet.
Equation (3) gives,
Sin(D) = N p Differentiating gives,
Cos(D) ∆D = pN∆λ
This gives,
∆λ = Cos(D) ∆D/ pN (4)
Using the data in table 2 and the statistical equations from Appendix A, the mean, standard deviation, standard deviation of the sample and standard error on the mean can be found.
< ∆λ > = 8.809 x 10⁻¹⁰ m (4 s.f.) s = 4.226 x 10⁻¹⁰ m (4 s.f.)
σ = 4.564 x 10⁻¹⁰ m (4 s.f.)
σm = 1.597 x 10⁻¹⁰ m (4 s.f.) This gives an average value for ∆λ as,
0.8 +/- 0.2 nm (4 s.f.)
The sodium doublet is found at 589nm and 589.6 nm. This gives a true value of ∆λ of 0.6 nm. This is within the uncertainty of the experimental measurement.
Measurement of the Balmer Series
With the diffraction grating calibrated it became possible to measure the Hydrogen Balmer series. The angle of the violet, green and red lines produced by the hydrogen source were measured to as high an order as possible, the results are displayed in Table 3 below.
Table 3
Order Telescope Angle (º)
Violet line Green/blue line Red line
0 220.1083 220.1083 220.1083 1 213.9 211.9667 209.0861 2 205.2944 203.6167 197.6556
3 197.9 195 185.4083
4 187.6694 185.8667 171.1444 5 181.3056 175.7361 151.8667 -1 227.7056 229.0361 231.6583 -2 234.7472 237.4167 243.9194
The telescope angles found in Table 3 together with equation (3) can be used to calculate the wavelengths of the lines.
Table 4
Order Violet line Green/blue line Red line
DV Sin (DV) DG Sin (DG) DR Sin (DR)
1 6.2083 0.1081 8.1417 0.1416 11.0222 0.1912 2 14.8139 0.2557 16.4917 0.2839 22.4528 0.3819 3 22.2083 0.3780 25.1083 0.4243 34.7000 0.5693 4 32.4389 0.5364 34.2417 0.5627 48.9639 0.7543 5 38.8028 0.6266 44.3722 0.6993 68.2417 0.9288 -1 -7.5972 -0.1322 -8.9278 -0.1552 -11.5500 -0.2002 -2 -14.6389 -0.2527 -17.3083 -0.2975 -23.8111 -0.4037
The data in Table 4 is plotted in Graph 2. To find the equations of the lines of best fit that would correspond to the plots in Graph 2, the least squares method was applied. This gives us the gradient of each line.
Using equation (3) we find that the gradient of each line should be Nλ. Violet line, m = 1.28 +/- 0.02 x10⁻¹
Measurement of the atomic spectrum of Helium
The previous part of the experiment was repeated using a Helium source instead of the Hydrogen lamp. The readings obtained are n Table 5 below.
Table 5
0rder Telescope Angle (°°°°)
Violet Green Orange Red
0 220.1056 220.1056 220.1056 220.1056 1 212.5056 211.6333 209.8861 208.0611 2 204.75 203.8528 199.8694 197.1139 3 146.8722 194.1056 189.4 185.1472 4 189 184.8528 178.0917 171.1972 -1 227.6722 228.8083 231.6722 232.2 -2 235.7472 237.8528 241.325 244.3028
The telescope angles found in Table 5 together with equation (3) can be used to calculate the wavelengths of the lines.
Table 6
Order Violet line Green/blue line Orange line Red line
DV Sin (DV) DG Sin (DG) DO Sin (DO) DR Sin (DR)
1 7.6000 0.1323 8.4722 0.1473 10.2194 0.1774 12.0444 0.2087 2 15.3556 0.2648 16.2528 0.2799 20.2361 0.3459 22.9917 0.3906 3 73.2333 0.9575 26.0000 0.4384 30.7056 0.5106 34.9583 0.5730 4 31.1056 0.5166 35.2528 0.5772 42.0139 0.6693 48.9083 0.7537 -1 -7.5667 -0.1317 -8.7028 -0.1513 -11.5667 -0.2005 -12.0944 -0.2095 -2 -15.6417 -0.2696 -17.7472 -0.3048 -21.2194 -0.3619 -24.1972 -0.4099
Using the same method as for the Hydrogen Balmer series the wavelengths of the lines can be calculated.
Violet line, m = 1.312 +/- 0.009 x10⁻¹
λ = 441.1 nm (4 s.f.) Green line, m = 1.46 +/- 0.01 x10⁻¹
λ = 492.6 nm (4 s.f.) Orange line, m = 1.73 +/- 0.03 x10⁻¹
λ = 583.3 nm (4 s.f.) Red line, m = 1.94 +/- 0.03 x10⁻¹
Error Analysis
The primary random error associated with this experiment is the human reading of the rotation angle of the telescope. As an initial reading and then a final reading are taken this error is compounded.
The error in the telescope scale is +/- 5”.
However due to human error in reading the Vernier scale a more realistic angle error would be +/- 30”.
The overall error in D is, (∆D)2 = (∆D1)2 + (∆D2)2
∴∆D = +/- 42”
This would affect the wavelength calculations as,
λ = SinD /pN
∴∆λ = cosD x ∆D/Np
∴∆λ/λ = +/- cot D x ∆D
This formula gives the error in each separate measurement of the wavelength of the spectral lines. However the measurements obtained used least squares to find the overall average wavelength making this formula difficult to apply to the collected data.
Summary of Results
The calibration of the diffraction grating yielded a value for N, the number of lines per unit length of;
N ≈ 298 +/- 2 lines mm-1
The separation of the sodium doublet yielded a value of,
∆λ = 0.8 +/- 0.2 nm
The true value falls within the experimental value as, ∆λ =0.6 nm. The wavelengths of the Hydrogen Balmer lines were found to be,
The Rydberg constant, R is given by, 1/λij = RZ2 [1/j2 – 1/i2] where,
Z = atomic number
j and i = energy levels within the atom. For the violet line i=5; j=2
For the green line i=4; j=2 For the red line i=3; j=2
The corresponding approximations for R are: Violet, R = 1.105 x 10⁻⁷ m-1
Green, R = 1.033 x 10⁻⁷ m-1 Red, R = 1.125 x 10⁻⁷ m-1 The mean value of R,
<R> = 1.09 x 10⁻⁷ m-1 The actual value of R is, R = 1.097 x 10⁻⁷ m-1 (2)
The wavelengths of the Helium spectrum were found to be,
Colour Measured value (nm) Uncertainty (nm) True Value (nm)3
Violet 441 3 443.7
Green/blue 493 4 492
Orange 583 8 587
Red 654 9 656
It can be seen that the true values of the Helium spectral lines fall within the errors of the experimental measurements.
Conclusion
The results obtained from the experiment gave approximate values of the separation of the sodium doublet as,
0.8 +/- 0.2 nm (1 s.f.)
The known separation of the doublet is 0.6 nm, which just falls within the experimental uncertainty giving us an accurate result.
The values of the wavelengths of the Hydrogen Balmer lines were found to be, Balmer line Measured value (nm) Uncertainty (nm) True Value (nm)1
χ 431 7 434
β 479 3 486
α 640 6 656
These values fall relatively close to the true values although they fall outside of the errors.
The values for the Hydrogen Balmer series also gave rise to an approximation of the Rydberg constant, R
R = 1.09 x 10⁷ m-1 (3 s.f.)
The actual value of R is given as, R = 1.097 x 10⁷ m-1 so the experimental measurement was an accurate approximation.
The values of the Helium spectral lines were found to be,
Colour Measured value (nm) Uncertainty (nm) True Value (nm)3
Violet 441 3 443.7
Green/blue 493 4 492
Orange 583 8 587
Red 654 9 656
The true values agree very closely with those measured and fall within the experimental uncertainty.
The errors quoted in the results are statistical errors calculated from the sample data. More precise analysis would include a method of calculating the known actual errors. These could have been found for individual measurements but could not be incorporated into the least squares method.
As the angular separation between lines is smaller at low orders any error in measurement would have a larger effect on the calculations than the higher order measurements. This
Appendix A
Statistical formulae (4)
The mean, <x> = Σxi/N
The standard deviation, s = √{[Σ(∆xi - <x>)2]/N} The standard deviation, σ = s√[N/N-1]
of the sample.
References
1 The American Institute of Physics Handbook (12th edition)
2 Introduction to the Structure of Matter, JJ Brehm & WJ Mullin, Wiley (inside cover)
3 The American Institute of Physics Handbook (12th edition) 4 Laboratory II: Student Handbook, session 1999/2000