Technical Report
NetApp AFF8080 EX Performance and Server
Consolidation with Microsoft SQL Server 2014
Workload Engineering, NetApp June 2015 | TR-4403
Abstract
This report provides a performance and server consolidation summary for NetApp® and partner systems engineers who are interested in assessing Microsoft SQL Server database performance and return on investment (ROI) with a NetApp AFF8080 EX storage system. NetApp All Flash FAS (AFF) systems uniquely combine the extreme performance capability of flash media with the industry-leading NetApp Data ONTAP® platform to provide performance acceleration, operational agility, best-in-class data protection, and business continuance for database deployments.
2 NetApp AFF8080 EX SQL Performance and Storage Consolidation ® 2015 NetApp, Inc. All Rights Reserved. TABLE OF CONTENTS
1 Introduction ... 4
1.1 Data ONTAP FlashEssentials Empowers All Flash FAS Performance ...4
1.2 NetApp Clustered Data ONTAP 8.3.1 ...4
1.3 Storage Efficiency ...4
1.4 Microsoft SQL Server 2014 ...5
1.5 Database Server Consolidation ...5
2 Executive Summary... 6
2.1 Measuring Performance ...6
2.2 Improving CPU Utilization ...7
2.3 Enabling Database Consolidation ...7
3 Measuring Performance ... 7
3.1 Test Methodology ...7
3.2 Hardware and Software ...8
3.3 Network Design ...9
3.4 Database Layout and Storage Provisioning Design ...9
3.5 Workload Design ... 10
3.6 AFF8080 EX SQL Server 2014 Test Results ... 11
3.7 Storage Efficiency Test Results ... 11
4 Improving SQL Server CPU Utilization ... 12
4.1 Test Methodology ... 12
4.2 Hardware and Software ... 13
4.3 Database Layout and Storage Provisioning Design ... 14
4.4 SQL Server Utilization Test Results ... 15
5 Enabling Database Consolidation ... 16
6 Best Practices ... 18
7 Conclusion ... 18
References ... 19
Version History ... 19
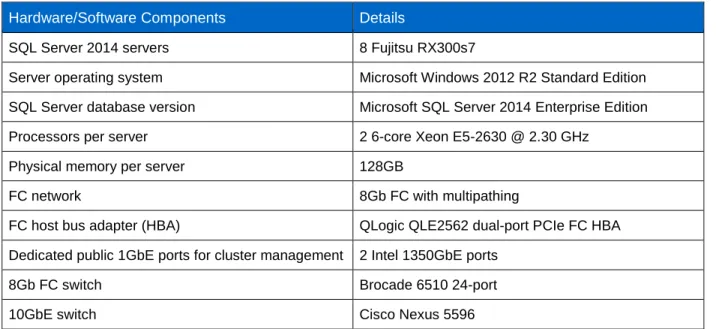
LIST OF TABLES Table 1) SQL Server hardware and software components. ...8
3 NetApp AFF8080 EX SQL Performance and Storage Consolidation ® 2015 NetApp, Inc. All Rights Reserved.
Table 2) NetApp storage system hardware and software. ...8
Table 3) Database layout. ... 10
Table 4) SQL Server hardware and software. ... 13
Table 5) NetApp storage hardware and software. ... 13
Table 6) Database layout. ... 14
Table 7) Cost/benefit analysis. ... 18
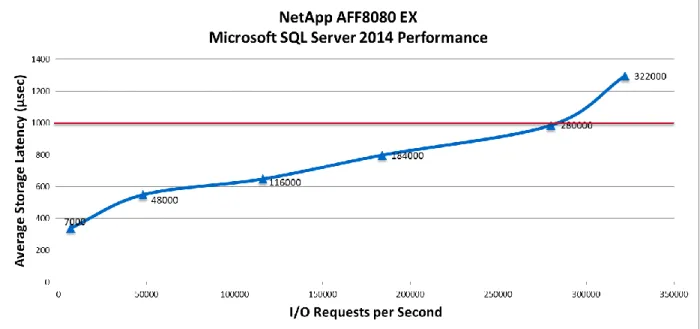
LIST OF FIGURES Figure 1) AFF8080 EX IOPS versus latency. ...6
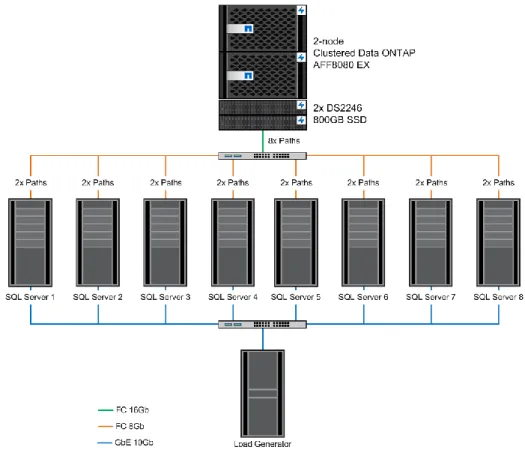
Figure 2) Network design. ...9
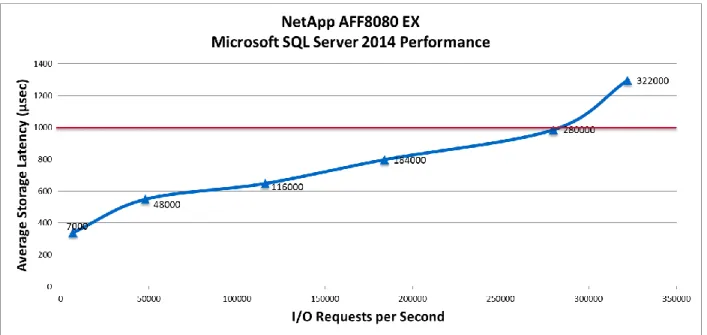
Figure 3) AFF8080 EX SQL Server 2014 performance. ... 11
Figure 4) Network diagram. ... 15
4 NetApp AFF8080 EX SQL Performance and Storage Consolidation ® 2015 NetApp, Inc. All Rights Reserved.
1 Introduction
This document describes the performance of the NetApp AFF8080 EX storage system with Microsoft SQL Server 2014 workloads, a consolidation scenario for SQL Server database servers, and a return-on-investment (ROI) scenario realized by replacing your legacy storage array with a NetApp AFF8080 EX storage system.
1.1 Data ONTAP FlashEssentials Empowers All Flash FAS Performance
NetApp Data ONTAP FlashEssentials is the power behind the performance and efficiency of All Flash FAS (AFF). Data ONTAP is a well-known operating system, but what is not widely known is that Data ONTAP, with its WAFL® (Write Anywhere File Layout) file system, is natively optimized for flash media. Data ONTAP FlashEssentials encapsulates key features that optimize solid-state drive (SSD)performance and endurance, including the following:
Mars™ operating system innovations are now in clustered Data ONTAP.
NetApp data-reduction technologies, including inline compression and deduplication, can provide up to 10:1 space savings, on average, for a typical use case. Savings can be further increased by using NetApp Snapshot® and NetApp FlexClone® technologies.
Coalesced writes to free blocks maximize performance and flash media longevity. Rebuilt I/O path optimizes flash performance.
Parallelized processing delivers low latency.
Advanced drive partitioning increases storage efficiency.
Data-fabric readiness enables live workload migration between flash and hard disk drive (HDD) tiers, on premises, or to the cloud.
Quality-of-service (QoS) capability safeguards service-level objectives in multiworkload and multi-tenant environments.
1.2 NetApp Clustered Data ONTAP 8.3.1
An essential feature for SQL Server databases deployed on shared enterprise storage is the ability to deliver consistent and dependable high performance. High performance must be coupled with
nondisruptive operations, high availability, scalability, and storage efficiency. Customers can depend on clustered Data ONTAP 8.3.1 and AFF to provide these essential elements.
Built on clustered Data ONTAP unified scale-out architecture, AFF consistently meets or exceeds the high performance requirements of SQL Server databases. It also provides rich data management capabilities, such as integrated data protection and nondisruptive upgrades and data migration. These features allow customers to eliminate performance silos and seamlessly integrate AFF into a shared infrastructure. Clustered Data ONTAP delivers an enhanced inline compression capability that significantly reduces the amount of flash storage required and carries near-zero effects on system performance. It also provides industry-leading ecosystem integration with database applications that makes administration of databases and storage systems far more efficient when compared with other flash storage solutions on the market. NetApp is a global enterprise scale-out storage and data management fabric provider, and clustered Data ONTAP has been an industry-leading operating system since 2012. Onsite ready but cloud connected, clustered Data ONTAP is a complete solution that is future-proof in a rapidly changing technology environment.
1.3 Storage Efficiency
Simply stated, storage efficiency enables you to store the maximum amount of data within the smallest possible space at the lowest possible cost. The following NetApp storage efficiency technologies can help you realize maximum space savings:
5 NetApp AFF8080 EX SQL Performance and Storage Consolidation ® 2015 NetApp, Inc. All Rights Reserved. Inline compression. Data compression reduces the disk space required, regardless of storage
protocol, application, or storage tier. Inline compression also reduces the data that must be moved to SSDs, thereby reducing the wear on SSDs.
Inline and always-on deduplication. Data deduplication cuts storage requirements by reducing redundancies in primary, backup, and archival data. Inline deduplication of zeros speeds up VM provisioning by 20% to 30%. Always-on deduplication running every minute provides more space savings than postprocessed deduplication.
Snapshot technology. NetApp Snapshot technology provides low-cost, instantaneous, point-in-time copies of the file system (volume) or LUN by preserving Data ONTAP architecture and WAFL
consistency points without affecting performance. NetApp SnapManager® integrates with SQL Server Virtual Device Interface (VDI) to create application-consistent Snapshot copies of production-level SQL Server databases with no downtime for the production database.
Thin provisioning. Thin provisioning, implemented by NetApp at the NetApp FlexVol® volume and LUN level, defers storage purchases by keeping a common pool of free storage available to all applications.
Thin replication. Thin replication is at the center of the NetApp data protection software portfolio, which includes NetApp SnapMirror® and NetApp SnapVault® software. SnapVault thin replication enables more frequent backups that use less storage capacity because no redundant data is moved or stored. SnapMirror thin replication protects business-critical data while minimizing storage capacity requirements.
RAID DP. NetApp RAID DP® technology protects against double disk failure without sacrificing performance or adding disk-mirroring overhead.
FlexClone volumes. FlexClone virtual cloning reduces the need for storage by enabling multiple, instant, space-efficient, writable copies.
1.4 Microsoft SQL Server 2014
The NetApp solution for Microsoft SQL Server delivers the performance, manageability, scalability, and data protection that IT organizations need to meet even the most stringent SQL Server business requirements. NetApp helps organizations maximize the full potential of their SQL Server investment by accelerating database application performance and speeding application deployment from months to weeks. Companies that deploy NetApp solutions for SQL Server also realize the availability and flexibility benefits required to be competitive in today’s business environment.
1.5 Database Server Consolidation
In today’s data centers, HDD-based, legacy, shared storage systems serve up data to large numbers of individual SQL Server systems and related applications. As your environment grows and you add more applications with ever-increasing performance requirements, these legacy storage systems struggle to keep up with the demand, requiring cost-prohibitive upgrades to maintain high performance in the future. This struggle can lead to significant underutilization of database server data center assets because database applications must wait on slower legacy storage systems that no longer deliver the type of performance that users expect from SQL Server 2014. The result is high storage latencies, which slow down your applications and cause widespread performance issues that can severely limit your ability to derive the full value of your database servers.
In addition, with changes in the way Microsoft licenses SQL Server 2014, it can become expensive to maintain large numbers of SQL Server 2014 servers that cannot take full advantage of server CPU resources. Eliminating storage limitations in your legacy environment by using an AFF8080 EX can unlock this potential and allow you to consolidate your SQL Server environment onto fewer physical servers, save money on licenses, reduce the footprint in your data center, and save on power, cooling, and administrative overhead associated with maintaining more SQL Server instances than are necessary to handle the workload.
6 NetApp AFF8080 EX SQL Performance and Storage Consolidation ® 2015 NetApp, Inc. All Rights Reserved.
2 Executive Summary
To showcase the benefits of the AFF8080 EX, NetApp conducted the following studies:
Measuring AFF8080 EX Microsoft SQL Server 2014 performance. NetApp measured the data throughput, input/output operations per second (IOPS), and average latency of the AFF8080 EX storage system running clustered Data ONTAP 8.3.1 with an industry-standard SQL Server 2014 online transaction processing (OLTP) workload.
Improving SQL Server database CPU utilization with AFF8080 EX. We compared the SQL Server 2014 database server CPU utilization of servers attached to an HDD-based legacy storage system to servers attached to an AFF8080 EX storage system. The goal of the testing was to show how the performance capabilities of the underlying storage system directly affect the utilization efficiency of database server assets.
Enabling SQL Server database consolidation using AFF8080 EX. Changes in the licensing options with SQL Server 2014 can significantly increase costs for database servers that contain high numbers of CPU cores. Therefore, you can potentially realize significant savings by reducing the number of SQL Server 2014 servers in your environment. To investigate this possibility, NetApp leveraged the performance improvements provided by the AFF8080 EX to enable a SQL Server 2014 database consolidation effort that reduced the number of physical database servers by 50%.
2.1 Measuring Performance
NetApp conducted a study to measure the performance of an AFF8080 EX storage system running clustered Data ONTAP 8.3.1 under an industry-standard SQL Server 2014 OLTP workload. The goal of the study was to determine the peak sustained throughput, IOPS, and average latency of the AFF8080 EX storage system while running this SQL Server workload.
We ran an OLTP Transaction Processing Performance Council Benchmark E (TPC-E) workload on a two-node AFF8080 EX cluster with two DS2246 shelves containing a total of 48 800GB SSD drives. We tested our cluster at a range of load points that drove the storage to peak CPU utilization. At each load point, we collected information on the storage throughput, IOPs, and latency.
As shown in Figure 1, the SQL Server performance that we tested showed that the AFF8080 EX throughput increased from 7K IOPS to a peak performance of 322K IOPS. For all load points below the peak, we were able to maintain consistent storage latencies below 1ms.
7 NetApp AFF8080 EX SQL Performance and Storage Consolidation ® 2015 NetApp, Inc. All Rights Reserved. In addition, we measured the overall storage efficiency savings of our SQL Server database
implementation deployed on Data ONTAP 8.3.1. In this test configuration, a total space savings of 17:1 can be expected with the TPC-E workload. This total savings is attributed to the overall efficiency
effectiveness of RAID DP, Snapshot copies, and inline compression. We also found that we were able to achieve a 1.8:1 space savings from inline compression against a Microsoft Server SQL 2014 database in a real-world IT environment.
2.2 Improving CPU Utilization
By replacing a legacy storage system with an AFF8080 EX, we observed significant reductions in read latencies in the database environment along with corresponding increases in total IOPS and database server CPU utilization as follows:
An overall reduction in read latencies at the database hosts of over 95% A greater than 4x improvement in overall IOPS observed at the storage
A greater than 4x improvement in the CPU utilization observed on the SQL Server database servers In addition to these substantial improvements, we also found significant performance capacity remaining on the AFF8080 EX that would have enabled it to deliver even better performance than we observed in these specific tests.
2.3 Enabling Database Consolidation
Replacing your legacy storage system with an AFF8080 EX can significantly improve your overall database performance and increase CPU utilization on the SQL Server 2014 servers. Changes in the SQL Server 2014 licensing options can greatly increase costs for database servers that contain high numbers of CPU cores. Thereby reducing the number of SQL Server 2014 servers in your environment can potentially reduce your operational costs.
We leveraged the performance improvements provided by the AFF8080 EX to enable a SQL Server 2014 database consolidation exercise that allowed us to reduce the number of physical database servers by 50% while saving more than $1 million in SQL Server 2014 license costs over a three-year period.
3 Measuring Performance
NetApp studied the performance of an AFF8080 EX storage system to determine its peak sustained throughput, IOPS, and average latency. The following sections describe the methodology and design considerations used to test the AFF8080 EX while running a standard SQL Server workload.
3.1 Test Methodology
In this study, we used a load-generation tool that simulated an industry-standard TPC-E OLTP
warehouse transaction workload against the SQL Server 2014 test configuration. The workload generated a read- write ratio of approximately 90:10 against the SQL Server databases in the test configuration. We created a SQL Server environment with eight database servers connected through Fibre Channel (FC) to the AFF8080 EX. Each server created a 1.4TB SQL Server database on the AFF8080 EX storage system for a total data size of 11.2TB across the eight SQL Server databases. Using the eight SQL Server databases and an OLTP load generator, we measured the peak performance of the storage system by generating a workload designed to maximize the storage system utilization. We then reran the test while ramping down the server count down from eight. This allowed us to gather performance metrics at a range of different load points.
In addition to the performance validation testing described earlier, we also measured the inline
compression savings of the data written to the SQL Server database. The amount of compression that can be achieved is highly dependent on the specific data that is written and stored in the database. To
8 NetApp AFF8080 EX SQL Performance and Storage Consolidation ® 2015 NetApp, Inc. All Rights Reserved. make sure that our compression savings were reflective of real-world conditions, we used data from a production-level SQL Server 2014 database from a real-world IT environment to evaluate clustered Data ONTAP 8.3.1 inline compression. To test the inline compression, we copied the database onto the AFF8080 EX storage system, allowing Data ONTAP to parse the data stream and conduct inline data compression. We also measured the inline compression savings realized from our TPC-E OLTP workload.
3.2 Hardware and Software
For this study, we configured eight SQL Server 2014 database servers on eight Fujitsu RX300s7 servers. We connected the eight servers to a two-node AFF8080 EX through 16Gb FC, with four servers on each node of the storage system. We connected each node of the AFF8080 EX to a single DS2246 shelf and populated each shelf with 24 800GB SSD drives.
Table 1 and Table 2 list the hardware and software components used for the SQL Server performance test configuration.
Table 1) SQL Server hardware and software components.
Hardware/Software Components Details
SQL Server 2014 servers 8 Fujitsu RX300s7
Server operating system Microsoft Windows 2012 R2 Standard Edition SQL Server database version Microsoft SQL Server 2014 Enterprise Edition Processors per server 2 6-core Xeon E5-2630 @ 2.30 GHz
Physical memory per server 128GB
FC network 8Gb FC with multipathing
FC host bus adapter (HBA) QLogic QLE2562 dual-port PCIe FC HBA Dedicated public 1GbE ports for cluster management 2 Intel 1350GbE ports
8Gb FC switch Brocade 6510 24-port
10GbE switch Cisco Nexus 5596
Table 2) NetApp storage system hardware and software.
Hardware/Software Components Details
Storage system AFF8080 EX configured as a highly available (HA) active-active pair
Clustered Data ONTAP version 8.3.1
Total number of drives 48
Drive size 800GB
Drive type SSD
FC target ports 8 16Gb ports (4 per node)
Ethernet ports 4 10Gb ports (2 per node)
9 NetApp AFF8080 EX SQL Performance and Storage Consolidation ® 2015 NetApp, Inc. All Rights Reserved.
Hardware/Software Components Details
Ethernet logical interfaces (LIFs) 4 1Gb management LIFs (2 per node connected to separate private VLANs)
FC LIFs 8 16Gb data LIFs
3.3 Network Design
This section provides the network connectivity details for the tested configurations. The network diagram in Figure 2 shows that the FC SAN was deployed with a Brocade 6510 16Gb FC switch. Each server and storage controller node had four ports connected into the SAN. The multiple ports used in the FC SAN configurations provided both HA through multipathing and increased bandwidth. At no point in the testing did the network connectivity create a bottleneck.
Figure 2) Network design.
3.4 Database Layout and Storage Provisioning Design
Table 3 summarizes the layout for the SQL Server database.We used eight 1.4TB databases to host the simulated warehouse transaction environment. Each storage system node housed a single aggregate containing 24 800GB SSD drives that were subdivided into RAID DP groups, plus one spare drive. We used controller one’s data aggregate to store the first four database files, logs, and temp files and controller two’s data aggregate to store the other four database files, logs, and temp files.
As a best practice, NetApp recommends splitting each database across multiple volumes with each volume assigned to a unique LUN.
10 NetApp AFF8080 EX SQL Performance and Storage Consolidation ® 2015 NetApp, Inc. All Rights Reserved. For the AFF8080 EX, we used clustered Data ONTAP advanced drive partitioning to create two partitions on each shelf: one for the root aggregate and one for the data aggregate.
Table 3) Database layout.
Storage Aggregate Name Volume Name LUN Size (GB) Vol Size (GB) File Size (GB) Description
Per controller Used advanced drive partitioning
aggr0 root 55 Total aggregate size = 55GB
aggr_sql 21 data + 2 parity RAID DP + 1 spare
Total aggregate size = 12.7TB
Per DB Db1 200 300 168 Database file 1
Db2 200 300 168 Database file 2 Db3 200 300 168 Database file 3 Db4 200 300 168 Database file 4 Db5 200 300 168 Database file 5 Db6 200 300 168 Database file 6 Db7 200 300 168 Database file 7 Db8 200 300 168 Database file 8
Temp1 1 Temp files
Log1 300 150 26 Log files
The database layout shown in Table 3 was repeated for each of the eight SQL Server databases. For each SQL Server database, the data files were contained in a separate LUN within a separate volume, for a total of 80 volumes and LUNs across all 8 databases.
One igroup containing all of the FC initiators was configured on the cluster. The LUNS were formatted by using Disk Management with GPT and the NTFS file system by using a 64KB block size. The FC SAN was configured on the Brocade switch without zoning. Clustered Data ONTAP provided Asymmetric Logical Unit Assignment (ALUA) communication to the initiators so that optimal paths were used for host I/O access according to the multipathing input/output (MPIO) load-balancing policies on the host.
3.5 Workload Design
The OLTP workload that we used in testing was generated by a Microsoft partner toolkit that created a TPC-E workload. The toolkit, based on the BenchCraft TPC-E toolkit, was used to simulate an OLTP workload of a brokerage firm. Each database server applied the workload to a full set of SQL Server databases, logs, and temp files. We analyzed the workload pattern and found it to be random and composed of 90% reads and 10% writes with an average block size of 8K. We found that SQL Server checkpointing affected the write workload burstiness at the storage level. NetApp recommends setting the frequency of checkpointing and other SQL Server tunings to meet your specific performance
requirements.
To establish the performance boundaries, we tested the environment up to a storage system saturation point. When we reached peak storage utilization, we reduced the workload and measured the IOPS and latency at each load point. At this load level, we verified that the storage system and SQL Server
11 NetApp AFF8080 EX SQL Performance and Storage Consolidation ® 2015 NetApp, Inc. All Rights Reserved. instances could maintain steady-state behavior without failure. We also made sure that there were no bottlenecks across servers or networking systems.
After the peak load using eight database workloads was achieved, we noted the total IOPS, throughput, and storage and server latencies. We then generated a load of 75% peak by using six of the eight available SQL Server instances, a load of 50% peak by using four of the eight available SQL Server instances, a load of 25% peak by using two of the eight available SQL Server instances, and a load of 12.5% peak by using one of the eight available SQL Server instances. We tested at each load level and provided the results in this report.
Note: We took care in these test steps to simulate real database and customer workloads, but we acknowledge that workloads vary across databases. In addition, these test results were obtained in a closed lab environment with no competing workloads on the same infrastructure. In a typical shared-storage infrastructure, other workloads share resources. Your results might vary from those found in this report.
3.6 AFF8080 EX SQL Server 2014 Test Results
As shown in Figure 3, the SQL Server performance test demonstrated that the cluster increased from 7K IOPS to a peak performance of 322K IOPS. For all load points below the peak, we were able to maintain consistent storage latencies below 1ms. Similarly, we found client latencies ranged from 0.35ms to 1.08ms over this same interval.
Figure 3) AFF8080 EX SQL Server 2014 performance.
3.7 Storage Efficiency Test Results
In addition to the performance validation testing described in this report, we also measured the overall storage efficiency savings of our SQL Server database implementation from Data ONTAP 8.3.1. As mentioned in section 3.2 “Hardware and Software,” we used two disk shelves, each containing 24 800GB SSD drives, for a total raw storage of 38.4TB. We used Data ONTAP advanced drive partitioning to partition the drives, install the root partition, and create the data partition by using RAID DP to provide data redundancy, which resulted in total usable storage of 25.5TB. For our TPC-E OLTP testing, we created eight SQL Server databases totaling 11.2TB, including all data, temp, and log volumes.
The amount of compression that can be achieved is highly dependent on the specific data that is written and stored in the database. From our 11.2TB of data, we measured a space savings of 3.9TB from inline
12 NetApp AFF8080 EX SQL Performance and Storage Consolidation ® 2015 NetApp, Inc. All Rights Reserved. compression. This reduction resulted in an effective size of 7.3TB on disk and a storage efficiency ratio of 1.5:1 from inline compression.
Space-efficient NetApp Snapshot copies can provide additional storage efficiency benefits. There is no performance penalty for creating Snapshot copies because data is never moved as it is with other copy-out technologies. The cost for Snapshot copies is only at the rate of block-level changes, not at 100% for each backup, as is the case with mirror copies. Snapshot technology can help you save on storage costs for backups and restores, and it opens up a number of efficient data management possibilities.
In a typical real-world SQL Server customer deployment, data volume Snapshot copies might be created every two hours and log and temp Snapshot copies every 15 minutes. These Snapshot copies can account for up to an additional 16x storage savings over a 24-hour period. Assuming 5% hourly data overwrites, the storage savings from Snapshot copies would be 7TB, for a total of 117TB in savings, resulting in a storage savings ratio of 10:1 from Snapshot efficiencies. The total storage savings ratio achieved through both inline compression and Snapshot copies would be 17:1. We discovered that deduplication provided little additional storage savings in our environment, so we did not enable this feature.
To further verify that our inline compression savings reflected real-world conditions, we used production SQL Server 2014 database data from an IT environment to evaluate Data ONTAP 8.3.1 inline
compression. To test the inline compression, we copied the 444GB database remotely into our local test configuration system, allowing Data ONTAP to parse the data stream and conduct inline compression on the data. In this scenario, inline compression accounted for a storage savings of 196GB, resulting in a 1.8:1 data compression ratio.
4 Improving SQL Server CPU Utilization
HDD-based legacy storage systems can introduce performance issues into your SQL Server environment by forcing database servers to wait longer than necessary for I/O responses from the storage. The longer the database servers wait on the storage, the more time it takes to complete transactions, which affects users and causes underutilization of CPU resources on your SQL Server database servers.
Replacing a slower legacy storage system with an AFF8080 EX can lead to significantly better performance, lower latencies, and better database server CPU utilization.
4.1 Test Methodology
We conducted a study to measure the performance and database server CPU improvements that were observed as a result of replacing a performance-limited, HDD-based legacy storage system with a NetApp AFF8080 EX storage system running clustered Data ONTAP 8.3.1 under an industry-standard SQL Server 2014 OLTP workload.
The goal of this test was not to measure the maximum performance of the AFF8080 EX, but rather to use a consistent workload to measure the improvement in overall performance and database server CPU utilization observed after replacing the underperforming legacy storage system with an AFF8080 EX in an existing SQL Server 2014 environment. For these tests, the legacy storage system was configured with a total of 144 450GB 15K RPM hard drives.
We created a test configuration with 10 database servers connected through FC to both the legacy storage system and the AFF8080 EX. Each of the 10 servers ran SQL Server 2014 Enterprise Edition and created a small 320GB SQL Server database on both the legacy storage system and on the
AFF8080 EX storage system, for a total database size of approximately 3.2TB across the 10 SQL Server databases.
To generate a load in the test environment, we used the publically available HammerDB workload generator to drive an OLTP-like workload simultaneously from each of the 10 database servers. Initially, we directed the workload to the SQL Server databases on the legacy storage array. We increased the
13 NetApp AFF8080 EX SQL Performance and Storage Consolidation ® 2015 NetApp, Inc. All Rights Reserved. workload until we observed unacceptable performance in the OLTP environment that was using the legacy storage system. For this effort, we defined unacceptable performance as the inability to deliver consistent read latencies under 20ms as measured by observing Windows Performance Monitor (Perfmon) counters on the SQL Server 2014 database servers.
We then noted the number of HammerDB users required and recorded this as our baseline configuration. In addition, we recorded the IOPS observed at the legacy storage system as well as the average CPU utilization on each of the 10 SQL Server 2014 database servers by using Perfmon.
After determining the baseline performance of the legacy storage system, we used the identical database and HammerDB configurations, directed the same workload to the AFF8080 EX configured with 48 400GB SSDs, and gathered the same metrics.
4.2 Hardware and Software
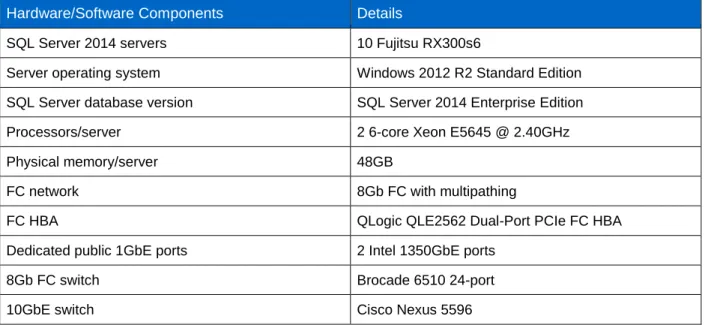
For the study, we configured 10 SQL Server 2014 database servers on 10 Fujitsu RX300s6 servers. We connected the 10 servers to a two-node AFF8080 EX storage controller through 16Gb FC, with 5 servers to each node of the storage controller. We connected each node of the AFF8080 EX to a single DS2246 shelf. We populated each shelf with 24 400GB SSD drives.
Table 4 and Table 5 list the hardware and software components used for testing. Table 4) SQL Server hardware and software.
Hardware/Software Components Details
SQL Server 2014 servers 10 Fujitsu RX300s6
Server operating system Windows 2012 R2 Standard Edition SQL Server database version SQL Server 2014 Enterprise Edition
Processors/server 2 6-core Xeon E5645 @ 2.40GHz
Physical memory/server 48GB
FC network 8Gb FC with multipathing
FC HBA QLogic QLE2562 Dual-Port PCIe FC HBA
Dedicated public 1GbE ports 2 Intel 1350GbE ports
8Gb FC switch Brocade 6510 24-port
10GbE switch Cisco Nexus 5596
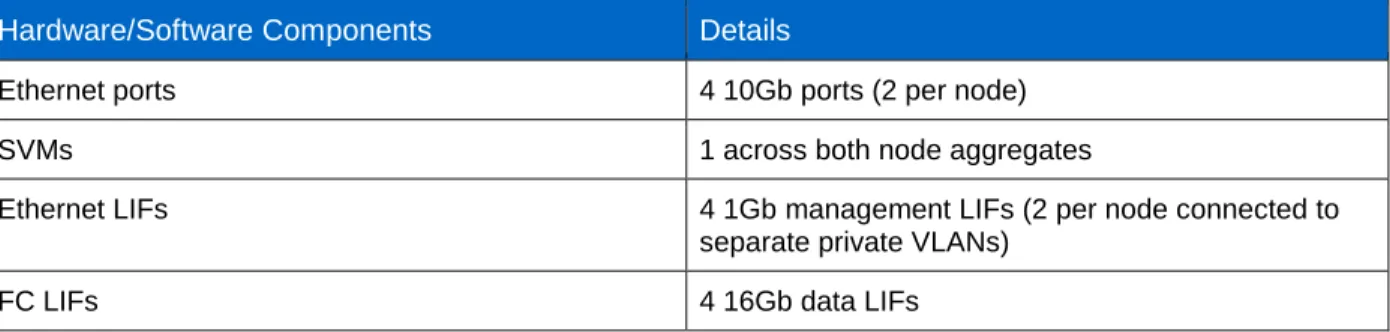
Table 5) NetApp storage hardware and software.
Hardware/Software Components Details
Storage system AFF8080 EX configured as an HA active-active pair
Clustered Data ONTAP version 8.3.1
Total number of drives 48
Drive size 400GB
Drive type SSD
14 NetApp AFF8080 EX SQL Performance and Storage Consolidation ® 2015 NetApp, Inc. All Rights Reserved.
Hardware/Software Components Details
Ethernet ports 4 10Gb ports (2 per node)
SVMs 1 across both node aggregates
Ethernet LIFs 4 1Gb management LIFs (2 per node connected to
separate private VLANs)
FC LIFs 4 16Gb data LIFs
4.3 Database Layout and Storage Provisioning Design
Table 6 summarizes the disk layout for the SQL Server database.The legacy storage system and the AFF8080 EX each contained two storage controllers with their own sets of disk drives. Each node of the legacy storage system contained a total of 72 450GB 15K RPM disk drives. The AFF8080 EX storage controllers contained 24 400GB SSD drives that were subdivided into RAID DP groups, plus one spare drive. The ten databases were spread evenly across the storage controllers of both the legacy storage system and the AFF8080 EX so that each controller handled five databases and included database files, logs, and temp files.
As a best practice for the AFF8080 EX, NetApp recommends splitting each database across multiple volumes with each volume assigned to a unique LUN.
For the AFF8080 EX, we used clustered Data ONTAP advanced drive partitioning to create two partitions on each shelf: one for the root aggregate and one for the data aggregate.
Table 6) Database layout.
Storage Aggregate Name
Volume Name
LUN Size (GB)
Vol Size (GB)
File Size (GB)
Description
Per controller Used advanced drive partitioning
aggr0 root 55 Total aggregate size = 55GB
aggr_sql 21 data + 2 parity RAID DP + 1 spare
Total aggregate size = 6.3TB
Per DB Data01 90 100 40 Database file 1
Data02 90 100 40 Database file 2 Data03 90 100 40 Database file 3 Data04 90 100 40 Database file 4 Data05 90 100 40 Database file 5 Data06 90 100 40 Database file 6 Data07 90 100 40 Database file 7 Data08 90 100 40 Database file 8
TempDB 80 Temp files
15 NetApp AFF8080 EX SQL Performance and Storage Consolidation ® 2015 NetApp, Inc. All Rights Reserved. Each of the 10 databases used the layout described in Table 6 was contained in a separate LUN within a separate volume.
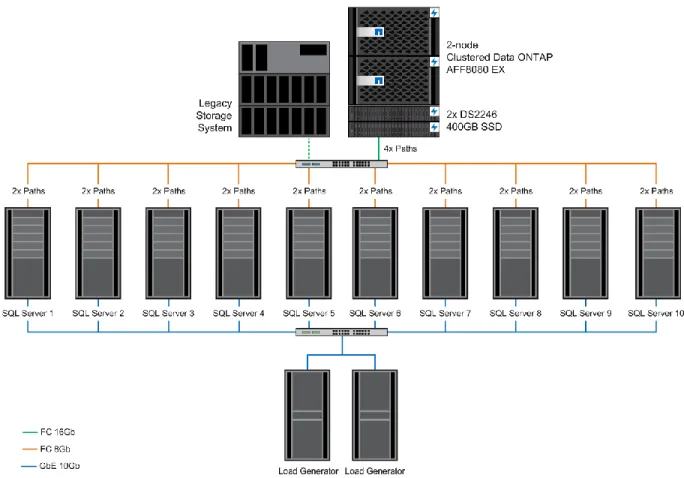
As mentioned earlier, the legacy storage system was connected to the 10 database servers through 8Gb FC connections. We verified connectivity and performance to the legacy storage system before testing. For the AFF8080 EX, a single igroup containing all of the FC initiators was configured on the cluster. For both the legacy storage system and AFF8080 EX, the LUNS were formatted by Disk Management with a GPT NTFS file system with a 64KB block size. The FC SAN was configured on the Brocade switch without zoning. Clustered Data ONTAP provided ALUA communication to the initiators so that optimal paths were used for host I/O access according to the MPIO load-balancing policies on the host. Figure 4 shows a high-level picture of the environment.
Figure 4) Network diagram.
4.4 SQL Server Utilization Test Results
In our test environment, we found that the legacy storage system eventually became the limiting factor, resulting in consistent read latencies of greater than 20ms, where each of the SQL Server database servers used approximately 10% of the total CPU resources on each server.
After replacing the legacy storage system with the AFF8080 EX, we observed the following performance-related improvements:
An overall 95% reduction in read latencies at the database hosts
A greater than 4x improvement in the overall IOPS observed at the storage
16 NetApp AFF8080 EX SQL Performance and Storage Consolidation ® 2015 NetApp, Inc. All Rights Reserved. Although the legacy storage system was fully subscribed, additional performance headroom remained on the AFF8080 EX that would have enabled it to deliver additional performance increases over and above what we observed in these tests.
Figure 5 shows the results of the tests, which demonstrate that eliminating performance bottlenecks caused by slower, HDD-based legacy storage systems can significantly improve the overall performance of your SQL Server 2014 environment. Improved IOPS, lower latencies, and effective use of CPU resources allow your SQL Server systems to process more transactions faster, which can result in more business and happier customers.
Figure 5) Storage IOPS and database server CPU utilization improvements.
5 Enabling Database Consolidation
Through testing, we demonstrated that replacing your performance-limited, HDD-based legacy storage system with an AFF8080 EX can significantly improve your overall performance and allow you to make more efficient use of the SQL Server database server CPU resources in your existing data center. Using AFF8080 EX, storage bottlenecks are almost entirely eliminated. You can now confidently plan to consolidate your SQL Server 2014 database instances onto fewer servers and potentially realize significant savings on SQL Server 2014 licenses, support, power, floor space, and administrative costs. Using the results of the previous testing, we performed an analysis of the existing environment before and after replacing the legacy storage system with an AFF8080 EX. Specifically, we consolidated the 10 SQL Server 2014 instances and related databases that were currently running on 10 physical servers onto fewer physical servers.
The goal of this exercise was to compare the total cost of ownership (TCO) of the existing SQL Server 2014 environment in contrasting scenarios over a three-year period:
In the first scenario, you continue to use the existing legacy storage system for the SQL Server environment by renewing the service agreements with your existing storage and database partners. Because of performance concerns with the legacy storage, you are unable to justify the risk of consolidating your SQL Server 2014 environment at this time.
In the second scenario, you immediately replace the legacy storage system with a new NetApp AFF8080 EX and embark on an effort to consolidate your current database environment from 10
17 NetApp AFF8080 EX SQL Performance and Storage Consolidation ® 2015 NetApp, Inc. All Rights Reserved. physical database servers down to a total of 5, while maintaining the same number of databases and applications in your current environment.
For this analysis, we used the NetApp Realize investment-analysis software application. The NetApp Realize tool has been examined and validated by International Data Corporation (IDC), which concluded that results produced by NetApp Realize are based on sound methodologies. In addition, IDC found that NetApp Realize uses industry-standard default input values that fall within accepted industry ranges. For additional information about the Realize tool, contact your NetApp account representative.
The analysis was conducted based on cash flows, which is the method normally employed for evaluating investment decisions. As mentioned earlier, the storage solution options evaluated included the existing legacy storage system and the AFF8080 EX. Return on investment (ROI) and payback period were calculated for the AFF8080 EX over a three-year period to understand the costs and benefits of consolidating the database environment by replacing the existing legacy storage.
The Realize tool used the existing legacy storage system and the 10 currently allocated database servers running SQL Server 2014 Enterprise Edition as a base for estimating the potential cost savings that could be realized by using the AFF8080 EX. The value of the potential savings was used in the ROI
calculations.
The relevant portions of the existing legacy data storage hardware and software environments, such as support renewal, space, power, and cooling for the legacy environment, were included in the analysis. We also assumed that the legacy environment would be phased out immediately in favor of the AFF8080 EX. For this exercise, we used list prices for Windows Server 2012 R2 and SQL Server 2014 Enterprise Edition licenses and software assurance gathered from the Microsoft website.
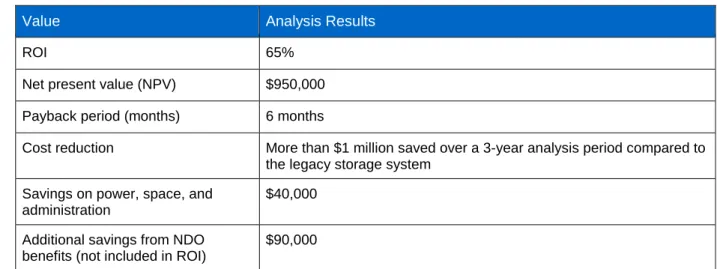
Table 7 provides a summary of the analysis, which revealed the following key points:
Replacing the legacy storage system with an AFF8080 EX combined with the overall database consolidation would yield an ROI of 65%.
Consolidating the SQL Server 2014 environment from 10 physical servers to 5 physical servers and reducing SQL Server 2014 license costs by 50% would achieve more than $1 million in savings over a three-year period.
Reducing the footprint of the overall environment saves power, space, and labor costs.
Replacing the legacy storage system with an AFF8080 EX running clustered Data ONTAP 8.3.1 enables additional savings by using NetApp nondisruptive operations (NDO) features, such as reductions in planned and unplanned down times.
18 NetApp AFF8080 EX SQL Performance and Storage Consolidation ® 2015 NetApp, Inc. All Rights Reserved. Table 7) Cost/benefit analysis.
Value Analysis Results
ROI 65%
Net present value (NPV) $950,000 Payback period (months) 6 months
Cost reduction More than $1 million saved over a 3-year analysis period compared to the legacy storage system
Savings on power, space, and administration
$40,000
Additional savings from NDO benefits (not included in ROI)
$90,000
These findings represent just one possible scenario for consolidating SQL Server 2014 servers with NetApp storage. Contact your local NetApp account representative to perform a server consolidation ROI analysis tailored to your specific requirements.
Finally, we repeated the test, using HammerDB and the database environment after consolidating from 10 servers to 5 servers. For this effort, each of the 5 remaining SQL Server 2014 Enterprise instances drove an OLTP workload to a total of 2 of the 10 original SQL Server databases. We observed the following key points:
As expected, we observed an increase in database server CPU utilization after reducing the number of SQL Server systems.
Overall performance was in line with what we observed in the original environment that used 10 database servers.
6 Best Practices
NetApp recommends the following best practices:
For the most IOPS-intensive OLTP databases, divide the database into multiple files striped across multiple volumes and LUNs (for block protocols).
Set the FC HBA ports with a queue depth of 256.
Set the load-balancing setting for the Microsoft DSM to least queue depth.
This list is not exhaustive. For more information, refer to Microsoft and NetApp documentation.
7 Conclusion
The NetApp AFF8080 EX solution provides extremely high IOPS at consistently low latencies while serving a Microsoft SQL Server 2014 OLTP workload. Our testing showed that the AFF8080 EX throughput increased from 7K IOPS to a peak performance of 322K IOPS as we increased the OLTP workload. For all load points below the peak, we were able to maintain consistent storage latencies below 1ms and provide space-efficiency savings of up to 17:1.
We demonstrated that significant improvements in performance and database server CPU utilization are possible when you replace your older legacy storage system with an AFF8080 EX. Because it delivers excellent performance with consistently low latencies, the AFF8080 EX is a great option to enable additional savings during SQL Server 2014 database consolidation efforts.
19 NetApp AFF8080 EX SQL Performance and Storage Consolidation ® 2015 NetApp, Inc. All Rights Reserved. The AFF8080 EX solution delivers both financial and technical benefits. AFF8080 EX not only provides an attractive investment opportunity but also positions your IT environment for the future by providing the foundation for an agile data infrastructure that includes integrated data protection, nondisruptive
operations, seamless scalability, intelligent data management, and embedded security.
Many of the financial and business advantages of AFF8080 EX derive from the extensive storage-efficiency portfolio available with NetApp storage solutions. NetApp storage-storage-efficiency technologies work together on a single unified architecture, and they can be enabled or disabled to serve any requirement, application, or environment. NetApp leads the way in bringing value to its customers and has built its reputation based on storage efficiency, helping customers achieve what they previously thought impossible, and partnering with customers to get the most value out of their IT environments.
References
The following references are used in this TR: NetApp Realize
www.netapprealize.com
TR-4369: Best Practices Guide for Microsoft SQL Server and SnapManager 7.2 for SQL Server with Clustered Data ONTAP
www.netapp.com/us/system/pdf-reader.aspx?pdfuri=tcm:10-132372-16&m=TR-4369.pdf
SnapManager 7.2 for Microsoft SQL Server Installation and Setup Guide
https://library.netapp.com/ecm/ecm_get_file/ECMP11658051
Version History
Version Date Document Version History
20 NetApp AFF8080 EX SQL Performance and Storage Consolidation ® 2015 NetApp, Inc. All Rights Reserved. Refer to the Interoperability Matrix Tool (IMT) on the NetApp Support site to validate that the exact product and feature versions described in this document are supported for your specific environment. The NetApp IMT defines the product components and versions that can be used to construct
configurations that are supported by NetApp. Specific results depend on each customer's installation in accordance with published specifications.
Copyright Information
Copyright © 1994–2015 NetApp, Inc. All rights reserved. Printed in the U.S. No part of this document covered by copyright may be reproduced in any form or by any means—graphic, electronic, or mechanical, including photocopying, recording, taping, or storage in an electronic retrieval system— without prior written permission of the copyright owner.
Software derived from copyrighted NetApp material is subject to the following license and disclaimer: THIS SOFTWARE IS PROVIDED BY NETAPP "AS IS" AND WITHOUT ANY EXPRESS OR IMPLIED WARRANTIES, INCLUDING, BUT NOT LIMITED TO, THE IMPLIED WARRANTIES OF
MERCHANTABILITY AND FITNESS FOR A PARTICULAR PURPOSE, WHICH ARE HEREBY DISCLAIMED. IN NO EVENT SHALL NETAPP BE LIABLE FOR ANY DIRECT, INDIRECT,
INCIDENTAL, SPECIAL, EXEMPLARY, OR CONSEQUENTIAL DAMAGES (INCLUDING, BUT NOT LIMITED TO, PROCUREMENT OF SUBSTITUTE GOODS OR SERVICES; LOSS OF USE, DATA, OR PROFITS; OR BUSINESS INTERRUPTION) HOWEVER CAUSED AND ON ANY THEORY OF
LIABILITY, WHETHER IN CONTRACT, STRICT LIABILITY, OR TORT (INCLUDING NEGLIGENCE OR OTHERWISE) ARISING IN ANY WAY OUT OF THE USE OF THIS SOFTWARE, EVEN IF ADVISED OF THE POSSIBILITY OF SUCH DAMAGE.
NetApp reserves the right to change any products described herein at any time, and without notice. NetApp assumes no responsibility or liability arising from the use of products described herein, except as expressly agreed to in writing by NetApp. The use or purchase of this product does not convey a license under any patent rights, trademark rights, or any other intellectual property rights of NetApp.
The product described in this manual may be protected by one or more U.S. patents, foreign patents, or pending applications.
RESTRICTED RIGHTS LEGEND: Use, duplication, or disclosure by the government is subject to restrictions as set forth in subparagraph (c)(1)(ii) of the Rights in Technical Data and Computer Software clause at DFARS 252.277-7103 (October 1988) and FAR 52-227-19 (June 1987).
Trademark Information
NetApp, the NetApp logo, Go Further, Faster, ASUP, AutoSupport, Campaign Express, Cloud ONTAP, Clustered Data ONTAP, Customer Fitness, Data ONTAP, DataMotion, Fitness, Flash Accel, Flash Cache, Flash Pool, FlashRay, FlexArray, FlexCache, FlexClone, FlexPod, FlexScale, FlexShare, FlexVol, FPolicy, GetSuccessful, LockVault, Manage ONTAP, Mars, MetroCluster, MultiStore, NetApp Insight, OnCommand, ONTAP, ONTAPI, RAID DP, RAID-TEC, SANtricity, SecureShare, Simplicity, Simulate ONTAP, SnapCenter, Snap Creator, SnapCopy, SnapDrive, SnapIntegrator, SnapLock, SnapManager, SnapMirror, SnapMover, SnapProtect, SnapRestore, Snapshot, SnapValidator, SnapVault, StorageGRID, Tech OnTap, Unbound Cloud, WAFL and other names are trademarks or registered trademarks of NetApp Inc., in the United States and/or other countries. All other brands or products are trademarks or registered trademarks of their respective holders and should be treated as such. A current list of NetApp trademarks is available on the Web at