Department of Health and Human Services
OFFICE OF
INSPECTOR GENERAL
Q
UESTIONABLE
B
ILLING BY
S
KILLED
N
URSING
F
ACILITIES
.
Daniel R. Levinson
Inspector General
December 2010
OEI-02-09-00202
E X E C U T I V E S U M M A R Y
OBJECTIVES
1. To determine the extent to which billing by skilled nursing facilities
(SNF) changed from 2006 to 2008.
2. To determine the extent to which billing varied by type of SNF
ownership in 2008.
3. To identify SNFs that had questionable billing in 2008.
BACKGROUND
The Part A SNF benefit covers skilled nursing care, therapy services, and other services for Medicare beneficiaries. In recent years, the Office of Inspector General (OIG) has identified a number of problems with SNF billing for Medicare Part A payments. Notably, an OIG report found that 26 percent of claims submitted by SNFs were not supported by the medical record, representing over $500 million in potential overpayments. Further, the Medicare Payment Advisory Commission has raised concerns about SNFs’ improperly billing for therapy to obtain additional Medicare payments.
Medicare pays SNFs under a prospective payment system. Under this system, SNFs classify each beneficiary into a group based on his or her care and resource needs. These groups are called resource utilization groups (RUGs), and each RUG has a different Medicare per diem payment rate. Medicare classifies RUGs into eight distinct categories. Two of the categories are for beneficiaries who need therapy. The remaining six categories are for beneficiaries who require very little or no therapy. Medicare payment rates are generally higher for therapy RUGs than for nontherapy RUGs.
In addition, Medicare generally pays more for higher levels of therapy. The SNF categorizes the beneficiary into one of five therapy levels, based primarily on the number of minutes of therapy provided. The beneficiaries who require the highest level of therapy are categorized into ultra high therapy RUGs, which generally have the highest per diem rates.
RUGs are further divided by the amount of assistance a beneficiary needs with certain activities of daily living (ADL), such as eating. If a beneficiary needs high levels of assistance, he or she is categorized into a RUG with high ADL scores, whereas a beneficiary who needs less assistance is categorized into a RUG with low or medium ADL scores.
E X E C U T I V E S U M M A R Y E X E C U T I V E S U M M A R Y
Medicare pays higher rates for RUGs with high ADL scores than for RUGs with lower ADL scores.
We based this study on an analysis of Medicare Part A claims from 2006 and 2008 and on data from the Online Survey, Certification and Reporting system.
FINDINGS
From 2006 to 2008, SNFs increasingly billed for higher paying RUGs, even though beneficiary characteristics remained largely
unchanged. From 2006 to 2008, the percentage of RUGs for ultra high
therapy increased from 17 to 28 percent. The percentage of RUGs with high ADL scores increased from 30 percent in 2006 to
34 percent in 2008. Even though SNFs significantly increased their billing for these higher paying RUGs, beneficiaries’ ages and diagnoses at admission were largely unchanged from 2006 to 2008.
For-profit SNFs were far more likely than nonprofit or government SNFs to bill for higher paying RUGs. In total, 32 percent of RUGs
from for-profit SNFs were for ultra high therapy, compared to
18 percent from nonprofit SNFs and 13 percent from government SNFs. In addition, for-profit SNFs had a higher use of RUGs with high ADL scores than both for-profit and government SNFs. For-profit SNFs also had longer lengths of stay, on average, compared to those of the other types of SNFs. The differences among types of SNF ownership did not appear to be the result of differences in SNFs’ beneficiary populations. Further, for-profit SNFs that were owned by large chains were the most likely to bill for higher paying RUGs.
A number of SNFs had questionable billing in 2008. Some SNFs
billed much more frequently for higher paying RUGs than other SNFs. Some SNFs also had unusually long average lengths of stay compared to those of other SNFs. These billing patterns indicate that certain SNFs may be routinely placing beneficiaries into higher paying RUGs
regardless of the beneficiaries’ care and resource needs or keeping beneficiaries in Part A stays longer than necessary. We identified 348 SNFs that were in the top 1 percent for the use of ultra high therapy, RUGs with high ADL scores, or long average lengths of stay.
E X E C U T I V E S U M M A R Y
RECOMMENDATIONS
Taken together, these findings raise concerns about the potentially inappropriate use of higher paying RUGs, particularly ultra high therapy. The findings also indicate that the current payment system provides incentives to SNFs to bill for ultra high therapy and for high levels of assistance when these levels of care may not be needed. We recognize that the Centers for Medicare & Medicaid Services (CMS) is making several changes to the RUGs in fiscal year 2011. However, more needs to be done to reduce the potentially inappropriate and significant increases in payments for ultra high therapy and other higher paying RUGs. Based on these findings, we recommend that CMS:
Monitor overall payments to SNFs and adjust rates, if necessary.
As CMS makes changes to the number of RUGs, it should vigilantly monitor overall payments to SNFs and adjust RUG rates annually, if necessary, to ensure that the changes do not significantly increase overall payments.
Change the current method for determining how much therapy is needed to ensure appropriate payments. The amount of therapy that
the SNF provides to the beneficiary during the look-back period largely determines the amount that Medicare pays the SNF. CMS should consider several options to ensure that the amount of therapy paid for by Medicare accurately reflects beneficiaries’ needs. CMS should consider requiring each SNF to use the beneficiary’s hospital diagnosis and other information from the hospital stay to better predict the
beneficiary’s therapy needs. In addition, CMS should consider requiring that therapists with no financial relationship to the SNF determine the amount of therapy needed throughout a beneficiary’s stay. CMS should also consider developing guidance that specifies the types of patients for whom each level of therapy, including ultra high therapy, is
appropriate.
Strengthen monitoring of SNFs that are billing for higher paying RUGs. CMS should instruct its contractors to monitor SNFs’ use of
higher paying RUGs using the indicators discussed in this report. CMS should develop thresholds for the indicators and instruct its contractors to conduct additional reviews of SNFs that exceed them. If SNFs from a particular chain frequently exceed the thresholds, then additional reviews should be conducted of the other SNFs in that chain.
E X E C U T I V E S U M M A R Y
Follow up on the SNFs identified as having questionable billing.
In a separate memorandum, we will refer the SNFs that we identified as having questionable billing to CMS for appropriate action.
AGENCY COMMENTS AND OFFICE OF INSPECTOR GENERAL
RESPONSE
CMS concurred with three of the four recommendations. In response to our first recommendation, to monitor overall payments to SNFs, CMS concurred and stated that it would assess the impact of the recent changes on overall SNF payments as data became available and would expect to recalibrate RUG rates in future years, as appropriate. In response to our second recommendation, to change the current method for determining how much therapy is needed, CMS did not concur but stated that it is committed to pursuing additional improvements to the SNF payment system. CMS noted several concerns with relying on information from the beneficiary’s hospital stay to determine the beneficiary’s therapy needs during a SNF stay. In response to our third recommendation, to strengthen monitoring of SNFs, CMS concurred and stated that it would determine whether additional safeguards shall be put in place by the Medicare contractors to target their efforts.
Finally, in response to our fourth recommendation, to follow up on the SNFs identified as having questionable billing, CMS concurred and stated that it would forward the list of SNFs with questionable billing to the appropriate contractors.
While we recognize CMS’s intent to monitor overall payments to SNFs, we remain concerned about adjusting rates in a timely manner. We also recognize that CMS made a number of changes to the SNF payment system in FY 2010 and that these changes should improve the accuracy of payments. However, we remain concerned that the payment system continues to provide incentives to SNFs to bill for more therapy than is needed, and we strongly encourage CMS to pursue the options we recommended to reduce this vulnerability.
T A B L E O F C O N T E N T S
E X E C U T I V E S U M M A R Y . . . i
I N T R O D U C T I O N . . . 1
F I N D I N G S . . . 9
From 2006 to 2008, SNFs increasingly billed for higher paying RUGs, even though beneficiary characteristics remained largely unchanged . . . 9
For-profit SNFs were far more likely than nonprofit or government SNFs to bill for higher paying RUGs . . . 11
A number of SNFs had questionable billing in 2008 . . . 14
R E C O M M E N D A T I O N S . . . 15
Agency Comments and Office of Inspector General Response . . . 17
A P P E N D I X E S . . . 19
A: Centers for Medicare & Medicaid Services Timeframes for Conducting Beneficiary Assessments . . . 19
B: Description of the 53 Resource Utilization Groups . . . 20
C: The Distribution of Beneficiaries’ Ages and Diagnoses . . . 22
D: Use of Ultra High Therapy by Age and Diagnosis . . . 24
E: Use of Ultra High Therapy by Age and Diagnosis, for Each Type of SNF Ownership . . . 25
F: Billing by Nonprofit Skilled Nursing Facilities . . . 26
G: Distribution of Three Billing Measures Among Skilled Nursing Facilities, by Quartile. . . 27
H: Centers for Medicare & Medicaid Services Comments . . . 28
I N T R O D U C T I O N
OBJECTIVES
1. To determine the extent to which billing by skilled nursing facilities
(SNF) changed from 2006 to 2008.
2. To determine the extent to which billing varied by type of SNF
ownership in 2008.
3. To identify SNFs with questionable billing in 2008.
BACKGROUND
In recent years, the Office of Inspector General (OIG) has identified a number of problems with SNF billing for Medicare Part A payments. Notably, an OIG report found that 26 percent of claims submitted by SNFs in fiscal year (FY) 2002 were not supported by the medical record,
representing $542 million in potential overpayments.1 Additionally, OIG
audits of five SNFs found that 20 to 94 percent of sampled claims from 2002 through 2004 were medically unnecessary, were submitted at an
inappropriate payment rate, or were insufficiently documented.2 OIG
estimated that overpayments to these SNFs totaled nearly $2.5 million. Further, the Medicare Payment Advisory Commission (MedPAC) has raised concerns about SNFs’ improperly billing for therapy to obtain additional Medicare payments. Specifically, MedPAC noted that the current system “encourages SNFs to furnish therapy, even when it is of
little or no benefit.”3 In addition, staff at the Centers for Medicare &
Medicaid Services (CMS) noted that some facilities, to increase payments, may be inappropriately overstating a beneficiary’s need for assistance with certain activities of daily living (ADL). Staff also noted that certain SNFs might be keeping beneficiaries in Part A stays longer than necessary.
1 OIG, A Review of Nursing Facility Resource Utilization Groups, OEI-02-02-00830,
February 2006.
2 OIG, Review of Rehabilitation Services at Gulf Health Care, Texas City, Texas,
A-06-03-00078, July 2007; Review of Rehabilitation Services at Skilled Nursing Facilities – Avante at Leesburg, A-06-06-00107, May 2007; Review of Skilled Services at Heartland Health Care Center of Bedford, Texas, A-06-07-00045, April 2008; Review of Skilled Services at Four Seasons Nursing Center of Durant, Oklahoma, A-06-07-00046, May 2008; and Review of Skilled Services at Regent Care Center of Laredo, Texas, A-06-06-00047, August 2006.
3 MedPAC, Report to Congress: Promoting Greater Efficiency in Medicare, June 2007,
ch. 8, p. 192. Accessed at http://www.medpac.gov/chapters/Jun07_Ch08.pdf on May 29, 2009.
I N T R O D U C T I O N
This study is the first of a three-part series that focuses on Medicare Part A payments to SNFs. The other two studies will be based on medical record reviews. One study will determine the extent to which SNF claims meet Medicare requirements. The other will assess the extent to which SNFs meet certain Federal requirements governing the quality of care
provided to beneficiaries.4
Medicare Payments to SNFs
The Part A SNF benefit covers skilled nursing care, rehabilitation services (i.e., physical, occupational, and speech therapy), and other services for up
to 100 days during any spell of illness.5 To qualify, the beneficiary must
need skilled services daily in an inpatient setting and must require the
skills of technical or professional personnel to provide these services.6
SNFs can be for-profit, nonprofit, or government owned. For-profit and nonprofit SNFs can be part of a chain or can be independently owned. Medicare pays SNFs under a prospective payment system. Throughout beneficiaries’ stays, SNFs classify them into groups based on their care and resource needs. These groups are called resource utilization groups (RUGs). SNFs use an assessment known as the Minimum Data Set
(MDS) to classify beneficiaries into RUGs.7 The MDS is a standardized
tool that assesses the beneficiary’s clinical condition, functional status, and expected use of services.
SNFs must conduct assessments for payment purposes on or about the 5th,
14th, 30th, 60th, and 90th days of a Part A stay, as well on certain other
occasions to account for changes in patient care needs.8 Accordingly, if a
beneficiary has a 100-day Part A stay, he or she will have at least five assessments. For each assessment, the beneficiary may be categorized into a different RUG.
4 OIG, Medicare Part A Payments to Skilled Nursing Facilities, OEI-02-09-00200, and
Medicare Requirements for Quality of Care in Skilled Nursing Facilities, OEI-02-09-00201, forthcoming.
5 Social Security Act, § 1812(a)(2)(A), 42 U.S.C. § 1395d(a)(2)(A). 6 42 CFR §§ 409.31(b)(1) and (3) and 409.31(a)(2).
7 The MDS is part of CMS’s Resident Assessment Instrument (RAI). CMS, Revised
Long-Term Care Facility Resident Assessment Instrument User’s Manual Version 2.0
(RAI User’s Manual), Dec. 2002, rev. Dec. 2005, §§ 1.2 and 1.3.
8 42 CFR § 413.343(b) and RAI User’s Manual, § 2.5. CMS requires other comprehensive
resident assessments at certain times as a condition of participation, which may be combined with MDS payment assessments when the timeframes coincide. 42 CFR § 483.20 and RAI User’s Manual, § 2.1.
I N T R O D U C T I O N
The SNF assesses the beneficiary during what is called the look-back period. The length of the look-back period varies depending upon what the
SNF is assessing.9 For example, a 7-day look-back period is used to assess
how much therapy a beneficiary was provided.10 CMS specifies
timeframes for the last day of the look-back period for each type of assessment. For example, CMS states that for a 14-day assessment, the
last day of the look-back period must occur on the 11th through the
14th days of the beneficiary’s stay.
ent.
Under certain circumstances, CMS allows SNFs to extend the last day of
the look-back period. Such extensions are known as grace periods.11 CMS
states that grace periods can be used, for example, to more fully capture
therapy minutes or other treatments.12 However, CMS emphasizes that
grace periods “should be used sparingly” and that SNFs may be subject to
review if they use grace periods routinely.13 SNFs have an incentive to
use a grace period for the 5-day assessment because it allows them to
count more days of therapy, which may result in increased payments.14
See Appendix A for additional information on the look-back periods and grace periods for each type of assessm
Types of RUGs. There are 53 RUGs, and each RUG has a different
Medicare per diem payment rate. Medicare groups the 53 RUGs into
8 distinct categories.15 Two categories—Rehabilitation and Rehabilitation
Plus Extensive Services—are for beneficiaries who need physical therapy, speech therapy, or occupational therapy, typically after recovering from an episode such as a hip fracture or a stroke.
The remaining six categories are for beneficiaries who require very little or no therapy. These categories are Extensive Services, Special Care, Clinically Complex, Reduced Physical Function, Impaired Cognition, and
9 The most frequent look-back period is 7 days, although some are 14 days and others are
30 days. RAI User’s Manual, ch. 3, p. 29.
10 Ibid., p. 185. 11 Ibid., § 2.5. 12 Ibid. 13 Ibid.
14 The highest paying RUGs require that beneficiaries receive at least 5 days of therapy during
the look-back period. For 5-day assessments, the look-back period for therapy may be shorter than 7 days because the SNF cannot include days prior to the date of admission. If a SNF does not use the grace period for the 5-day assessment, the look-back period is up to 5 days long. However, if a SNF uses a grace period, the look-back period is 6 or 7 days long. In contrast, for later assessments, the look-back period for therapy is always 7 days.
I N T R O D U C T I O N I N T R O D U C T I O N
Behavior Problems. In this report, we refer to the RUGs in the two therapy categories as therapy RUGs. We refer to the RUGs in the remaining six categories as nontherapy RUGs. See Appendix B for information about all 53 RUGs.
Medicare payments for therapy RUGs. Medicare payment rates for therapy
RUGs are almost twice as high, on average, as the rates for nontherapy
RUGs.16 In addition, Medicare generally pays more for higher levels of
therapy.
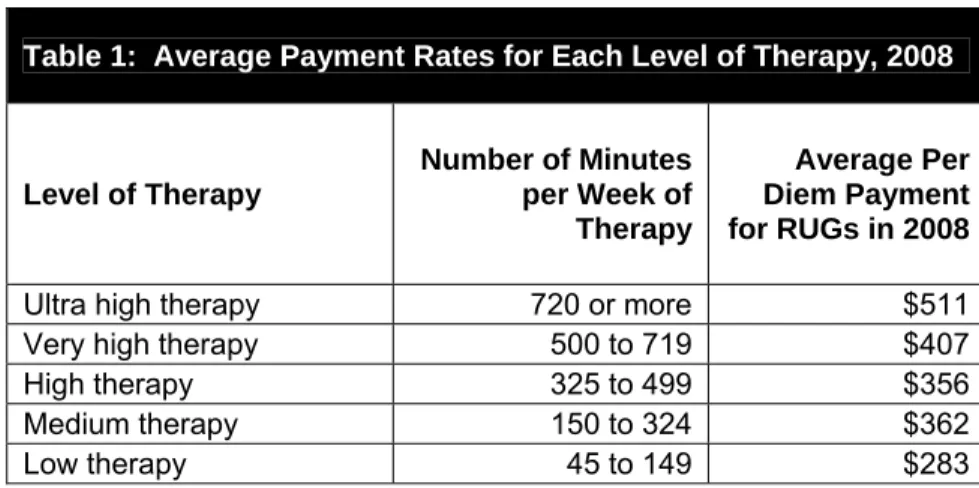
The therapy RUGs are divided into five levels of therapy: ultra high, very high, high, medium, or low. The SNF categorizes the beneficiary into one of the five therapy levels based primarily on the number of minutes of
therapy provided during the look-back period.17 For example, if the
beneficiary received 45 minutes of therapy during the
look-back period, he or she is categorized into a low-therapy RUG, whereas if the beneficiary received 720 minutes, he or she is categorized into an ultra high therapy RUG.
Medicare generally pays the most for ultra high therapy. As shown in Table 1, the average per diem rate for the ultra high therapy RUGs is $511, compared to $283 for low-therapy RUGs.
Table 1: Average Payment Rates for Each Level of Therapy, 2008
Level of Therapy
Number of Minutes per Week of Therapy
Average Per Diem Payment for RUGs in 2008
Ultra high therapy 720 or more $511 Very high therapy 500 to 719 $407 High therapy 325 to 499 $356 Medium therapy 150 to 324 $362 Low therapy 45 to 149 $283
Source: OIG analysis of FY 2008 unadjusted per diem urban rates.
16 OIG analysis of FY 2008 unadjusted per diem urban rates. There is an urban and a rural
payment rate for each RUG. The urban payment rate is lower than the rural rate for the therapy RUGs. See 72 Fed. Reg. 43412, 43418-19 (Aug. 3, 2007).
17 CMS, RAI User’s Manual, § 6.6. In addition to applying the minutes of therapy provided,
SNFs must apply other criteria to categorize a beneficiary into a therapy RUG, such as how often certain nursing services are provided.
I N T R O D U C T I O N
Medicare payments for RUGs by ADL scores. RUGs are further divided by
the amount of assistance a beneficiary needs with certain ADLs.18 As part
of the assessment, SNFs assign each beneficiary an ADL score based on how much assistance he or she needs with certain daily activities, such as eating. If a beneficiary needs high levels of assistance, he or she is
categorized into a RUG with high ADL scores, whereas a beneficiary who needs less assistance is categorized into a RUG with low or medium ADL
scores.19
Medicare pays higher rates for RUGs with high ADL scores than for RUGs with lower ADL scores. On average, the per diem rate for RUGs with high
ADL scores is $36 more than for RUGs with low ADL scores.20
Changes to Medicare payments to SNFs. The prospective payment system
for SNFs has changed in several ways since its inception. Over time, CMS has changed the number of RUGs, as well as the payment rates for RUGs. In FY 2006, CMS increased the number of RUGs from 44 to 53. These changes were intended to be budget neutral and to not affect overall payments to SNFs. However, CMS found that payments to SNFs in FY 2009 were an estimated $780 million more than intended. CMS did not respond to this increase in overall payments until FY 2010, when it decreased rates for certain RUGs.
In FY 2011, CMS will increase the number of RUGs from 53 to 66, and again CMS has stated that it intends these changes to be budget neutral. In addition, CMS will change how SNFs account for therapy that is provided to beneficiaries concurrently and in group settings. SNFs, however, will still base the amount of therapy needed on the amount provided during the look-back period.
Safeguarding Medicare Payments to SNFs
CMS relies on different types of contractors to prevent and reduce fraud, waste, and abuse in SNF billing for Medicare Part A payments. Certain contractors are responsible for processing and paying Part A claims. At their discretion, these contractors may conduct targeted medical reviews
18 The one exception is the Extensive Services category. The RUGs in this category are not
grouped by the amount of assistance a beneficiary needs with daily activities.
19 Each RUG is associated with a range of ADL scores. In addition, each therapy level and
nontherapy category typically includes three types of RUGs: RUGs associated with a range of high ADL scores, medium ADL scores, and low ADL scores. In this report, we refer to these three types as RUGs with high, medium, and low ADL scores.
I N T R O D U C T I O N
of SNF claims to prevent improper payments. Other contractors are responsible for identifying fraud and abuse and for referring cases to law enforcement, when appropriate. Finally, another group of contractors is responsible for identifying and recouping any overpayments made to SNFs.
METHODOLOGY
We based this study on data from two sources: (1) all paid Part A SNF claims from 2006 and 2008; and (2) data from the Online Survey, Certification and Reporting (OSCAR) system. We used these data to determine the extent to which SNF billing changed from 2006 to 2008 and varied by type of SNF ownership in 2008. We also used the data to
identify SNFs with questionable billing in 2008. Analysis of SNF Billing by Year
We identified the universe of paid Part A SNF claim line items for
2006 and 2008 from CMS’s National Claims History File.21 We based our
analysis on the RUGs that SNFs submitted on these claims.22 We
analyzed the RUGs to determine the extent to which SNF billing changed from 2006 to 2008. For each year, we determined the distribution of the RUGs and then compared the 2 years. In addition, we assessed whether the average length of stay changed from 2006 to 2008.
We paid particular attention to changes in higher paying RUGs, which include RUGs for ultra high therapy and RUGs with high ADL scores. We combined the data from the two therapy categories—Rehabilitation and Rehabilitation Plus Extensive Services—to determine how often SNFs billed for each of the different therapy levels: ultra high, very high, high, medium, and low. In addition, we looked at how often SNFs billed for RUGs with high ADL scores within each therapy level and each nontherapy category. We also assessed whether SNFs’ use of grace periods changed from 2006 to 2008.
Next, we determined whether key characteristics of beneficiaries changed between 2006 and 2008. We looked specifically at whether the
distribution of beneficiaries’ ages and admitting diagnoses changed from 2006 to 2008. We also looked at changes in the use of RUGs for ultra high
21 In this report, we refer to claim line items as claims.
22 We based our analysis on the RUG billed by the SNF for each assessment. This RUG may
I N T R O D U C T I O N I N T R O D U C T I O N
therapy and RUGs with high ADL scores for each age group and for each
of the top 20 admitting diagnoses.23
Analysis of Billing by Type of SNF Ownership
We used OSCAR data to determine whether each SNF is for-profit, nonprofit, or government owned. We then assessed whether the
percentage of RUGs for ultra high therapy, the percentage of RUGs with high ADL scores, and the average length of stay varied by type of
ownership.
Next, we determined whether the variation in billing was associated with differences in SNFs’ beneficiary populations. For this analysis, we
assessed whether the distribution of the beneficiaries’ ages and admitting diagnoses varied by type of ownership. We also looked at whether the percentage of RUGs for ultra high therapy, the percentage of RUGs with high ADL scores, and the average length of stay varied by type of
ownership for each age group and for each of the top 20 admitting diagnoses.
isition.
In addition, we compared SNF billing among SNFs owned by large chains, those owned by small chains, and those that are independently owned. We conducted this analysis for for-profit SNFs and for nonprofit SNFs.
We identified the SNFs that were part of a chain using OSCAR data.24
We considered a chain to be large if it owned at least 100 SNFs and small if it owned fewer than 100 SNFs. We also assessed the extent to which billing changed by the SNFs acquired by large chains between 2006 and 2008. For each chain, we compared the billing by the newly acquired SNFs for the 6 months before acquisition to the same SNFs’ billing for the 6 months after acqu
23 We defined the age groups as less than 65 years of age, 65 up to 70 years, 70 up to 75 years,
75 up to 80 years, 80 up to 85 years, 85 up to 90 years, 90 up to 95 years, and 95 years of age or more. The admitting diagnosis on the claim is based on the International Classification of Diseases, Ninth Revision, Clinical Modification (ICD-9), which is the official system for assigning codes to diagnoses and procedures. We used the first three characters of the ICD-9 code to obtain the beneficiary’s admitting diagnosis.
24 The OSCAR data indicate whether a SNF is owned by a multifacility organization, which we
refer to as a chain. Other available data sources were used to determine the dates that SNFs were acquired by chains.
I N T R O D U C T I O N I N T R O D U C T I O N
Identification of SNFs With Questionable Billing
We based this analysis on the 12,286 SNFs that had at least 50 Part A
stays in 2008.25 For each SNF, we determined: (1) the percentage of
RUGs for ultra high therapy, (2) the percentage of RUGs with high ADL scores, and (3) the average length of stay. We considered a SNF to have questionable billing if it was in the top 1 percent for any of the three measures. We also highlighted the SNFs with questionable billing on more than one of these measures.
Lastly, we determined whether these SNFs had beneficiary populations that indicated a need for a particularly high use of higher paying RUGs or for longer lengths of stay. To conduct this analysis, we calculated SNFs’ expected use of these RUGs based on national averages for each age group and admitting diagnosis. If their actual use was at least 50 percent higher than their expected use, we concluded that their questionable billing could not be explained by differences in their beneficiary populations. We did the same analysis for length of stay.
Limitations
This study assesses SNF billing based on an analysis of Medicare Part A claims. It does not, however, determine whether the claims were appropriate. A companion study, based on a medical review, will address this question and determine whether Part A SNF claims met Medicare coverage requirements.
Standards
This study was conducted in accordance with the Quality Standards for
Inspections approved by the Council of the Inspectors General on Integrity and Efficiency.
25 We established a minimum of 50 Part A stays per SNF to ensure the reliability of the
measures. For SNFs with fewer Part A stays, changes in the characteristics of a small number of Part A stays could have a large effect on the measures, making the measures less reliable.
F I N D I N G S
F I N D I N G S
Medicare pays SNFs different rates for different RUGs. Ultra high therapy RUGs generally have the highest reimbursement rates of all the RUGs. RUGs for high levels of assistance with daily activities also have high rates. From 2006 to 2008, SNFs significantly increased their use of both of these types of RUGs. At the same time, the characteristics of the
beneficiaries remained largely unchanged.26
From 2006 to 2008, SNFs increasingly billed for
higher paying RUGs, even though beneficiary
characteristics remained largely unchanged
Billing for ultra high therapy increased substantially from 2006 to 2008 In 2006, 17 percent of all RUGs were for ultra high therapy. In 2008, this share increased to 28 percent. Over the same period, SNFs’ use of the other levels of therapy—very high, high, medium, and low—decreased or stayed about the same. For example, SNFs’ use of high therapy decreased from 16 percent in 2006 to 11 percent in 2008. Similarly, the percentage of RUGs in the nontherapy categories decreased from 16 percent in 2006 to 12 percent in 2008. See Chart 1.
Chart 1: Changes in SNF Billing From 2006 to 2008
Source: OIG analysis of Part A SNF claims, 2010.
26 In addition, there were only slight changes in the total number of Part A stays and the
average length of stay during this time. The total number of stays increased from 2.4 million in 2006 to 2.5 million in 2008, and the average length of stay increased from 27.3 days to 27.6 days.
F I N D I N G S
The shift to ultra high therapy RUGs caused a substantial increase in Part A payments to SNFs. Overall, payments increased by
$4.3 billion, or 18 percent, from 2006 to 2008. As shown in Table 2, payments to SNFs for ultra high therapy rose from $5.7 billion in 2006 to $10.7 billion in 2008, an increase of nearly 90 percent. At the same time, payments for all other levels of therapy decreased by 2 percent and payments for nontherapy RUGs decreased by 19 percent, for a total decrease of nearly three-quarters of a billion dollars.
Table 2: Changes in Medicare Payments From 2006 to 2008
RUGs
Total Medicare Payments 2006
Total Medicare Payments 2008
Difference in Payments
Ultra high therapy RUGs $5.7 billion $10.7 billion $5.04 billion Other therapy RUGs $15.6 billion $15.3 billion -$0.25 billion Nontherapy RUGs $2.5 billion $2.0 billion -$0.46 billion
Total* $23.8 billion $28.1 billion $4.32 billion * Medicare payments in 2008 do not sum to total because of rounding.
Source: OIG analysis of Part A SNF claims, 2010.
The shift to ultra high therapy RUGs was also associated with an increased use of grace periods. SNFs’ use of grace periods increased substantially, from 51 percent in 2006 to 61 percent in 2008 for 5-day assessments. Although CMS guidance states that grace periods should “be used sparingly,” SNFs used grace periods almost universally for ultra high therapy RUGs. In 2008, for 5-day assessments, SNFs used grace periods for 96 percent of ultra high therapy RUGs, compared to 55 percent for other therapy RUGs and 20 percent for nontherapy RUGs. SNFs likely used grace periods for ultra high therapy RUGs because the grace periods allow them to count more days of therapy when determining the RUG. Billing for high levels of assistance with daily activities also increased from 2006 to 2008
SNFs receive higher reimbursement rates for RUGs with high ADL scores than for those with lower ADL scores. In 2006, 30 percent of RUGs had high ADL scores, compared to 34 percent of RUGs in 2008. Within each therapy level, SNFs’ use of RUGs with high ADL scores increased by at
F I N D I N G S
least 3 percentage points. This same increase was seen in all but one of
the nontherapy categories.27
The shift toward higher paying RUGs did not appear to be the result of changes in beneficiary characteristics
Even though SNFs significantly increased their billing for higher paying RUGs, beneficiaries’ ages and diagnoses at admission were largely unchanged from 2006 to 2008. The average age of beneficiaries changed minimally, from 79.9 to 79.8 years of age, and the distribution of
beneficiaries’ ages also did not change significantly during this time. Additionally, the top 20 admitting diagnoses of beneficiaries were identical and accounted for over half of all admissions in both years. The
distribution of the top 20 diagnoses also did not differ substantially.28 See
Appendix C for more detailed information about beneficiaries’ ages and diagnoses in 2006 and 2008.
Moreover, SNFs increased their billing for higher paying RUGs regardless of the beneficiaries’ ages or diagnoses. Specifically, SNFs increased their billing for ultra high therapy from 2006 to 2008 by at least 10 percentage points for each age group and for each of the top 20 admitting diagnoses. See Appendix D for the increase from 2006 to 2008 by age group and diagnosis. Similarly, SNFs increased their billing for RUGs with high ADL scores from 2006 to 2008 by at least 2 percentage points for each age group and for all but 1 of the top 20 admitting diagnoses.
For-profit SNFs were far more likely than
nonprofit or government SNFs
to bill for higher paying RUGs
In 2008, for-profit SNFs accounted for 69 percent of all SNFs while nonprofit and government SNFs accounted for 27 percent and
5 percent, respectively.29 The for-profit SNFs were more likely to bill for
ultra high therapy and for RUGs with high ADL scores than the nonprofit and government SNFs.
27 SNFs’ use of RUGs with high ADL scores in the Impaired Cognition category decreased by
1 percentage point. Also, we excluded the Extensive Services category from this analysis because the RUGs in this category are not grouped by ADL scores.
28 The largest change from 2006 to 2008 was a 5-percentage point increase in the use of the
“Care Involving Use of Rehabilitation Procedures” diagnosis (ICD-9 code V57). Compared to the other top 20 diagnoses, this diagnosis was not associated with a particularly high use of ultra high therapy or RUGs with high ADL scores.
F I N D I N G S
As shown in Chart 2, 32 percent of RUGs from for-profit SNFs were for ultra high therapy, compared to 18 percent from nonprofit SNFs and 13 percent from government SNFs. In addition, 35 percent of all RUGs from for-profit SNFs had high ADL scores, compared to
31 percent of RUGs from nonprofit and from government SNFs.
Chart 2: Billing for Ultra High Therapy and RUGs With High ADL Scores, by Type of SNF Ownership, 2008
Source: OIG analysis of Part A SNF claims, 2010.
For-profit SNFs also had longer lengths of stay, on average, compared to those of the other types of SNFs. The average length of stay in for-profit SNFs was 29 days, compared to 23 days in nonprofit SNFs and 25 days in government SNFs.
The differences among types of ownership did not appear to be the result of differences in SNFs’ beneficiary populations. In fact, key beneficiary characteristics—specifically, the distributions of beneficiaries’ ages, as well as beneficiaries’ diagnoses at admission—were similar across the three types of ownership.
Moreover, for-profit SNFs’ use of ultra high therapy RUGs was higher than nonprofit and government SNFs’ use of these RUGs for each age group and for each of the top 20 admitting diagnoses. See Appendix E for the difference by type of ownership. For-profit SNFs’ use of RUGs with high ADL scores was also higher in each age group and in 16 of the top 20 admitting diagnoses.
F I N D I N G S F I N D I N G S
For-profit SNFs that were owned by large chains were the most likely to bill for higher paying RUGs
Among the 10,303 for-profit SNFs, about 20 percent were owned by 10 large chains, nearly half were owned by smaller chains, and the remaining were independently owned. As shown in Table 3, for-profit SNFs owned by large chains were more likely than other for-profit SNFs to bill for higher paying RUGs. These SNFs were more likely to bill for ultra high therapy and for high ADL scores than other for-profit SNFs. In addition, for-profit SNFs owned by large chains had longer average
lengths of stay than other types of for-profit SNFs.
For-profit SNFs owned by large chains were also much more likely to bill for higher paying RUGs than the three types of nonprofit SNFs. In addition, these for-profit SNFs were more likely to have longer lengths of stay than each type of nonprofit SNF. See Appendix F for more
information about nonprofit SNFs.
Table 3: Billing by For-Profit SNFs, 2008
Independently Owned SNFs
(n = 3,678)
SNFs Owned by Small Chains
(n = 4,579)
SNFs Owned by Large Chains
(n = 2,046) Percentage of RUGs
for ultra high therapy 28% 29% 43%
Percentage of RUGs
with high ADL scores 33% 34% 38%
Average length of stay 28 days 29 days 31 days
Source: OIG analysis of Part A SNF claims, 2010.
It is also worth noting that the billing by the for-profit SNFs purchased by large chains changed soon after the SNFs were acquired. Between
2006 and 2008, nine large for-profit chains acquired a total of 159 SNFs.30
In all nine chains, the percentage of RUGs for ultra high therapy increased in the newly acquired SNFs. Notably, for three chains, the increase was at least 9 percentage points. In eight chains, the percentage of RUGs with high ADL scores also increased, with three chains having an increase of more than 5 percentage points. Finally, in six chains, the
30 The number of SNFs acquired by the large chains ranged from 1 to 67. Note that
F I N D I N G S
average lengths of stay in the newly acquired SNFs increased, with the average increases ranging from 1 to 15 days.
A number of SNFs had questionable
billing in 2008
Some SNFs billed much more frequently for higher paying RUGs than other SNFs. Some SNFs also had unusually long average lengths of stay, compared to those of other SNFs. These billing patterns indicate that certain SNFs may be routinely placing beneficiaries into higher paying RUGs regardless of the beneficiaries’ care and resource needs or keeping beneficiaries in Part A stays longer than necessary. Notably, a number of SNFs used ultra high therapy much more frequently than other SNFs. For three-quarters of SNFs, up to 39 percent of their RUGs were for ultra high therapy. In comparison, for the top
1 percent of SNFs, at least 77 percent of their RUGs were for ultra high therapy. Similarly, for three-quarters of SNFs, up to 43 percent of their RUGs had high ADL scores. In comparison, for the top 1 percent SNFs, at least 76 percent of their RUGs had high ADL scores. Additionally, while the average lengths of stay were up to 34 days for three-quarters of SNFs, the top 1 percent of SNFs had average lengths of stay of at least 48 days. See Appendix G for more information about the distribution of these three measures.
A total of 348 SNFs were in the top 1 percent using at least one of the measures discussed above. None of these SNFs had beneficiary
characteristics that indicated a need for such extensive use of ultra high therapy or RUGs with high ADL scores or longer lengths of stay. The vast majority of these SNFs were for-profit (309 SNFs), and over 50 of these were owned by four for-profit chains. Finally, 19 of the 348 SNFs were in the top 1 percent for 2 measures and 1 was in the top 1 percent for all three measures. Most of these 20 SNFs were in the top 1 percent both for RUGs for ultra high therapy and RUGs with high ADL scores.
R E C O M M E N D A T I O N S
We found that SNFs increasingly billed for higher paying RUGs from 2006 to 2008. Specifically, payments to SNFs for ultra high therapy increased by nearly 90 percent, or $5 billion, from 2006 to 2008. We also found that RUGs for high levels of assistance with daily activities
increased. This shift toward higher paying RUGs did not appear to be the result of changes in beneficiary characteristics, such as age and diagnosis. Additionally, we found that for-profit SNFs, particularly those owned by large chains, were more likely to bill for higher paying RUGs than
nonprofit and government SNFs. Furthermore, we identified a number of SNFs with questionable billing, which indicates that some SNFs may be routinely placing beneficiaries into higher paying RUGs regardless of the beneficiaries’ care and resource needs or keeping beneficiaries in Part A stays longer than necessary.
Taken together, these findings raise concerns about the potentially
inappropriate use of higher paying RUGs, particularly ultra high therapy. The findings also indicate that the current payment system provides incentives to SNFs to bill for ultra high therapy and for high levels of assistance when these levels of care may not be needed. We recognize that CMS is making several changes to the RUGs in FY 2011. However, more needs to be done to reduce the potentially inappropriate and significant increases in payments for ultra high therapy and other higher paying RUGs.
We recommend that CMS:
Monitor overall payments to SNFs and adjust rates, if necessary
CMS will increase the number of RUGs in FY 2011 and intends for this change to remain budget neutral. CMS should vigilantly monitor overall payments to SNFs and adjust RUG rates annually, if necessary, to ensure that the changes do not significantly increase overall payments.
Change the current method for determining how much therapy is needed to ensure appropriate payments
The amount of therapy that the SNF provides to the beneficiary during the look-back period largely determines the amount that Medicare pays the SNF. CMS should consider several options to ensure that the amount of therapy paid for by Medicare accurately reflects beneficiaries’ needs. To more accurately predict these needs, CMS should consider requiring each SNF to use more information about the spell of illness that qualified a beneficiary for the SNF stay. For example, a SNF could use the
R E C O M M E N D A T I O N S R E C O M M E N D A T I O N S
beneficiary’s hospital diagnosis and other information from the hospital stay to better predict the beneficiary’s therapy needs.
CMS should also consider requiring SNFs to independently verify beneficiaries’ therapy needs. For example, therapists with no financial relationship to the SNF could determine the amount of therapy needed throughout a beneficiary’s stay. These changes would limit the ability of SNFs to bill for more therapy than is appropriate.
CMS should also consider developing guidance that specifies the types of patients for whom each level of therapy, including ultra high therapy, is appropriate. This guidance could include various clinical scenarios as well as a list of hospital diagnoses that are appropriate for each level of
therapy. This information would help ensure that appropriate amounts of therapy are provided to beneficiaries and provide Medicare contractors with more concrete guidance to review claims for potential fraud and abuse.
Strengthen monitoring of SNFs that are billing for higher paying RUGs CMS should instruct its contractors to monitor SNFs’ billing for higher paying RUGs using the indicators discussed in this report. Specifically, the contractors should determine for each SNF: (1) the percentage of RUGs for ultra high therapy, (2) the percentage of RUGs with high ADL scores, and (3) the average length of stay. CMS should develop thresholds for each of these measures and instruct contractors to conduct additional reviews of SNFs that exceed them. If SNFs from a particular chain frequently exceed these thresholds, then additional reviews should be conducted of the other SNFs in that chain.
Contractors should use this information to target their efforts to more effectively identify and prevent inappropriate billing. Contractors could conduct medical reviews of a sample of claims from SNFs that exceed these thresholds. Contractors could use their findings to recover
inappropriate payments, to place certain SNFs on prepayment review, and to initiate fraud investigations.
CMS should also establish explicit criteria regarding appropriate use of grace periods and instruct contractors to monitor SNFs’ use of grace periods.
Follow up on the SNFs identified as having questionable billing
In a separate memorandum, we will refer the SNFs that we identified as having questionable billing to CMS for appropriate action.
R E C O M M E N D A T I O N S
AGENCY COMMENTS AND OFFICE OF INSPECTOR GENERAL
RESPONSE
CMS concurred with three of the four recommendations. In general, CMS stated that changes to the SNF prospective payment system initiated in FY 2010 will result in more accurate payments to SNFs. OIG, however, remains concerned that further changes, as we recommended, are necessary to reduce potentially inappropriate SNF payments.
In response to our first recommendation, to monitor overall payments to SNFs, CMS concurred and stated that it would assess the impact of the recent changes on overall SNF payments as data became available and would expect to recalibrate RUG rates in future years, as appropriate. In response to our second recommendation, to change the current method for determining how much therapy is needed, CMS did not concur but stated that it is committed to pursuing additional improvements to the SNF payment system. CMS noted several concerns with relying on
information from the beneficiary’s hospital stay, such as the diagnosis and therapy utilization, to determine the beneficiary’s therapy needs during a SNF stay. It further noted that it has several initiatives designed to consider the utilization of therapy services in different settings. In response to our third recommendation, to strengthen monitoring of SNFs, CMS concurred and stated that it would determine whether additional safeguards, including thresholds, shall be put in place by the Medicare contractors to target their efforts to identify and prevent inappropriate billing. Further, CMS noted that it would share the information with the appropriate Medicare contractors to consider the issues identified in this report when prioritizing their medical review strategies and other interventions.
Finally, in response to our fourth recommendation, to follow up on the SNFs identified as having questionable billing, CMS concurred and stated that it would forward the list of SNFs with questionable billing to the appropriate contractors.
While we recognize CMS’s intent to monitor overall payments to SNFs, we remain concerned about adjusting rates in a timely manner. In FY 2006, when CMS increased the number of RUGs from 44 to 53, CMS intended these changes to be budget neutral. CMS did not respond to significant annual increases in overall payments until FY 2010.
We also recognize that CMS made a number of changes to the SNF payment system in FY 2010 and that these changes should improve the
R E C O M M E N D A T I O N S
accuracy of payments. However, we remain concerned that the payment system continues to provide incentives to SNFs to bill for more therapy than is needed. We understand CMS’s concerns about using hospital data to determine the amount of therapy the beneficiary needs; however, we strongly encourage CMS to pursue other options to reduce this
vulnerability. As we recommended, CMS should also consider: (1) using therapists with no financial relationship to the SNF to determine the amount of therapy needed throughout a beneficiary’s stay; and
(2) developing guidance that specifies the types of patients for whom each level of therapy, including ultra high therapy, is appropriate.
A P P E N D I X ~ A
Centers for Medicare & Medicaid Services Timeframes for Conducting Beneficiary Assessments
Last Day of Look-Back Period (From the Date of Admission)
Assessment
Type Timeframe Grace Period
5-Day Day 1 to 5 Day 6 to 8
14-Day Day 11 to 14 Day 15 to 19
30-Day Day 21 to 29 Day 30 to 34
60-Day Day 50 to 59 Day 60 to 64
90-Day Day 80 to 89 Day 90 to 94
Source: Centers for Medicare & Medicaid Services, Resident Assessment Instrument User’s Manual.
* RUG.
Description of the 53 Resource Utilization Groups* RUG Category RUG Therapy
Level ADL** Scores Per Diem Rate Therapy RUGs
RUX Ultra high High $602
RUL Ultra high Low $529
RVX Very high High $456
RVL Very high Low $426
RHX High High $387 RHL High Low $380
RMX Medium High $443
RML Medium Low $406
Rehabilitation Plus Extensive Services
RLX Low $314
RUC Ultra high High $511
RUB Ultra high Medium $468
RUA Ultra high Low $446
RVC Very high High $411
RVB Very high Medium $390
RVA Very high Low $351
RHC High High $358
RHB High Medium $341
RHA High Low $316
RMC Medium High $328
RMB Medium Medium $320
RMA Medium Low $312
RLB Low High $289
Rehabilitation
RLA Low Low $247
Nontherapy RUGs
SE3 $362
SE2 $308
Extensive Services
SE1 $274
SSC High $270
SSB Medium $255
Special Care
SSA Low $251
CC2 High $268
CC1 High $245
CB2 Medium $233
CB1 Medium $223
CA2 Low $221
Clinically Complex
CA1 Low $207
A P P E N D I X ~ B
A P P E N D I X ~ B
Description of the 53 Resource Utilization Groups (continued) RUG Category RUG Therapy
Level ADL Scores Per Diem Rate Nontherapy RUGs (continued)
PE2 High $214
PE1 High $210
PD2 High $204
PD1 High $201
PC2 Medium $193
PC1 Medium $191
PB2 Low $170
PB1 Low $169
PA2 Low $167
Reduced Physical Function
PA1 Low $163
IB2 High $198
IB1 High $195
IA2 Low $179
Impaired Cognition
IA1 Low $171
BB2 High $196
BB1 High $191
BA2 Low $177
Behavior Problems
BA1 Low $166
Source: Office of Inspector General analysis of fiscal year 2008 per diem rates for RUGs, 2010. Analysis was based on the unadjusted urban rates.
A P P E N D I X ~ C
Table C-1: The Distribution of Beneficiaries’ Ages From 2006 to 2008 Percentage of Part A Stays Beneficiaries’ Ages at
Admission 2006 2008 Percentage-
Point Difference*
Age < 65 8.0% 9.6% 1.6%
65 ≤ Age < 70 7.4% 7.7% 0.3%
70 ≤ Age < 75 10.8% 10.6% -0.2%
75 ≤ Age < 80 17.0% 15.7% -1.3%
80 ≤ Age < 85 22.2% 21.2% -1.0%
85 ≤ Age < 90 20.1% 20.4% 0.4%
90 ≤ Age < 95 11.0% 11.2% 0.2%
Age ≥ 95 3.6% 3.7% 0.1%
Total* 100.0% 100.0%
* Percentages may not sum to 100 percent and may not equal the percentage-point difference because of rounding.
A P P E N D I X ~ C
Table C-2: The Distribution of Beneficiaries’ Diagnoses at Admission From 2006 to 2008 Percentage of Part A Stays Beneficiaries’ Admitting Diagnoses*
2006 2008
Percentage- Point Difference**
Top 20 Diagnoses (International Classification of Diseases, Ninth Revision)
V57 Care involving use of rehabilitation procedures 12.1% 17.0% 4.9
V54 Other orthopedic aftercare 3.7% 4.2% 0.5
486 Pneumonia organism unspecified 4.3% 4.1% -0.2
428 Heart failure 4.4% 3.8% -0.6
780 General symptoms 3.6% 3.8% 0.2
599 Other disorders of urethra and urinary tract 3.1% 3.1% 0.0
820 Fracture of neck or femur 3.4% 2.7% -0.7
496 Chronic airway obstruction not elsewhere classified 2.1% 2.0% -0.1
V58 Encounter for other and unspecified procedures and aftercare 1.9% 1.9% 0.1
728 Disorders of muscle, ligament, and fascia 1.4% 1.9% 0.5
715 Osteoarthrosis and allied disorders 2.1% 1.8% -0.3
401 Essential hypertension 1.7% 1.7% 0.0
438 Late effects of cerebrovascular disease 1.7% 1.6% -0.2
250 Diabetes mellitus 1.8% 1.6% -0.3
436 Acute but ill-defined cerebrovascular disease 1.9% 1.4% -0.5
427 Cardiac dysrhythmias 1.4% 1.4% -0.1
682 Other cellulitis and abscess 1.4% 1.3% -0.1
719 Other and unspecified disorders of joint 1.3% 1.3% 0.0
781 Symptoms involving nervous and musculoskeletal systems 1.1% 1.2% 0.1
799 Other ill-defined and unknown causes of morbidity and mortality 1.3% 1.2% -0.1
All Other Diagnoses 44.2% 41.1% -3.1
Total** 100.0% 100.0%
* The diagnoses are sorted in descending order by the frequency in 2008.
** Percentages may not sum to 100 percent and may not equal the percentage-point difference because of rounding. Source: Office of Inspector General analysis of Part A skilled nursing facility claims, 2010.
A P P E N D I X ~ D
A P P E N D I X ~ F
A P P E N D I X ~ D
A P P E N D I X ~ D
Chart D-1: Use of Ultra High Therapy for Each Age Group, by Year
Source: Office of Inspector General (OIG) analysis of Part A skilled nursing facility (SNF) claims, 2010.
Chart D-2: Use of Ultra High Therapy for Top 20 Admitting Diagnoses, by Year*
* The diagnoses are sorted in descending order by the percentage of resource utilization groups (RUGs) for ultra high therapy in 2008.
A P P E N D I X ~ D
A P P E N D I X ~ E
A P P E N D I X ~ F
A P P E N D I X ~ E
Chart E-1: Use of Ultra High Therapy for Each Age Group, by Type of SNF* Ownership, 2008
* Skilled nursing facility.
Source: Office of Inspector General (OIG) analysis of Part A SNF claims, 2010.
Chart E-2: Use of Ultra High Therapy for Top 20 Admitting Diagnoses, by Type of SNF Ownership, 2008*
* The diagnoses are sorted in descending order by the percentage of resource utilization groups (RUGs) for ultra high therapy in for-profit SNFs.
A P P E N D I X ~ F
Billing by Nonprofit Skilled Nursing Facilities,* 2008
Independently Owned SNFs (N = 2,235)
SNFs Owned by Small Chains (N = 1,552)
SNFs Owned by Large Chains
(N = 179)
Percentage of RUGs**
for ultra high therapy 17% 20% 11%
Percentage of RUGs with high activities of
daily living scores 31% 31% 29%
Average length of stay 23 days 23 days 24 days
* SNF.
** Resource utilization groups.
A P P E N D I X ~ G
Distribution of Three Billing Measures Among Skilled Nursing Facilities, by Quartile*
Measures Q1 Q2 Q3 Q4 Top 1 Percent
Percentage of RUGs** for ultra
high therapy 0 to 6 percent
Greater than 6
percent to 20 percent percent to 39 percent Greater than 20 percent to 94 percentGreater than 39 77 to 94 percent Percentage of
RUGs with high activities of daily living scores
0 to 23 percent percent to 32 percent Greater than 23 percent to 43 percent Greater than 32 percent to 96 percentGreater than 43 76 to 96 percent
Average length of
stay 5 to 24 days
Greater than 24 days to 29 days
Greater than 29 days to 34 days
Greater than 34 days
to 61 days 48 to 61 days
* Q1, Q2, Q3, and Q4 are quartiles. Each quartile includes 25 percent of all skilled nursing facilities (N = 12,286). ** Resource utilization groups.
A P PEN D
x
H
Centers for Medicare & Medicaid Services Comments
/
...
'....
""
(
~
DEPARTMENT OF HEALTH & HUMAN SERVICES Centers for Medicare & Medicaid SelVicss,S'!
AdministratorWashington. DC 20201
DATE:
OCT
2 82010
TO: Daniel R. LevinsonInspector General FROM: Donald M. Berwick, M.D.
Administrator
SUBJECT: Office ofInspector General's Draft Report: "Questionable Billing by Skilled Nursing Facilities" (OEI-02-09-00202)
The Centers for Medicare & Medicaid Services (CMS) appreciates the opportunity to review the Office of Inspector General's (OIG) draft report entitled "Questionable Billing by Skilled Nursing Facilities."
The objectives of the review were to: 1) determine the extent to which billing by skilled nursing facilities (SNFs) changed from 2006 to 2008; 2) determine the extent to which billing varied by type ofSNF ownership in 2008; and 3) identify SNFs that had questionable billing in 2008. The DIG found that from 2006 to 2008, SNFs increasingly billed for higher paying Resource Utilization Groups (RUGs) and that for-profit SNFs were far more likely than nonprofit or government SNFs to bill for higher paying RUGs. In addition, the DIG found a number of instances of questionable billing in 2008.
Like the DIG, CMS has been concerned with the increasing utilization of the highest paying RUGs. In the fiscal year (FY) 2010 SNF Prospective Payment System (PPS) final rule, CMS made several changes to address these concerns.
• CMS recalibrated the nursing case-mix indexes by making a downward adjustment which resulted in a $1;05 billion decrease in aggregate payments for FY 2010.
• CMS finalized the Resource Utilization Group Version 4 (RUG-IV) classification system, which provides comprehensive changes to the SNF PPS.
• CMS finalized the Minimum Data Set Version 3.0 CMDS 3.0) assessment instrument. The CMS believes that the recent changes to the MDS 3.0 coding requirements and
implementation ofthe RUG-IV classification system will result in more accurate SNF payment, including reallocation ofpayrnents from therapy to medically complex conditions. We believe implementation of the RUG-IV classi.fication system will improve payment accuracy, incentivize access to care for the sickest patients, and significantly reduce program vulnerabilities. CMS
A C K N O W L E D G M E N T S
This report was prepared under the direction of Jodi Nudelman, Regional Inspector General for Evaluation and Inspections in the New York
regional office, and Meridith Seife, Deputy Regional Inspector General. Judy Bartlett and Judy Kellis served as the team leaders for this study. Other principal Office of Evaluation and Inspections staff from the New York regional office who contributed to the report include
Christine Moundas and Rachel Siman; central office staff who contributed include Kevin Farber and Sandy Khoury.
Office of Inspector General
http://oig.hhs.gov
The mission of the Office of Inspector General (OIG), as mandated by Public Law 95-452, as amended, is to protect the integrity of the Department of Health and Human Services (HHS) programs, as well as the health and welfare of beneficiaries served by those programs. This statutory mission is carried out through a nationwide network of audits, investigations, and inspections conducted by the following operating components:
Office of Audit Services
The Office of Audit Services (OAS) provides auditing services for HHS, either by conducting audits with its own audit resources or by overseeing audit work done by others. Audits examine the performance of HHS programs and/or its grantees and contractors in carrying out their respective responsibilities and are intended to provide independent assessments of HHS programs and operations. These assessments help reduce waste, abuse, and
mismanagement and promote economy and efficiency throughout HHS.
Office of Evaluation and Inspections
The Office of Evaluation and Inspections (OEI) conducts national evaluations to provide HHS, Congress, and the public with timely, useful, and reliable information on significant issues. These evaluations focus on preventing fraud, waste, or abuse and promoting economy, efficiency, and effectiveness of departmental programs. To promote impact, OEI reports also present practical recommendations for improving program operations.
Office of Investigations
The Office of Investigations (OI) conducts criminal, civil, and administrative investigations of fraud and misconduct related to HHS programs, operations, and beneficiaries. With investigators working in all 50 States and the District of Columbia, OI utilizes its resources by actively coordinating with the Department of Justice and other Federal, State, and local law enforcement authorities. The investigative efforts of OI often lead to criminal
convictions, administrative sanctions, and/or civil monetary penalties.
Office of Counsel to the Inspector General
The Office of Counsel to the Inspector General (OCIG) provides general legal services to OIG, rendering advice and opinions on HHS programs and operations and providing all legal support for OIG’s internal operations. OCIG represents OIG in all civil and
administrative fraud and abuse cases involving HHS programs, including False Claims Act, program exclusion, and civil monetary penalty cases. In connection with these cases, OCIG also negotiates and monitors corporate integrity agreements. OCIG renders advisory opinions, issues compliance program guidance, publishes fraud alerts, and provides other guidance to the health care industry concerning the anti-kickback statute and other OIG enforcement authorities.