HOW MENTAL ILLNESS
LOSES OUT IN THE NHS
a report by
The Centre for Economic Performance’s
Mental Health Policy Group
The papers prepared for our meetings can be found at http://cep.lse.ac.uk/_new/research/mentalhealth/default.asp.
See especially the paper by Parsonage and Naylor.
CONTENTS
Summary
1
Introduction
5
The scale and severity of illness
6
The costs of mental illness to the NHS
10
The wider costs of mental illness
11
Cost-effective treatments
13
Under-treatment
15
Recommendations
17
Annex A: Members of the CEP Mental Health Policy Group 21
Annex B: Prevalence of adult mental health conditions and % in treatment 22
Annex C: Sources of tables and figures 23
End-notes 24
Figure 1: Morbidity among people under age 65
Physical illness (e.g. heart, lung, musculo-skeletal, diabetes)
Mental illness (mainly depression, anxiety disorders, and child disorders)
SUMMARY
There is one massive inequality within the NHS: the way it treats mental illness as compared with physical illness. Here are six remarkable facts.
Among people under 65, nearly half of all ill health is mental illness (see Figure 1).
In other words, nearly as much ill health is mental illness as all physical illnesses put together.
Mental illness is generally more debilitating than most chronic physical conditions. On average, a person with depression is at least 50% more disabled than someone with angina, arthritis, asthma or diabetes. Mental pain is as real as physical pain, and it is often more severe.
Yet only a quarter of all those with mental illness are in treatment, compared with the vast majority of those with physical conditions. It is a real scandal that we have 6,000,000 people with depression or crippling anxiety conditions and 700,000 children with problem behaviours, anxiety or depression. Yet three quarters of each group get no treatment. One main reason is clear: NHS commissioners have failed to commission properly the mental health services that NICE recommend. The purpose of this paper is to mend this injustice, by pressing for quite new priorities in commissioning. This might seem the worst possible moment to do this, but that is wrong for the following reason.
More expenditure on the most common mental disorders would almost certainly cost the NHS nothing. For mental illness often increases the scale of physical illness. It can make existing physical illness worse. And it can also cause physical symptoms which cannot be medically explained at all: a half of all NHS patients referred for first consultant appointments in the acute sector have “medically unexplained symptoms”. Altogether the extra physical healthcare caused by mental illness now costs the NHS at least £10 billion. Much of this money would be better spent on psychological therapies for those people who have mental health problems on top of their physical symptoms. When people with physical symptoms receive psychological therapy, the average improvement in physical symptoms is so great that the resulting savings on NHS physical care outweigh the cost of the psychological therapy. So while doing the right thing on mental illness, the NHS costs itself nothing. This applies much less to most other NHS expenditures.
This is mainly because the costs of psychological therapy are low and recovery rates are high. A half of all patients with anxiety conditions will recover, mostly permanently, after ten sessions of treatment on average. And a half of those with depression will recover, with a much diminished risk of relapse. Doctors normally measure the effectiveness of a treatment by the number of people who have to be treated in order to achieve one successful outcome. For depression and anxiety the Number Needed to Treat is under 3. In the government’s Improving Access to Psychological Therapies programme,
1
3
5 2
outcomes are measured more carefully than in most of the NHS, and success rates are much higher than with very many physical conditions.
Effective mental health treatment can also generate other large savings to the government, for example by increasing employment or improving the behaviour of children. As one example, the Improving Access to Psychological Therapies programme has almost certainly paid for itself through reduced disability benefits and extra tax receipts. Likewise, when children are treated for conduct disorder, the costs are almost certainly repaid in full through savings in criminal justice, education and social services.
To conclude, mental illness accounts for a massive share of the total burden of disease. Even when we include the burden of premature death mental illness accounts for 23% of the total burden of disease. Yet, despite the existence of cost-effective treatments, it receives only 13% of NHS health expenditure. The under-treatment of people with crippling mental illnesses is the most glaring case of health inequality in our country.
Recommendations
At least six major steps are needed.
The government’s announced mental health policies should be implemented on the ground. For example, local Commissioners have been given £400 million in their baseline budgets for 2011-14 in order to complete the national roll-out of Improving Access to Psychological Therapies (IAPT). By 2014 this programme should be treating 900,000 people suffering from depression and anxiety, with 50% recovering. But many local commissioners are not using their budgets for the intended purpose.
Though included in government documents, such as No health without mental health, the obligation to complete the IAPT roll-out is not included in the NHS Outcomes Framework for 2012/13 which is the crucial document for commissioners. If the government means what it says, IAPT targets should be reflected in the NHS Outcomes Framework.
After 2014 the IAPT programme needs a further phase when it is expanded to cover people suffering from long-term conditions and medically unexplained symptoms.
The Children and Young Person’s IAPT will also need to continue till 2017.
For all this to happen, the Commissioning Board will need to nurture IAPT and make it one of its priority projects, as will Health Education, England.
The training of GPs will also need to change and include a rotation in an IAPT or CAMHS service.
6 5
And recruitment to psychiatry should be increased, if we are to handle properly the more complex cases of mental illness.
The need for a rethink is urgent. At present mental health care is, if anything, being cut. It should be expanded. This is a matter of fairness, to remedy a gross inequality, and it is a matter of simple economics – the net cost to the NHS would be very small. When everyone praises early intervention, it is particularly shocking that the sharpest cuts today are those affecting children.
The NHS aims to save £20 billion on existing activities in order to finance new activities required by new needs, old unmet needs, and new technology. Nowhere is the case for extra spending more strong. In mental health there is massive unmet need and there are new treatments which are only beginning to be rolled out. We appeal to commissioners to think again.
INTRODUCTION
NHS commissioners have a weighty responsibility – to spend over £80 billion of our money in the best possible way. It is certainly not easy. There are massive needs for physical healthcare as well as mental healthcare. In preparing this report over the period of a year, we have tried to allow for both types of need. Throughout our report we have tried to work in a dispassionate way and it is only in our Summary that we have allowed ourselves to vent our passion.
The issue which we have set ourselves is this: Does the NHS give sufficient priority to mental health? To think about this, we have reviewed the following key issues:
the scale and severity of mental illness the costs of mental illness to the NHS
the wider costs of mental illness to the government and to society what treatments exist and how successful and cost-effective they are the extent to which treatments are available in the NHS, and
the policy implications of our conclusions.
A major theme of our report will be the impact of mental illness on physical illness and the need to reflect this in NHS healthcare arrangements.
Terminology in mental health is contentious and not used consistently. In this report we use the term ‘mental illness’ to include clinical depression and anxiety conditions, both of which are highly common and often highly disabling, as well as schizophrenia and bipolar disorder, which are less common. For children, we also include conduct disorder. We use the term ‘illness’ deliberately in order to emphasise that conditions such as these should be taken as seriously as physical illnesses.
The report does not cover dementia or drug and alcohol misuse1 - both of which are vitally important issues in their own right. Though some of the figures and statistics we present do include these conditions, we attempt in each case to be clear what is and what is not included.
THE SCALE AND SEVERITY OF ILLNESS
Prevalence
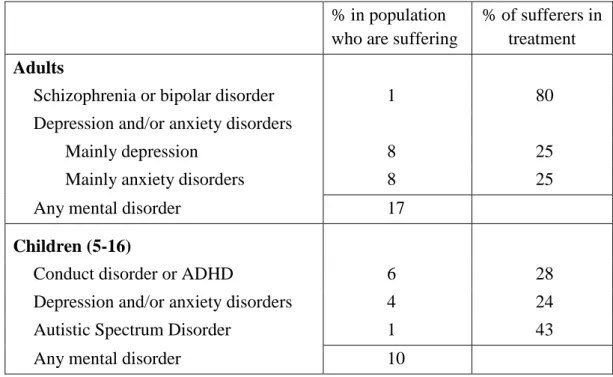
Even with our narrow coverage at least one third of all families (including parents and their children) include someone who is currently mentally ill.2 If we focus on individual adults, the figure is 17%, and for children it is 10% (see Table 1).
This compares with over a third of adults suffering from long-term physical conditions such as cardiovascular disease (including blood pressure), respiratory disease, musculo-skeletal problems or diabetes.3 But there is of course a substantial overlap between physical and mental illness, so that about a third of people with physical illness would also be diagnosed with mental illness.
Morbidity
So much for numbers of people. But, to look at the “burden of morbidity” which these numbers give rise to, we have to weight them by the severity of the illness – the reduced quality of life which it causes. The WHO get these weights from panels of clinicians.4 The weights take into account a variety of studies, such as that quoted earlier which showed that the degree of disability imposed by depression is 50% higher than that for angina, asthma, arthritis or diabetes.5 So let us see what happens when these weights are used in order to estimate the overall burden of “morbidity” imposed by each disease on people of all ages.
As Table 2 shows, mental illness accounts for nearly 40% of morbidity, compared with for example 2% due to diabetes.6These are extraordinarily important figures and it is difficult to suppose that commissioners would not behave differently if they were aware of them.
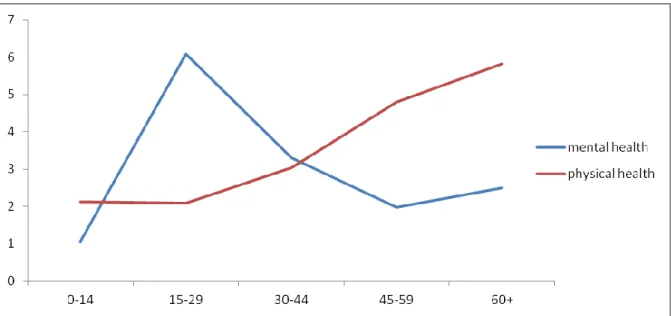
From an economic point of view, it is particularly interesting to focus on morbidity among people of working age, since this has such an impact on the economy and thus on the public finances. Figure 2 shows morbidity at different ages. The units on the vertical axis measure ill-health by the average % reduction in the quality of life, spread over the whole population of each age group.7 As the graph shows, morbidity from physical illness rises steadily throughout life, whereas mental illness especially affects people aged 15-44. Taking together all ages up to 65, mental illness accounts for nearly as much morbidity as all physical illnesses put together.8It is by far the most important illness for people of working age.
Table 1: Percentage suffering from mental illness (England) 9
% in population who are suffering
% of sufferers in treatment
Adults
Schizophrenia or bipolar disorder 1 80
Depression and/or anxiety disorders
Mainly depression 8 25
Mainly anxiety disorders 8 25
Any mental disorder 17
Children (5-16)
Conduct disorder or ADHD 6 28
Depression and/or anxiety disorders 4 24
Autistic Spectrum Disorder 1 43
Any mental disorder 10
Table 2: The burden of disease (UK)
% of morbidity due to each condition
% of overall burden of disease (including premature
death) due to each condition
Mental illness10 38 23
Cardiovascular diseases 6 16
Cancer 3 16
Respiratory diseases 11 8
Sense organ diseases 13 7
Digestive diseases 4 5
Musculoskeletal diseases 7 4
Accidents 3 4
Diabetes 2 2
Other 13 15
Figure 2: Rates of morbidity in each age group (Equivalent life-years lost per 100 people)
This finding is consistent with many other key facts. For example, among people in work, mental illness accounts for nearly a half of all absenteeism.11 And among people out of work, mental illness again accounts for nearly half of all people on incapacity benefits.12
The official figure here is 44% but many of those with inexplicable back pain, chest pain, abdominal pain and headache are also there because of mental illness.
Suffering
Another way of looking at the impact of mental illness is to ask, What proportion of suffering in the community is due to mental as opposed to physical illness? We can define those who are suffering as those who are least satisfied with their lives. We can then ask how far different factors explain whether a person falls into this category. We measure physical health by the number of physical problems a person reports at present. And, to avoid charges of tautology, we measure mental health by a person’s GHQ score six years earlier. Even so, we find that mental illness accounts for more suffering (as we have measured it) than physical illness does. (Table 3 overleaf.)
It is also striking that each type of illness explains more of the misery in our society than lack of income does. So we need a much wider concept of deprivation than is usually used in public debate. A person is deprived not only if he lacks income but if he lacks the other means to enjoy his life. And the biggest single source of deprivation is lack of mental health.
Mortality
However, healthcare is not only about the reduction of suffering: it is also about the preservation of life. The overall burden of disease includes not only suffering, but also
Table 3: Factors explaining low life satisfaction (adults. UK)
Partial correlation coefficients
Number of physical diseases today .15
Mental health 6 years earlier .23
Household income (log) -.05
Controls
N 52,000
premature death (measured as death before 80). Most premature death is due to physical illness. So the share of physical illness is larger in the overall burden of disease (including premature death) than in the burden of morbidity. Even so, mental illness still accounts for
nearly a quarter of the total burden of disease (see Table 2).
Moreover this does not reflect at all the indirect impact of mental illness on mortality.
Mental illness has the same effect on life-expectancy as smoking, and more than obesity.
Thus age-specific death rates for people with depression exceed those of other people by a factor of 1.52 – about the same as the impact of smoking and much higher than obesity.13
This occurs partly through effects on suicide and fatal accidents, and partly because mentally ill people smoke more. But it largely comes about through the way in which mental illness intensifies the effects of physical illness by, for example, intensifying inflammation and the production of stress hormones like cortisol, and by undermining the immune system.14 Thus, if we consider patients with cardiovascular disease of given severity, the rates of hospitalisation and death for those with mental health problems are up to three times higher than for others.15 Similar results are found for asthma, diabetes and COPD.
THE COSTS OF MENTAL ILLNESS TO THE NHS
We can now compare the share of mental health in the burden of disease (23%) with its present share in NHSexpenditure (13%). As Table 4 shows, total expenditure on healthcare for mental illness amounts to some £14 billion a year.
As can be seen, the largest expenditure is on people with schizophrenia, bipolar disorder and personality disorder (the majority of the latter are in forensic care). The next big expenditure is on elderly patients, mainly with dementia – who also attract large social care expenditure from local authorities. Drug and alcohol services also cost over £1 billion. The 700,000 children with mental disorders get only £0.8 billion spent on CAMHS, while for the 6,000,000 adults with depression and anxiety disorders the main discrete service is Improving Access to Psychological Therapies, costing roughly £0.2 billion in 2010/11.16 Support from GPs costs some £1.9 billion.17
Table 4: NHS mental health expenditure (England, 2010/11)
£ billion
Secondary and tertiary care
Working-age adults (mainly schizophrenia, bipolar and personality disorder)
5.6
Elderly 1.8
Children 0.8
Substance misuse 1.1
Other (incl. organic mental disorders) 1.6
10.9
Primary care
GP consultations 1.9 Prescriptions 1.2
3.1 Total 14.0
Costs in physical healthcare
However these costs give a very incomplete account of the costs which mental illness imposes on the NHS. Nearly a third of all people with long-term physical conditions have a co-morbid mental health problem like depression or anxiety disorders.18These mental health conditions raise the costs of physical health-care by at least 45% for a wide range of conditions including cardio-vascular disease, diabetes and COPD at each level of severity, costing at least £8 billion a year.
Moreover, a half of all patients referred for first consultant appointments in the acute sector have medically unexplained symptoms,19such as back pain, chest pain and headache.
These patients cost the NHS some £3 billion a year,20 and many of them should be treated for mental health problems. So, if we add in the £8 billion or more above, untreated mental illness is costing the NHS over £10 billion in physical healthcare costs.
THE WIDER COSTS OF MENTAL ILLNESS
An obvious question is ‘Could these costs be reduced by more and better treatment of mental illness?’ But, before answering this question, we should also consider the wider costs of mental illness. The most obvious cost is the loss of output resulting from people being unable to work – or to work to their full capacity. Mentally ill people are less likely to be in work than others, and, were it not so, total national employment would be 4% higher than it actually is.21 Similarly those who are in work are more likely to have days off – and, were this not so, hours worked in the economy would be 1% higher. On top of that is presenteeism: the fact that people who are ill have lower productivity as a result of their illness. Taking all these phenomena into account, the Centre for Mental Health estimates that mental illness reduces GDP by 4.1% or £52 billion a year.
From a policy point of view a more important figure is the cost of mental illness to the Exchequer. If we focus on non-employment, this costs the Exchequer £8 billion in benefits for the 1.3 million people on incapacity benefits. And the total non-NHS cost of adult mental illness to the Exchequer may be around £28 billion.22
In some ways child mental illness is even more disastrous. Some 50% of mentally ill adults were mentally ill before the age of 15.23 And 30% of all crime (costing society some £20 billion a year) is committed by people who had a clinically diagnosable conduct disorder in childhood or adolescence.24 In terms of cost to the government a child with conduct disorder at 10 subsequently costs the government roughly £100,000 more than other children.25 And none of these estimates includes the devastating cost of mental illness to the families affected.
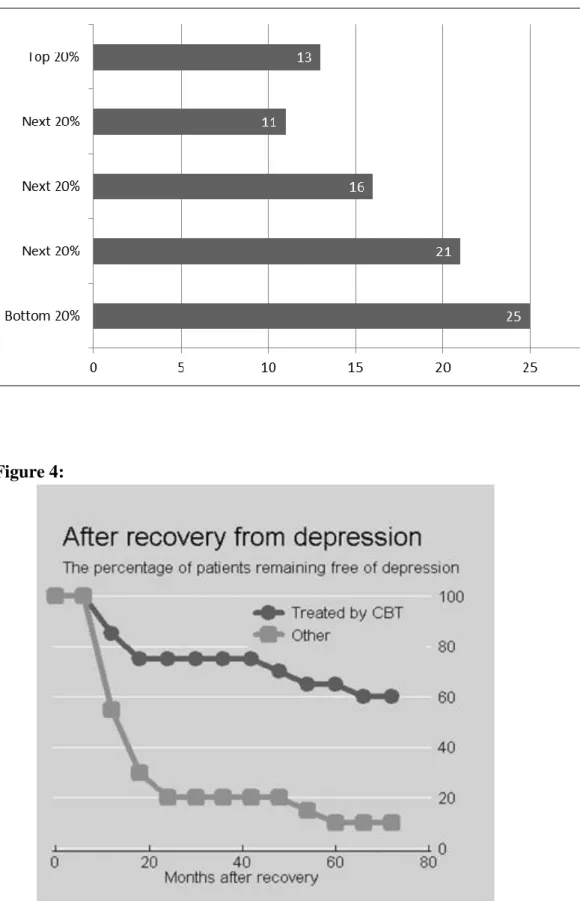
There is another important issue: the social gradient of mental illness. As Figure 3 shows, rates of depression, anxiety and psychosis combined are much higher in the lower quintiles of incomes. Reducing health inequalities is now a duty on the government and it clearly requires a much more vigorous approach to mental illness.
Figure 3: Rates of mental illness by income group (%)
COST-EFFECTIVE TREATMENTS
All of this means that mental illness is a major problem. But is there a solution? Until the 1950s there was relatively little that could be done - mainly tender loving care. Then in the 1950s anti-depressants and anti-psychotic drugs came on the scene. But it was not until the 1970s that psychological therapies of known effectiveness were developed which have now been tested in hundreds of controlled trials. The most studied therapy is Cognitive Behavioural Therapy (CBT) and NICE also recommends some others. For depression and anxiety disorders, the typical short-term success rate for CBT is about 50%: 26 the Number Needed to Treat is under 3.27
Thus unlike most long-term physical conditions, much mental illness is curable.28 The situation is slightly different for anxiety conditions and depression. Roughly half of all mental illness consists of anxiety conditions (like social phobia, health anxiety, PTSD, OCD, panic disorder or generalised anxiety). If untreated, these conditions are frequently lifelong. But after an average of 10 sessions of CBT costing £750, a half of all patients will recover, in most cases for life. With depression, one half recover with CBT within 4 months, and their likelihood of relapse is significantly reduced (but not eliminated) (see Figure 4). The short-run success rate with CBT is similar to that of drugs but the effects are more long-lasting. These 50% recovery rates are those expected from a mature service and are now being approached in IAPT, where recovery rates have reached 43%, despite much of the work still being done by trainees or newly-trained staff.
Such recovery rates are sufficient to ensure that the Exchequer costs of IAPT are more than recovered through savings to DWP and HMRC in reduced benefits and additional taxes, as more people work.29 More important to the NHS are savings within the NHS due to reduced costs of health-care. The most rigorous evidence here is a meta-analysis of 28 randomised controlled trials in the US which compared the physical health-care costs for patients given a psychological intervention with patients who were not. In 26 of the 28 trials which recorded the cost of the treatment, this cost was more than offset by the resulting savings in physical healthcare costs.30 A number of subsequent studies around the world have found similar results.
In the case of people with long-term physical conditions, the psychological therapy has to be tailored to the specifics of the patient’s physical condition and provided in close conjunction with GPs or acute specialist services. We have some impressive research evidence in the UK for COPD, angina, and arthritis in all of which the cost of the psychological therapy was more than offset by the resulting savings to the NHS on physical care.31
To summarise, treatments for the “common mental disorders” of depression and anxiety can be self-financing within the NHS. By spending more, we save even more. This is
different from much of NHS expenditure. At the same time we relieve one of the main sources of suffering in our community.
Similar arguments apply to treatments for children. For example, where children have conduct disorder, parent training costing £1,200 per family is estimated to save the NHS an equal amount of money, and with some delay to save another £1,600 of taxpayers’ money (in present value terms) due to reduced costs to the criminal justice system.32
Comparison with physical treatments
It is interesting to compare the cost-effectiveness of mental health treatments with physical illness. This can only be done through taking particular examples for which data were readily available from the National Institute for Health and Clinical Excellence (NICE). These are given in Table 5.
The first point which emerges is the high clinical effectiveness of many mental health treatments. This is indicated by the Numbers Needed to Treat in order to achieve one successful outcome. The second point is the level of cost-effectiveness as measured by cost per QALY. This involves two further factors. First there is the severity of the condition which is averted, and second the cost per case treated. The concept of severity used by NICE is that each medical condition involves a reduction in the quality of life, and a successful treatment thus increases the number of Quality Adjusted Life Years (QALYs). The cost per QALY is then the (inverse) measure of the cost-effectiveness of the treatment. The informal cut-off
Table 5: Cost-effectiveness of some treatments for mental and physical illnesses
Treatment Numbers Needed to Treat Cost per additional QALY Mental illness
Depression CBT v Placebo 2 £6,700
Social anxiety disorder CBT v Treatment As Usual (TAU) 2 £9,600 Post-natal depression Interpersonal therapy v TAU 5 £4,500 Obsessive-Compulsive
Disorder
CBT v TAU 3 £21,000
Physical illness
Diabetes Metformin v Insulin 14 £6,000
Asthma Beta-agonists + Steroids v Steroids 73 £11,600
COPD Ditto 17 £41,700
Cardio-vascular Statins v Placebo 95 £14,000
Epilepsy Topirimate v Placebo 3 £900
used by NICE is to recommend any treatment where the cost per QALY is below £30,000. Thus many mental health treatments come through with flying colours.
UNDER-TREATMENT
When such effective treatments exist, it is shocking that they are not more widely available. We can begin with the position revealed by the 2007 Psychiatric Morbidity Survey. We can then look at policy improvements since then, whose final outcome remains in the balance.
The Psychiatric Morbidity Survey findings
According to the 2007 survey, which covered a random sample of households, only 24% of people with depression and anxiety disorders were in any form of treatment.33 Of these 14% simply got medication and only the remaining 10% got any form of counselling or therapy. Only 2% were getting CBT which is the main NICE-recommended therapy. In the past year only 3% had seen a psychiatrist and 2% a psychologist. And a survey of waiting times showed that two-thirds of those treated for depression and anxiety in 2009 had waited over 6 months – while median waiting times for physical treatment were under 3 weeks.34
IAPT in the balance
It was this situation which prompted our Depression Report in 200635 and in 2008 the government launched the Improving Access to Psychological Therapies (IAPT) programme. This is a six-year expansion programme, fully-funded in the Spending Reviews and designed by 2014 to provide NICE-recommended therapy each year to 15% of those suffering from depression or anxiety disorders – a modest target. The target recovery rate was set at 50%.
For the first three years the programme went extremely well with an effective training programme and recovery rates of over 40%, which is good considering the numbers of trainees involved. To treat 900,000 people a year by 2014 will require some 8,000 therapists, of whom some 6,000 will have needed to be trained for the first time in NICE-recommended therapies. For people already experienced in mental health work, a one-year training programme was considered sufficient. In the first three years, 3,600 therapists were trained, leaving a planned 800 a year for 2011/12 and each succeeding year. However the number trained in 2011/12 was only 525, with almost no trainees at all in two major regions of the country.
In parallel with the training programme goes a programme of service development whereby trainees continue to be employed once trained, so that the trained workforce does
indeed build-up to the desired level. But in 2011/12 a number of PCTs have cut their IAPT services to well below their level in the previous year – at a time when all services need to be still expanding. And, equally, many PCTs are now threatening not to continue employing in 2012/13 all those trained in the previous year.
Thus many regions and PCTs are not using the money provided through the Spending Review for the intended purpose. At present there can be no certainty that Ministerial commitments to the full roll-out of IAPT by 2014 will be delivered – including the aim that by then some 400,000 people a year should recover from depression or anxiety disorders. This cannot be what is intended in the financial restructuring of the NHS. The NHS cuts are not meant to be cuts all round. They are meant to induce extra efficiency in some existing services in order to provide extra resources where they are urgently needed. It is essential that IAPT continues to grow as planned.36
Child mental health being cut
It is also essential that child mental health services expand their delivery of evidence-based therapy. In the 2004 survey of child mental health the degree of under-treatment was very similar to that for adults in 2007. Only 25% of mentally ill children were in treatment37, and by early 2010 there was no sign of improvement. At that time the Chairman of the Royal College of General Practitioners conducted an ad hoc survey of his members which yielded striking, impressionistic results.38 GPs were asked
When adults are suffering from depression or anxiety disorders requiring specialist psychological therapy e.g. cognitive behavioural therapy (not just counselling), are you able to get them this treatment within two months?
When children are suffering from emotional or conduct problems requiring specialist psychological therapy (not just counselling), are you able to get them this treatment within two months?
Only 15% of GPs said they could usually get the adult service needed and 65% said they could rarely get it. For children the results were even worse, with only 6% usually able to get the service and 78% rarely able to.
So in 2011 the government launched the Children and Young People’s IAPT programme. Unlike for adults, this was not intended to provide a new service, but to upgrade the existing CAMHS so that it provided more evidence-based treatment and achieved better outcomes for more children.39 Against this background it is deeply disturbing that children’s mental health services are now being cut in so many areas.
The NHS Outcomes Framework
In some ways these problems reflect ambiguous signals from the central NHS management. For example the 60 outcomes set out for PCTs in the NHS Outcomes Framework for 2012/13 include no health outcomes relating specifically to the 6,000,000 adults with depression or anxiety, nor to the 700,000 children with mental health problems. But the main responsibility lies with the local commissioners. They know the government’s policies on IAPT and, with the money in their baseline, they should implement the policies.
However what actually happens mainly reflects perceptions. Until local commissioners have a different vision of the importance of mental illness, people who experience it will continue to get a raw deal. So here is our vision of an NHS in which mental illness is given the priority it deserves.
RECOMMENDATIONS
Priorities
Priorities for the NHS would be based on an assessment of the disease-burden and of what cost-effective treatments were available to reduce it. While political pressures inevitably play their role, priorities should be based less on who shouts loudest than on who suffers most and what can be done about it. The overall NHS Outcomes Framework and other policy documents should reflect as far as possible a quantitative analysis of this kind. It is equally important that the Commissioning Outcomes Framework, which will be used by the NHS Commissioning Board to hold the new Clinical Commissioning Groups (CCGs) to account, is based on a similar analysis. The Framework should cover all common mental health conditions both for adults and children. Without this there is a risk that local commissioners will continue to fail to give mental illness the priority it deserves.
The future of IAPT
The new analysis should include the role of mental illness in affecting physical health. Every year the evidence on this accumulates and it is now clear that IAPT as originally planned is too limited to handle the mental problems of people with long-term physical conditions or medically unexplained symptoms.
In these areas we need close working between the relevant medical specialists and psychological therapists who also have deep understanding of some particular condition (e.g. cardiovascular, pulmonary, abdominal, musculo-skeletal, diabetic or other problems). The
therapy will be best delivered on the premises of acute trusts or GPs, and there is therefore an issue of how the therapists should be employed and supervised. This could vary, but the best way to make sure it happened would be through an expansion of the IAPT service. This would provide professional identity, supervision and career progress, even though the staff concerned were working in the physical parts of the NHS.
So we propose that the expansion of IAPT should continue for a further 3 years after 2013/14, with a strong focus on therapies relevant to people with physical symptoms. IAPT is already preparing itself for a commissioning system where services are paid according to the outcomes of their patients. This is a welcome development. And so is the practice of competitive tender which is already well-established in IAPT. But IAPT insists that the treatments provided are evidence-based and recommended by NICE. This is exactly the same as the practice in physical medicine, and we would strongly oppose any system where providers could be paid for providing treatments without a strong evidential base.40
At the same time it is imperative to upgrade the specialist help provided to children
with mental health problems. Much of the work in CAMHS does not follow NICE Guidelines,41 which inhibits the quality of the work and may reduce the number of children treated. To remedy this the government’s Children and Young Person’s IAPT programme will need to continue for at least six years.
None of these crucial developments, for adults or for children, can be sustained without a strong lead from the central NHS management. So we urge that the Commissioning Board takes on IAPT as one of its high priority projects. From the training perspective, IAPT should also be a high priority for Health Education England.
The training of GPs
But easier access to treatment is not enough. It is also vital that mental illness be diagnosed, and diagnosed as early as possible. GPs are crucial to this process. Some people do go to see the GP about their mental problems (this accounts for 25% of all visits to GPs). But others do not go or go reporting physical symptoms only. So GPs often fail to recognise mental illness, especially when the person also has a physical problem.42 This has to be improved.
Moreover GPs do much more than diagnose illness. They are also the prime providers of mental health medication - both for people with a psychosis and as an effective short-run treatment for depression and some other disorders. They also care for the physical needs of mentally ill people, which are intimately bound up with their mental state. So GPs are the on-going physicians for nearly all mentally ill people. It is therefore vital that they have the necessary expertise in treatment (though not necessarily in psychological therapy).
This is a big responsibility: mental illness is around 40% of all morbidity at all ages. So
training lasts 3 years, involving rotations in many different specialties. But the majority of GPs do no rotation in mental illness. This makes no sense. Recently, the Royal College of General Practitioners has received agreement from Medical Education England to extend the postgraduate training of GPs to 4 years. The College also received support from the Academy of Medical Royal Colleges. There is now an great opportunity to build on the RCGP’s excellent curriculum and introduce mandatory placements in mental health and paediatrics. We would strongly support this proposal, but it is vitally important that GPs receive mental health training that is relevant to the job. The vast majority of mental problems that GPs deal with are depression or anxiety in adults or problems with disturbed children. So GPs should do their mental health placements where these problems are treated. These placements should now include a local IAPT service. At the same time mental health awareness needs to be raised in all NHS staff, including doctors and nurses in general hospitals, so that the mental health needs of patients with physical illness will be properly dealt with.
The added value of psychiatrists
The final major problem concerns patients with more complex mental health problems. They need a psychiatrist, even if they have no history of psychosis. The need for psychiatrists, who have medical training, is becoming increasingly obvious when we consider the interplay between mind and body which has been a central theme of this report.
The UK like many other countries has struggled to attract sufficient numbers of medical graduates into psychiatry. Although there are signs of improvement in recruitment rates, approximately 1 in 7 posts remain unfilled. Historically the shortage of UK medical graduates applying to psychiatry has been masked by recruitment of international medical graduates.
There are a number of challenges facing psychiatry recruitment. One is administrative. Young doctors are now forced to choose their specialty too early. At one time “late choosers” used to make up half of all those entering psychiatry – a late choice often based on mature observation. This needs to change, with more specialist doctors doing rotations in psychiatry before making their choice. A second reason may lie in the organisation of mental healthcare. Psychiatrists are the leading experts on mental health, as surgeons are in surgery. But in many secondary services they have been displaced from their leadership role. This may have made the profession less attractive and in many cases needs to be reversed.
The final problem is the attitude of many other doctors. We know from surveys and observation that it is routine for other doctors to make derogatory remarks about psychiatry, which affects not just psychiatrists but also their patients. This has to change and one hopes that some of the information given earlier in this report can convince the rest of the medical world that psychiatry is as much a science as that which other specialists practice.
So what is needed is a major rethink, especially on the part of commissioners. It applies to the conditions we have discussed and, as strongly, to people with problems of dementia or substance abuse.
People with mental illnesses are particularly vulnerable. They are often afraid to seek help or even to say they are unwell, and so are their relatives. But they represent nearly one half of all the health-related suffering in this country. Within the NHS they represent the greatest areas of unmet need both among adults and children.
Moreover it might well cost the NHS nothing in net terms to address these problems – certainly far less than to address most unmet physical needs. To commissioners at all levels we say, Please rethink your priorities.
Annex A: Members of the CEP’s Mental Health Policy Group
Professor Lord Richard Layard, (Chair), Director, Well-Being Programme, Centre for Economic Performance, LSE
Professor Sube Banerjee, Professor of Mental Health and Ageing, Institute of Psychiatry, King's College London; Clinical Director MHOA, South London and Maudsley NHS Foundation Trust; Head, Centre for Innovation and Evaluation in Mental Health
Stuart Bell, Chief Executive, South London and Maudsley NHS Trust
Professor David Clark, Professor of Psychology, Department of Experimental Psychology, University of Oxford
Professor Stephen Field, General Practitioner, Bellevue Medical Centre, Birmingham, Chair, NHS Future Forum & Chair National Inclusion Health Board; former chairman of Royal College of General Practitioners
Professor Martin Knapp, Professor of Social Policy, Director of the Personal Social Services Research Unit and Director of the NIHR School for Social Care Research, LSE;
Professor of Health Economics and Director of the Centre for the Economics of Mental Health at Institute of Psychiatry, King's College London
Baroness Molly Meacher, Chair, East London NHS Foundation Trust Christopher Naylor, Fellow, Health Policy, The King's Fund
Michael Parsonage, Chief Economist, Centre for Mental Health
Professor Stephen Scott, Professor of Child Health and Behaviour, Institute of Psychiatry, King's College London; Director, National Academy for Parenting Research
Professor John Strang, Head of Addictions Department, Institute of Psychiatry, King's College London
Professor Graham Thornicroft, Professor of Community Psychiatry; Head of Health Service and Population Research Department, Institute of Psychiatry, King's College London
Professor Simon Wessely, Head, Department of Psychological Medicine, Institute of Psychiatry, King's College London
Annex B: Prevalence of adult mental health conditions and % in treatment,
England 2007
% of adults diagnosable
(1)
% of (1) in treatment
(2)
% of (1) receiving counselling or
therapy
Anxiety and/or depression 15.0 24 10
PTSD 3.0 28 10
Psychosis 0.4 80 43
Personality Disorder* 0.7 34
ADHD 0.6 25 4
Eating disorders 1.6 23 15
Alcohol dependence 5.9 14 6
Drug dependence 3.4
Cannabis only 2.5 14 7
Other 0.9 36 22
Any condition 23.0 18
* Includes Anti-social P.D. and Borderline P.D.
Annex C: Sources of figures and tables
Figure 1 – Morbidity among people under 65: Based on WHO, 2008. Further calculations by Mike Parsonage. England.
Figure 2 - Rates of morbidity in each age group: WHO, 2008. Western Europe.
Figure 3 - Rates of mental illness by income group (%): McManus et al., 2009.
Figure 4 - Patients remaining free of depression after recovery (%): Fava et al., 2004. _____
Table 1 - Percentage suffering from mental illness: McManus et al., 2009; Green et al., 2005. Adult data are for 2007. Child data for 2004. Both are based on household surveys.
Table 2 - The burden of disease: Based on WHO, 2008.
Table 3 – Factors explaining low life satisfaction: British Household Panel Survey (BHPS) 1996-2008. Calculations by Sarah Flèche.
The questions are
How satisfied or disatisfied are you with your life overall? (1-7, with 1 “Not satisfied at all” and 7 “Completely satisfied)
The dependent variable is a dummy variable for those reporting levels 1-4
Do you have each of 12 physical problems? Our variable is the number of positive replies. On mental health: the GHQ12 (total score)
Controls: sex, age, age2, marital status, children, employment, education, time, region. The proportion of respondents reporting life satisfaction at 1-4 was 25% and the proportion reporting 1-3 was 10%. The partial regression coefficients (with standard errors) for each dependent variable were as follows:
Life-satisfaction 1-4 Life-satisfaction 1-3
.15 (.002) .15 (.001)
.23 (.009) .18 (.007)
-.05 (.004) -.04 (.003)
Table 4 - NHS mental health expenditure (England, 2010/11): DH, 2011a, DH 2011b, DH 2011c, DH 2011d, NHS Information Centre, 2011.
Table 5 –Cost-effectiveness of some treatments for mental and physical illnesses
Compiled by Professor Stephen Pilling of the National Collaborating Centre for Mental Health at UCL, to whom we are most grateful. All the data are taken from relevant NICE guidance. Depression data use the Hamilton Depression rating scale.
Annex B - Prevalence of adult mental health conditions and % in treatment:
End-notes
1These problems raise a whole set of further issues (often relating to different institutions) which we do not have time to discuss. For dementia, they are well treated in DH, 2009 and Knapp and Prince, 2007, and Banerjee, 2011. For substance abuse see Coulthard et al., 2002, and Strang and Drummond, 2012 and Drummond, 2012. In both these areas there is massive undertreatment (see Annex B), connected to lack of facilities and a failure to diagnose by GPs.
2
In England the number of people with mental illness thus defined is about 7 million and the number of dwellings in England is 21 million. Thus, if each mentally ill person were the only one in their household, a third of households would include a mentally ill person. The assumption made is clearly extreme, but this is offset by the fact that most ill adults belong to more than one family (their own family and their parents’ family).
3
Naylor et al., 2012.
4
In the case of the UK government’s QALYs, random samples of the general public are asked how they would weight conditions with different characteristics. The weights used by WHO may well underweight the relative severity of mental health conditions. This is also true of QALYs (Bockerman et al., 2011).
5
Moussavi et al., 2007.
6
The figure for mental illness is 44% among working age adults and 42% among people under 65.
7
Morbidity from a given type of illness is measured as 100% if the person is healthy and (100-y)% if the person is sick, where y is the value shown on the y-axis. Because detailed age-specific data for the UK are not published by the WHO, Figure 2 is based on information relating to Western European countries, including the UK, as a group.
8
It has been estimated that one half of the population will at some stage in their life have a diagnosable mental problem. Kessler et al., 2005.
9
Excludes dementia, substance abuse and personality disorder. For adults 2007; for children 2004.
10
Includes dementia, substance abuse and personality disorder.
11
Centre for Mental Health, 2007, p.2. The figure given there is 40%.
12
DWP. The Adult Psychiatric Morbidity Survey 2007 shows that 52% of people on incapacity benefit had a diagnosable mental illness.
13
See, for example, Mykletun, 2009 and Bender et al., 1998.
14
See for example, Boscarino, 2004; Brotman et al., 2007; Kiecolt-Glaser et al., 2002.
15
For this and next sentence, see Naylor et al., 2012, p.6. and references therein.
16
2010/11 was the third year of IAPT which in the Spending Review was assigned £173 million for that year (including some payments directly to HEIs). The 2010/11 National Survey of Investment in Adult Mental Health Services (done by Mental Health Strategies) recorded expenditures on psychological therapy as follows: some £170 million of IAPT expenditure plus another £180 million non-IAPT expenditure on psychological therapies (mainly for people with “severe and enduring mental illness” i.e. at risk of psychosis.)
17
This is 25% of total GP costs, reflecting the proportion of visits to the surgery. (DH, 1999).
18
Naylor et al., 2012.
19
20
Bermingham et al., 2010.
21
Layard, 2012.
22
Dame Carol Black’s 2008 report ‘Working for a healthier tomorrow’ gives figures to suggest that the total Exchequer cost of ill health in the working-age population in terms of social security payments and forgone taxes is in the range £57-65 billion a year (UK, 2007). Assuming that half of this cost relates to mental ill health and adjusting to England only, current prices, it may be estimated that the Exchequer cost of mental illness among people of working age is around £28 billion a year.
23
Kim-Cohen et al., 2003; Kessler et al., 2005
24
Centre for Mental Health, 2009.
25
Scott et al., 2001. The figures are excess costs between ages 10 and 28, discounted and expressed in 2012 prices.
26
Others will also have improved but not enough to lose all their main symptoms. For comprehensive evidence, see Clark et al., 2007.
27
This is an average, after allowing for natural recovery.
28
On this paragraph, see Layard et al., 2007; Clark, 2011 ; Gyani et al., 2011.
29
Layard et al., 2007.
30
Chiles et al., 1999, page 215, first column.
31
Dupont, 2007 ; Howard et al., 2010 ; Moore et al., 2007 ; Sharpe et al., 2001.
32
Knapp et al., 2011.
33
Treatment rates are know to be even lower for marginal groups like travellers, sex-workers and homeless people.
34
Mind, 2010, and DH (2010).
35
CEP Mental Health Policy Group (2006).
36
There are also some deplorable cuts in community services for people with severe mental illness which need to be reversed.
37
Green et al., 2005, p.216.
38
http://www.rcgp.org.uk/news/press_releases_and_statements/gps_demand_better_psychologica/the_s urvey.aspx 590 members replied to the specific questions.
39
On the case for this, see Kelvin et al., 2009.
40
Such a faulted system has been proposed by some people. The dangers here are (1) cherry-picking of patients and (2) even greater pressure on patients to report favourable outcomes than arises in all systems of measuring mental health outcomes.
41
Kelvin et al., 2009.
42
NICE, 2009. NICE guidelines on common mental health disorders make clear recommendations on the identification of mental illness which should be universally applied.
REFERENCES
Banerjee, S. (2011). Dementia -The great health and social care challenge for the 21st century. Presentation to the CEP Mental Health Policy Group, 3 October 2011. Available here: http://cep.lse.ac.uk/_new/research/mentalhealth/default.asp
Bender, R., C. Trautner, M. Spraul and M. Berger (1998). "Assessment of Excess Mortality in Obesity." American Journal of Epidemiology 147(1): 42-48.
Bermingham, S., A. Cohen, J. Hague and M. Parsonage (2010). "The cost of somatisation among the working-age population in England for the year 2008-2009." Mental Health in Family Medicine 7: 71-84.
Black, C. (2008) Working for a healthier tomorrow. Dame Carol Black's Review of the health of Britain's working age population. Presented to the Secretary of State for Health and the Secretary of State for Work and Pensions, 17th March 2008.
Böckerman, P., E. Johansson and S. I. Saarni (2010). "Do established health-related quality-of-life measures adequately capture the impact of chronic conditions on subjective well-being?" Health Policy 100: 91-95.
Boscarino, J. A. (2004). "Posttraumatic Stress Disorder and Physical Illness." Annals New York Academy of Sciences 1032: 141-153.
Brotman, D. J., S. H. Golden and I. S. Wittstein (2007). "The cardiovascular toll of stress." The Lancet 370(9592): 1089-1100.Centre for Economic Performance's Mental Health Policy Group (2006). "The Depression Report: A New Deal for Depression and Anxiety Disorders."
Centre for Economic Performance's Mental Health Policy Group (2006). The Depression Report: A New Deal for Depression and Anxiety Disorders.
Centre for Mental Health (2007). Mental health at work: developing the business case.
Centre for Mental Health (2009). The chance of a lifetime: preventing early conduct problems and reducing crime.
Chiles, J. A., M. J. Lambert and A. L. Hatch (1999). "The Impact of Psychological Interventions on Medical Cost Offset: A Meta-analytic Review." Clinical Psychology: Science and Practice 6(2): 204-220.
Clark, D. (2011). "Implementing NICE guidelines for the psychological treatment of depression and anxiety disorders: The IAPT experience." International Review of Psychiatry 23: 375-384.
Clark, D., S. Pilling and D. Richards. (2007). The effectiveness of psychological therapy. Available here: http://cep.lse.ac.uk/_new/research/wellbeing/default.asp
Coulthard, M., M. Farrell, N. Singleton and H. Meltzer (2002). Tobacco, alcohol and drug use and mental health, Office for National Statistics.
Department of Health. (1999). A National Service Framework for Mental Health. Available from
http://www.dh.gov.uk/prod_consum_dh/groups/dh_digitalassets/@dh/@en/documents/ digitalasset/dh_4077209.pdf.
Department of Health (2009). Living well with dementia: A National Dementia Strategy.
Department of Health (2010). ‘Hospital Waiting Times and Waiting Lists’ (Historical Time Series). Department of Health website. Available at: www.dh.gov.uk/en/Publicationsandstatistics/Statistics/Performancedataandstatistics/Ho spitalWaitingTimesandListStatistics/index.htm (accessed on 24 March 2010).
Department of Health (2011a). England level programme budgeting data for 2003-04 to 2010-11
www.dh.gov.uk/en/Managingyourorganisation/Financeandplanning/Programmebudgeti ng/DH_075743#_3.
Department of Health (2011b). Annual report and accounts 2010-11
Department of Health (2011c). 2010/11 national survey of investment in adult mental health services.
Department of Health (2011d). 2010-11 national survey of investment in mental health services for older people.
Drummond, C. (2012). Alcohol policy and the preventive paradox, Presentation to the CEP Mental Health Policy Group, 19 March 2012. Available here: http://cep.lse.ac.uk/_new/research/mentalhealth/default.asp
Dupont, S. (2007). " The COPD Breathlessness Clinic in Hillingdon Hospital."
Fava, G. A., C. Ruini, C. Rafanelli, L. Finos, S. Conti and S. Grandi (2004). "Six-year outcome of cognitive behavior therapy for prevention of recurrent depression." American Journal of Psychiatry 161(10): 1872-1876.
Green, H., A. McGinnity, H. Meltzer, T. Ford and R. Goodman (2005). Mental health of children and young people in Great Britain, Office of National Statistics.
Gyani, A., R. Shafran, R. Layard and D. Clark (2011). Enhancing Recovery Rates in IAPT Services: Lessons from analysis of the Year One data. Available here: http://www.iapt.nhs.uk/silo/files/enhancing-recovery-rates--iapt-year-one-report.pdf Howard, C., S. Dupont, B. Haselden, J. Lynch and P. Wills (2010). "The effectiveness of a
hospital admissions in elderly patients with chronic obstructive pulmonary disease." Psychology, Health & Medicine 15(4): 371-385
Kelvin, R., R. Layard and A. York (2009). Improving Tier 2-3 CAMHS, LSE mimeo.
Kessler, R. C., P. Berglund, O. Demler, R. Jin and E. E. Walters (2005). "Lifetime Prevalence and Age-of-Onset Distributions of DSM-IV Disorders in the National Comorbidity Survey Replication." Archives of General Psychiatry 62: 593-602.
Kiecolt-Glaser, J. K., L. McGuire, T. F. Robles and R. Glaser (2002). "Emotions, Morbiditym and Mortality: New Perspectives from Psychoneuroimmunology." Annual Review of Psychology 53: 83-107.
Kim-Cohen, J., A. Caspi, T. E. Moffitt, H. Harrington, B. J. Milne and R. Poulton (2003). "Prior Juvenile Diagnoses in Adults with Mental Disorder: Developmental Follow-Back of a Prospective-Longitudinal Cohort." Archives of General Psychiatry 60: 709-717.
Knapp, M. and M. Prince (2007). Dementia UK: The full report, Alzheimer's Society.
Knapp, M., D. McDaid and M. Parsonage, Eds. (2011). Mental Health Promotion: The economic case, Department of Health.McManus et al, 2009
Layard, R. (2012). Mental Health: The New Frontier for the Welfare State. CEP 21st Birthday Lecture Series. Given on 6 March 2012. Available here: http://cep.lse.ac.uk/_new/research/wellbeing/default.asp
Layard, R., D. Clark, M. Knapp and G. Mayraz (2007). "Cost-benefit analysis of psychological therapy." National Institute Economic Review 202: 90-98.
McManus, S., H. Meltzer, T. Brugha, P. Bebbington and R. Jenkins, Eds. (2009). Adult psychiatric morbidity in England, 2007. Results of a household survey, The Health &Social Care Information Centre, Social Care Statistics.
Mind (2010). We need to talk. Getting the right therapy at the right time. Available at: http://www.mind.org.uk/assets/0001/0027/Mind_We_need_to_talk_Report.pdf
Moore, R. K. G., D. G. Groves, J. D. Bridson, A. D. Grayson, H. Wong, A. Leach, R. J. P. Lewin and M. R. Chester (2007). "A Brief Cognitive-Behavioral Intervention Reduces Hospital Admissions in Refractory Angina Patients." Journal of Pain and Symptom Management 33(3): 310-316.
Moussavi, S., S. Chatterji, E. Verdes, A. Tandon, V. Patel and B. Ustun (2007). "Depression, chronic diseases, and decrements in health: results from the World Health Surveys." The Lancet 370(9590): 851-858.
Mykeltun, A., O. Bjerkeset, S. Overland, M. Prince, M. Dewey and R. Stewart (2009). "Levels of anxiety and depression as predictors of mortality: the HUNT study." The British Journal of Psychiatry 195: 118-125.
National Institute for Health and Clinical Excellence (NICE) (2009). "Depression in adults with a chronic physical problem: Treatment and management." NICE clinical guideline 91.
Naylor, C., M. Parsonage, D. McDaid, M. Knapp, M. Fossey and A. Galea (2012). Long-term conditions and mental health: The cost of co-morbidities. The King’s Fund and Centre for Mental Health.
NHS Information Centre (2011). Prescription cost analysis 2010.
http://www.ic.nhs.uk/webfiles/publications/007_Primary_Care/Prescribing/Prescription_Cost _Analysis_England_2010/Prescription_Cost_Analysis_2010.pdf
Nimnuan, C., M. Hotopf and S. Wessely (2001). "Medically unexplained symptoms: an epidemiological study in seven specialities." Journal of Psychosomatic Research 51: 361-367.
Parsonage, M. and C. Naylor (2012). Mental health and physical health: a comparative analysis of costs, quality of service and cost-effectiveness, Presentation to the CEP Mental Health Policy Group, 16 January 2012. Available here: http://cep.lse.ac.uk/_new/research/mentalhealth/default.asp
Scott, S., M. Knapp, J. Henderson and B. Maughan (2001). "Financial cost of social exclusion: follow-up study of antisocial children into adulthood." British Medical Journal 323(28th July): 1-5.
Sharpe, L., T. Sensky, N. Timberlake, B. Ryan, C. R. Brewin and S. Allard (2001). "A blind, randomized, controlled trial of cognitive-behavioural intervention for patients with recent onset rheumatoid arthritis: preventing psychological and physical morbidity." Pain 89: 275-283.
Strang, J. and Drummond, C. (2012). Addictions – drugs, alcohol: an evidence-based orientation, Presentation to the CEP Mental Health Policy Group, 19 March 2012. Available here: http://cep.lse.ac.uk/_new/research/mentalhealth/default.asp
Wessely, S. (2011). The crisis in recruitment into psychiatry training. Available here: http://cep.lse.ac.uk/_new/research/mentalhealth/default.asp
THE LONDON SCHOOL OF ECONOMICS AND POLITICAL SCIENCE HOUGHTON STREET LONDON WC2A 2AE
Tel: 020 7955 7673 Fax: 020 7955 7595 Web: http://cep.lse.ac.uk Email: cep_info@lse.ac.uk