An Evaluation of Classification Models for Question Topic Categorization
Bo Qu†, Gao Cong‡, Cuiping Li†, Aixin Sun‡, Hong Chen††Renmin University, Beijing, China
{qb8542,licuiping,chong}@ruc.edu.cn ‡ Nanyang Technological University, Singapore
{gaocong,axsun}@ntu.edu.sg Abstract
We study the problem of question topic classification using a very large real-world Community Question An-swering (CQA) dataset from Yahoo! Answers. The dataset contains 3.9M questions and these questions are organized in more than one thousand categories in a hierarchy. To our best knowledge, this is the first systematic evaluation of the performance of different classification methods on question topic classification as well as short texts. Specifically, we empirically evaluate the followings in classifying questions into CQA categories: 1) the use-fulness of n-Gram features and bag-of-word features; 2) the performance of three standard classification algorithms (Na¨ıve Bayes, Maximum Entropy, and Support Vector Machines); 3) the performance of the state-of-the-art hier-archical classification algorithms; 4) the effect of training data size on performance; and 5) the effectiveness of the different components of CQA data, including subject, content, asker, and the best answer. The experimental results show what aspects are important for question topic classification in terms of both effectiveness and efficiency. We believe that the experimental findings from this study will be useful in real-world classification problems.
1
Introduction
Community Question Answering (CQA) services are Internet services that enable users to ask and answer ques-tions, as well as to browse and search through historical question-answer pairs. Examples of such community-driven knowledge services include Yahoo! Answers (answers.yahoo.com), Naver (www.naver.com), Baidu Zhidao (zhidao.baidu.com), and WikiAnswers (wiki.answers.com). These CQA services have developed rapidly and accumulated a large number of questions and answers since their launches. For example, Yahoo! answers had 86M resolved questions as of June 22, 2010.
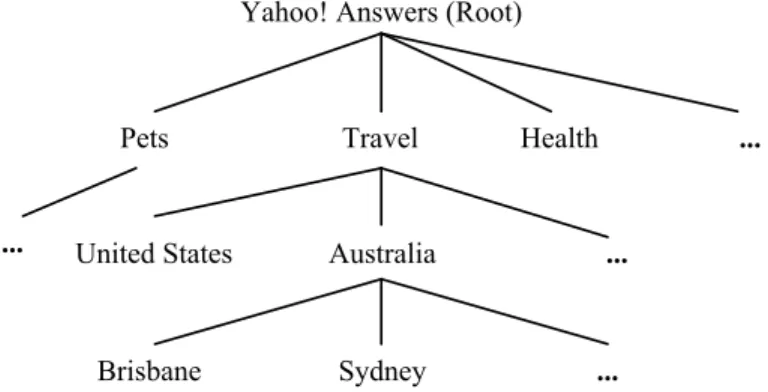
Questions in CQA services are organized into hierarchies of categories that often contain thousands of leaf cat-egories, where each category represents a topic. Figure 1 shows a small part of Yahoo! Answers hierarchy. The questions in the same category or subcategory are usually relevant to the same general topic. For example, the ques-tions in the subcategory “Travel.Australia.Sydney” mainly are relevant to travel in the city of Sydney.
The category information in CQA is quite useful in at least the following three aspects: 1) The hierarchy of categories facilitates browsing questions and answers; 2) The category based organization enables searching questions and answers (that is to find similar questions for a given question) within a specific subcategory. 3) The category information can be utilized to enhance the question search models, thus improving the performance of question search (X. Cao, Cong, Cui, Jensen, & Zhang, 2009).
In this paper, we study a practical problem, namely automatic question topic classification in CQA service. This problem is interesting due to the following aspects, in particular.
Yahoo! Answers (Root)
Pets Travel Health ...
United States Australia ...
Brisbane Sydney ...
...
Figure 1: Example category structure of Yahoo! Answers
Table 1: Datasets used in previous studies and our work, including number of training/test/total instances
Work Dataset #Training #Test #Total
(Bennett & Nguyen, 2009) ODP 1.2M 509K 1.7M (Xue, Xing, Yang, & Yu, 2008) ODP 1.2M 130K 1.3M (Cesa-Bianchi, Gentile, & Zaniboni, 2006) RCV1 40K 16K 56K
(T.-Y. Liu et al., 2005) Yahoo! Directory 0.5M 275K 0.8M (Wang & Zhou, 2001) ACM/IBM Patent 13K/4K 3K/1K 16K/5K (Dumais & Chen, 2000) LookSmart 50K 10K 60K
(Labrou & Finin, 1999) Yahoo! Dictionary - - 152K Our work Yahoo! Answers 3.1M 800K 3.9M
First, question topic classification will help to improve CQA services. When a user asks a new question in a CQA service, the question does not have a category, and thus most of CQA services will request users to provide a category for the new question. In most of the current CQA services,the user typically needs to manually choose a category label for a new question from a predefined hierarchy of categories, which can easily contain thousands of categories. Hence it will make it easier for users if we can automatically suggest one or several categories for users to choose.
Second, we have access to a large number of QA pairs from Yahoo! Answers with 3.9M questions organized in more than one thousand categories in a hierarchy. This dataset is much larger than those used in previous studies on text classification as shown in Table 1. The huge dataset enables us to systematically study the performance of different classification methods on short texts in the presence of a very large training data. This also enables us to study the effect of training data size on the classification performance. As each QA instance is typically much shorter than a normal document or web page, the experimental results will offer insight and guideline for other short text classification tasks, such as classifying twitter data and search query, and text-based video classification (Huang, Fu, & Chen, 2010).
Third, the QA data has some distinct features from document and web page data. A QA instance usually consists of asubject(i.e., question), anasker,content, one or moreanswersand among which abest answeris often identified through the voting of the community users or chosen by the asker. It is therefore interesting to evaluate the eff ective-ness of the different components of the CQA data in question topic classification task. Note that the question topic classification task is different from the traditional question classification defined in TREC QA (Li & Roth, 2002; Lin & Katz, 2006). We discuss this in Section 5.1.
1.1 Contributions
First, we systematically study the problem of automatic question topic classification in Yahoo! Answers. To our best knowledge, this is the first work on question topic classification in CQA services. We study the effectiveness and efficiency of using two types of feature representation, bag-of-words and n-Grams, for classification. We find thatn-Grams do not help for our classification task, which is different from the results reported in previous work (Cavnar & Trenkle, 1994) for text classification, wheren-gram improves performance. We also study the usefulness of different components of QA pair in question topic classification. Our experiments show that the features extracted from the componentsubjectare more useful in classification than the features extracted from other components, while the combined features yield a better performance.
Second, we evaluate the effectiveness and efficiency of three standard classification methods, namely Na¨ıve Bayes (NB), Maximum Entropy (ME), and Support Vector Machines (SVM) in question classification. Our work differs from previous evaluation work in two aspects : 1) we use short texts while previous work consistently focuses on normal text collection or web pages; and 2) The data that we use is much larger than the data used in previous work.
We have the following new findings for question classification. 1) In terms of Micro-Fscore, NB is close to ME and SVM when the training data is very big while NB is still worse than SVM and ME in terms of Macro-Fscore. 2) When we double the size of the training data, the performance gain for Macro-Fscore is linear. However, the performance of classifiers has a linear increase when we use less than 0.6M training data, but the improvement for Micro-Fscore becomes smaller (sublinear) when the data size increases further. It is reported (Banko & Brill, 2001) that the accuracy of confusion sets problem (the problem of choosing the correct use of a word, e.g., {principle, principal}) increases linearly when the size of training data doubles, which is, however, a very different problem from text classification.
Third, considering that Yahoo! Answers has a hierarchy of categories as do most of other CQA services, we also employ the state-of-the-art hierarchical classification methods, including single-path hierarchical (SPH) method (Koller & Sahami, 1997), multi-path hierarchical (MPH) method (Dumais & Chen, 2000), and refined hierarchical (RHC) method (Bennett & Nguyen, 2009). We combine the three methods with NB, ME, and SVM, respectively and evaluate these combinations in terms of both effectiveness and efficiency.
To our best knowledge, none of previous work has done a systematic evaluation of the different hierarchial clas-sification methods, or their combination with different classification models. For example, Liu et al. (T.-Y. Liu et al., 2005) compare SVM and hierarchical SVM, and Bennett and Nguyen (Bennett & Nguyen, 2009) compare NB and hierarchical NB. Our experimental results show that hierarchical classification methods perform similarly to their counterparts in terms of effectiveness, while they are more efficient. This finding is different from the experimental results reported in previous work on classifying normal documents or web pages, where hierarchical classification methods perform better. These results on short texts are complementary to previous work on evaluating classification methods, which clearly focuses on either normal text collection or web pages.
Finally, we report detailed Micro-Fscore, Macro-Fscore, and runtime results of the state-of-the-art classification methods on very large dataset. These results will offer guidelines for choosing appropriate classifiers (in terms of both effectiveness and efficiency) and sizes of training data for real applications, especially short text classification.
1.2 Paper Organization
The rest of this paper is organized as follows. Section 2 details the different components of a QA pair and fea-ture representation. Section 3 describes the classifiers we employ for question classification. Section 4 reports the experimental study. Section 5 reviews the related work. Section 6 concludes this paper.
Figure 2: An example of a QA pair
2
Problem Statement
In this paper, we focus on the archive of Yahoo! Answers. In the sequence, we discuss the details of the question-answer instances in Yahoo! Answers. However, as most Community Question Answer services use similar structures as Yahoo! Answers, the results of this study are also applicable to other CQA services.
Each question in Yahoo! Answers encompasses six major components: subject,content,asker,the best answer,
all answers, andcategory. We proceed to detail them. Figure 2 gives an example question, where asker is enclosed by a blue box, subject by a red box and content by a green box.
• Subject. Each question has a subject that is the title of a question, and is often an expression in question. It usually contains the key information of a question.
• Content. Content is anoptionalfield. The purpose of adding content for a question is to provide more details on the subject of the question.
• Asker. Asker is the person who asks a question.
• BestAnswer. The best answer to a question is determined by the Asker or the community vote.
• Other Answers.In addition to the best answer, a question may receive many other answers. We do not use this component in our work since it is less reliable compared withBestAnswer.
• Category. Each question belongs to a leaf category. Note that categories in Yahoo! Answers are organized as a tree, i.e., each category can belong to at most one parent category, which is called virtual category tree (Sun & Lim, 2001).
When a user asks a new question in Yahoo! Answers, the user needs to choose a category for the question. Obviously, at the time of asking a question, there is no answer to the question. Hence we can only extract features from the other components (i.e.,subject,content, andasker) at classification time.
We obtained the dataset used in this study from the Yahoo! Webscope datatset1. The dataset contains 3.9M English questions. The category hierarchy has three levels with 27 top level categories, 305 second level categories and 1096 leaf categories. Table 2 shows the number of questions that havesubject,content,asker, andbestAnswer
components, respectively. We can see that only about half of the questions havecontentcomponent. There are about 1M distinct askers, i.e., each asker asks about 3.9 questions on average.
Table 2: Statistic information for different features
Component questions subject content bestAnswer asker
Number of instances 3.9M 3.9M 2.1M 3.7M 3.9M
Table 3: Statistic on the number of questions in different levels of the category hierarchy
level average # questions standard deviation maximum # question minimum # question
1 142,700 125,315 512,659 277
2 12,632 23,469 237,104 1
3 3,515 13,353 237,104 1
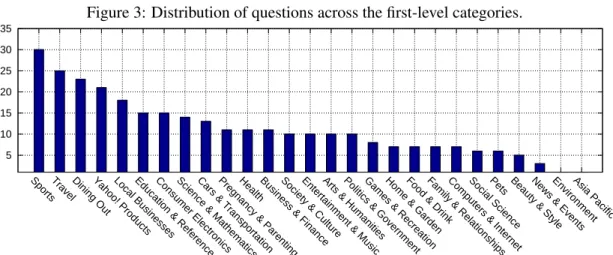
Table 3 gives the average number of questions in the categories in each level, the standard deviation of the number of questions, the maximum number of questions in the categories in each level, and the minimum number of questions in the categories in each level. Figure 3 shows the distribution of questions across the first-level categories. Figure 4 shows the number of child categories of the first-level categories.
Problem Statement: Given a question withsubject, content, andasker, we determine its leaf category in the category tree used in CQA archive.
Note that this does not mean that the best answer andother answers components cannot be used in building classifier. Like subject and content components, answers contain similar word features. As discussed in Section 1, one of the objectives of this paper is to study the effectiveness of these components in classifying questions in Community Question Answer services.
3
Question Topic Classification
We present the methodology for question topic classification in Yahoo! Answers. Section 3.1 presents the mapping process from questions to features. Section 3.2 presents flat question topic classification strategy, and Section 3.3 presents hierarchical question topic classification strategy.
Question topic classification involves a training phase and a test phase. During the training phase, a set of questions with known category labels are employed to train a classifier. During the test phase, the learned classifier is used to classify new questions.
3.1 Mapping Questions to Features
For each question, its componentssubject,content,the best answer, andother answersconsist of words. We extract bag-of-words as features from these components. In addition, we also take into account wordn-Grams, i.e., sequences ofnwords. For example, the question subject “any good food” gives rise to two 2-Grams “any good” and “good food”. For theaskercomponent, eachaskerbecomes a feature.
0 100000 200000 300000 400000 500000 600000
Family & RelationshipsEntertainment & MusicSociety & CultureComputers & InternetHealthBusiness & FinanceEducation & ReferenceScience & MathematicsPolitics & GovernmentSportsYahoo! ProductsArts & HumanitiesBeauty & StyleCars & TransportationPregnancy & ParentingFood & DrinkPets TravelGames & RecreationHome & GardenConsumer ElectronicsNews & EventsSocial ScienceLocal BusinessesDining OutEnvironmentAsia Pacific
Figure 3: Distribution of questions across the first-level categories.
5 10 15 20 25 30 35
SportsTravelDining OutYahoo! ProductsLocal BusinessesEducation & ReferenceConsumer ElectronicsScience & MathematicsCars & TransportationPregnancy & ParentingHealthBusiness & FinanceSociety & CultureEntertainment & MusicArts & HumanitiesPolitics & GovernmentGames & RecreationHome & GardenFood & DrinkFamily & RelationshipsComputers & InternetSocial SciencePets Beauty & StyleNews & EventsEnvironmentAsia Pacific
Figure 4: The number of children categories of the first-level categories.
3.2 Flat Question Classification Strategy
The flat strategy builds a flat classifier for the leaf categories without considering the non-leaf category in the hier-archical structure of categories. We explore three standard classification algorithms: Na¨ıve Bayes (NB), Maximum Entropy (ME), and Support Vector Machines (SVM).
Na¨ıve Bayes (NB). NB assumes conditional statistical independence of the individual features given the question category label. It computes the statistical distribution of each feature over the training set, which will be employed to find the category that is most likely to generate the observed feature vector in a given question. Specifically, we use the Weka (Hall et al., 2009) implementation of the multinomial distribution (Mccallum & Nigam, 1998). It has been shown that the NB with multinomial distribution outperforms the NB using Multi-variate Bernoulli Model (i.e., using binary word features) (Mccallum & Nigam, 1998).
Maximum Entropy (ME). ME computes the distribution of the observed features over the training set while max-imizing the uncertainty of the distribution, or the entropy. The optimization problem can be solved using iterative methods, iterative line search methods, gradient methods, iterative scaling methods, etc.. Detail about ME can be found in (Manning & Klein, 2003). Specifically, we use the Stanford implementation2.
Support Vector Machines (SVM). SVM finds hyperplanes separating data of different categories. We use linear SVM because it is more effective and efficient for the applications with a huge number of instances as well as
tures (Keerthi, Sundararajan, Chang, Hsieh, & Lin, 2008). Specifically, we use the LIBLINEAR3 implementation of multiclass linear SVM because it is suitable for solving large scale problems (Keerthi et al., 2008), which is the winner of ICML 2008 large-scale learning challenge (linear SVM track).
3.3 Hierarchical Question Classification Strategy
The hierarchical strategy has been shown to be more efficient and sometimes effective than the flat one in text clas-sification (Koller & Sahami, 1997). We employ three hierarchical clasclas-sification methods for question clasclas-sification: single path hierarchical classifier (SPH) (Koller & Sahami, 1997), multi-path hierarchical classifier (MPH) (Dumais & Chen, 2000), and refined hierarchical classifier (RHC) (Bennett & Nguyen, 2009).
Single Path Hierarchical Classifier (SPH). In the training phase of SPH (Koller & Sahami, 1997), for each internal node of the category tree, SPH trains a classifier using the questions belonging to its children nodes. In the testing phase, a test question is classified from top to bottom in the category tree along a single path. In other words, we use the classifier at the root node to classify a question into one of its children nodes, denoted byci, and then use the
classifier atcito classify the question into one ofc′ischildren nodes. The process continues until a leaf node, i.e., the
category of the test question, is reached.
Multi-path Hierarchical Classifier (MPH). The training phase of MPH (Dumais & Chen, 2000) is the same as that of SPH. However, MPH differs from SPH in the test phase in that SPH follows exactly a single path to reach the final category for a test questionqwhile MPH computes the classification probability of all paths and choose the one with the highest combined probability to determine the category of the test data.
Specifically, the probability of a text question belonging to a leaf category is computed by ∏hi=1P(Li|q), where P(Li|q) is the probability of question belonging to a category at levelLi. In our experiments, we find that the
perfor-mance of MPH is very poor if we consider all the paths. Instead, we only choose the top-nchildren categories for each level rather than all the categories. Specifically, we setnat 5 in this paper4.
Refined Hierarchical Classifier(RHC). RHC follows the idea of the hierarchical classification method Refined Ex-perts (Bennett & Nguyen, 2009). RHC encompasses a bottom-up phase and a top-down phase.
In the bottom-up phase, RHC trains binary classifiers at the lower level nodes using cross-validation over the training data, and then uses the membership predictions over the training data gathered during cross-validation as additional features available at the grandparent level node (to classify a question into the parent level categories). For example, in Figure 1, RHC trains binary classifier for each leaf node, e.g., at nodes “Brisbane” and “Sydney”. For each training instance, its membership prediction (using cross-validation) at leaf nodes “Brisbane” and “Sydney” becomes additional features for the classifier built at node “Travel” (in the top-down phase) to classify a question into categories “United States”, etc.
In the top-down phase, RHC builds a classifier at each node to classify a test into its children nodes using the enriched representation from the bottom-up phrase. Additionally, RHC employs the following optimization. RHC performs cross-validation over the training data and uses the predicted labels to filter the training data to a node, thus aligning the training distribution with what will likely occur during testing. Specifically, at a node, the model is trained using the actual training data at the node together with the training data that is misclassified to the node. For example, at node “Travel”, if some training data labeled with “Health” is classified to node “Travel” (known from cross-validation), we augment the training data at “Travel” with those errors that form a new subcategory with label “Health” under “Travel”, to build classification model at “Travel”. At classification time, if a question is classified into “Health” subcategory by the classifier at node “Travel”, RHC will regard this as an error classification and move the question to the “Health” node.
3
http://www.csie.ntu.edu.tw/˜cjlin/liblinear/
4We tried differentnvalues at 5, 10, 15, 20, and 25. The performance difference is very small (< 0.02 in terms of Micro-Fscore). The
4
Experiments and Results
We design our experiments to evaluate the following:
• The usefulness of bag-of-word features andn-Gram features (Section 4.2),
• The performance of the classifiers presented in Section 3, including NB, ME, SVM and the three hierarchical methods, in terms of both effectiveness and efficiency (Section 4.3),
• The impact of varying training data size on both effectiveness and efficiency (Section 4.4), and
• The usefulness of the components of QA data, includingsubject,content,askerandbestAnswer(Section 4.5).
4.1 Experimental Settings
Data Preparation.We randomly select 20% of QA data from each leaf category of the whole dataset as the test data that nearly has 0.8M QA instances. For the training data, we randomly select 20% of QA data in a similar manner to be the default training data when there is no need to evaluate the impact of varying training data size. Additionally, we also generate another 6 training datasets by randomly selecting 1%, 5%, 10%, 40%, 60%, and 80% of the whole dataset, respectively. These 6 datasets are used to evaluate the impact of varying training data in Section 4.4. Note that, there is no overlap between the training and test data instances, in all settings. We usebag-of-wordsfeatures extracted from thesubjectcomponent of the questions to represent questions when the feature representation or usefulness of question component is not evaluated.
Performance Metric. To evaluate the performance of classifiers, we employ two popularly used measures, namely micro-averaged and macro-averagedF1 scores (Yang & Liu, 1999), denoted by Micro-Fscore andMacro-Fscore, respectively. All experiments are conducted on a server with 2.0 GHz Intel 2-Core CPU and 8GB memory.
4.2 Evaluating Bag-of-Words andn-Gram Features
Table 4: The effectiveness ofn-Gram features
Classifier Features Flat Hierarchical(SPH) (n-Grams) Micro-Fscore Macro-Fscore Micro-Fscore Macro-Fscore
NB 1-Gram 0.359 0.068 0.358 0.098
1+2-Grams 0.355 0.075 0.354 0.101 1+2+3-Grams 0.340 0.073 0.340 0.091 1+2+3+4-Grams 0.326 0.072 0.327 0.072
ME 1-Gram 0.375 0.171 0.372 0.188
1+2-Grams - - 0.370 0.177
1+2+3-Grams - - 0.367 0.173
1+2+3+4-Grams - - 0.365 0.171
SVM 1-Gram 0.391 0.183 0.382 0.201
1+2-Grams 0.390 0.181 0.381 0.190 1+2+3-Grams 0.389 0.181 0.380 0.190 1+2+3+4-Grams 0.387 0.180 0.380 0.189
The first set of experiments is to evaluate the usefulness of n-Gram features in question topic classification in terms of both the effectiveness and efficiency for both hierarchical and flat classifiers. We consider four sets of features
0 0.1 0.2 0.3 0.4 0.5 Micro-Fscore Macro-Fscore FScore NB SPH+NB MPH+NB RHC+NB ME SPH+ME MPH+ME RHC+ME SVM SPH+SVM MPH+SVM RHC+SVM
(a) Effectiveness
10 100 1000 10000 100000 1e+006 1e+007 1e+008 Training Classifying Time (ms) NB SPH+NB MPH+NB RHC+NB ME SPH+ME MPH+ME RHC+ME SVM SPH+SVM MPH+SVM RHC+SVM
(b) Efficiency
Figure 5: The performance comparison of different classifiers
generated fromsubjectsof questions: bag-of-words (i.e., 1-Gram), 1+2-Grams, 1+2+3-Grams and 1+2+3+4-Grams, where 1+2-Grams means the union of bag-of-word features and 2-Gram features, and the others follow. We use the flat models presented in 3.2 and their combinations with the hierarchical model SPH in this experiment.
Table 4 shows the effectiveness of classifiers using different sets of features in terms of Micro-Fscore and Macro-Fscore. We can see that bag-of-word features (i.e., 1-Gram) perform the best in terms of Micro-Fscore, and the performance in terms of Micro-Fscore drops slightly when we include larger n-Grams as features. Note that ME ran out of memory when we used 1+2-Grams.
We also experiment to use 2-Grams, 3-Grams or 4-Grams alone as features. However the performance is much worse than when they are used together with 1-Gram. Although it is reported that usingn-Gram features usually improves classification performance for document classification (Cavnar & Trenkle, 1994), it nearly does not help for question topic classification. The reason could be that questions are much shorter than normal documents, and thus then-Gram features are usually very sparse, especially when we increase the value ofn.
4.3 Performance of Different Classifiers
This experiment is to compare the effectiveness and efficiency of the 12 different classification methods, including three flat classification models, and their combinations with the three hierarchical methods. Similar to the first set of experiments, the question features are extracted from the subject component using bag-of-words representation.
Figure 5(a) shows the effectiveness of different classification models in terms of Micro-Fscore and Macro-Fscore. Figure 5(b) reports the efficiency of different classification models. For consistency, classification methods based on the same model (e.g., NB) are plotted using the same color5.
We make the following observations: 1) For the three hierarchical classification methods, in terms of both Micro-Fscore and Macro-Micro-Fscore SPH performs similarly as does RHC, and both outperform MPH, when combined with either of the three standard classification models, NB, ME and SVM. All the differences are statistically significant using t-test, p-value≪0.01. It is a bit to our surprise that the simple SPH method achieves similar performance as does the state-of-the-art approach RHC. We are aware that in the application domain (Dumais & Chen, 2000) of RHC, an instance may belong to multiple categories, while in our problem each question belongs to a single category. And we did not build the 1096 binary classifiers on the leaf nodes in the bottom-up process of RHC because of the limited memory and the inconspicuous improvement with the binary classifiers on the higher level nodes. We are also aware that MPH is usually used in the case that an instance may belong to multiple categories in previous work.
2) For the three flat models, in terms of Micro-Fscore, SVM (0.391) outperforms NB (0.359) by 8.9% and ME (0.375) by 4.3% (See Table 4 and Figure 5(a)). In terms of Macro-Fscore, SVM (0.183) outperforms NB (0.068) by 169% and ME (0.171 ) by 7%. SVM and ME greatly outperform NB in terms of Macro-Fscore. All the improvements are statistically significant using t-test, with p-value≪0.01.
3) By comparing SPH method with its flat counterpart, we find that the hierarchical method nearly cannot im-prove flat classification model in terms of Micro-Fscore (SPH+NB is slightly better than NB while SPH+ME and SPH+SVM are slightly worse than ME and SVM, respectively). However, SPH improves the standard flat classifica-tion models in term of Macro-Fscore, e.g., SPH+NB over NB by 44%, SPH+ME over ME by 9.9% and SPH+SVM over SVM by 9.8%. Again, all the differences are statistically significant using t-test, with p-value≪0.01.
4) In terms of classification time, the SPH method is able to speedup the standard flat classification models significantly: SPH+NB is an order of magnitude faster than NB, so do SPH+ME and ME; SPH+SVM saves 1/3 classification time of SVM. The hierarchical classifiers need less classification time in that the categories they consider are fewer than those of flat ones. For example, consider a training set with 64 categories that are organized as a 4-level tree and each non-leaf node has 4 children nodes. The flat classifiers need to consider 64 categories to classify a test question while the SPH only needs to do three times of classification, each of which SPH considers 4 categories. In addition, among the three hierarchical methods, MPH takes the longest classification time in that it needs to compute the combined probabilities of a number of paths for a test question.
5) In terms of training time, SPH method can significantly reduce the training time of ME and SVM by orders of magnitude, while SPH+NB takes longer than NB. In addition, RHC is the most expensive in terms of training time, as expected.
By comparing the training time and classification time of the three standard classification models, we can see that ME is the most expensive in terms of both training time and classification time; SVM is also slow at training, but is the most efficient in classification; NB is efficient at training while it is slower than SVM at classification time. However, we would tame this finding since we use public tools for NB, ME and SVM, which could be implemented with different levels of optimization.
4.4 Varying the Size of Training Data
This experiment is to study the performance of different classifiers by varying the size of training data. Specifically, we evaluate the effectiveness and efficiency of various flat classifiers and their combinations with SPH, the most effective hierarchial classification method as shown in the last set of experiments, when the size of the training data varies from 1% to 80% of the whole dataset. Note that 1% of the data corresponds to 0.039M questions and 80% of the data corresponds to 3.1M questions. Again, we extract bag-of-words features from the subject component of the questions to build classifiers.
Figure 6 shows the effectiveness of various classifiers on training data of different sizes. Note that flat ME and flat SVM ran out of memory when we use 40% of the data as the training data. For clarity and consistency, flat classification algorithms (NB, ME and SVM) are plotted using empty symbols, while hierarchical algorithms are plotted using solid symbols. A flat classification model and its corresponding hierarchical algorithm are plotted using the same color.
The Flat approach focuses on the categories with more questions while the Hierarchical approach focuses on the ones with less questions when the training data is large enough. This can be seen as the Micro-Fscore (reflecting the performance of the categories with more questions) of the Flat approach is slightly higher than that of the hierarchical approach while the Macro-Fscore (reflecting the performance of less popular question categories) of the Flat approach is lower than that of the hierarchical approach.
0.2 0.25 0.3 0.35 0.4
1% 5% 10% 20% 40% 60% 80%
Micro-FScore
Percent of data used for training NB SPH+NB ME SPH+ME SVM SPH+SVM (a) MicroFscore 0 0.05 0.1 0.15 0.2 0.25
1% 5% 10% 20% 40% 60% 80%
Macro-FScore
Percent of data used for training NB SPH+NB ME SPH+ME SVM SPH+SVM (b) MacroFscore
Figure 6: The effectiveness of different classifiers when varying the size of training data
10 100 1000 10000 100000 1e+006 1e+007 1e+008
1% 5% 10% 20% 40% 60% 80%
Training time (ms)
Percent of data used for training NB SPH+NB ME SPH+ME SVM SPH+SVM
(a) Training time
1 10 100 1000 10000 100000
1% 5% 10% 20% 40% 60% 80%
Classifying time (ms)
Percent of data used for training NB SPH+NB ME SPH+ME SVM SPH+SVM
(b) Classification Time
Figure 7: The efficiency of different classifiers when varying the size of training data
We make two observations: 1) As we increase the size of training data, the performance of all methods improves in terms of both Micro-Fscore and Macro-Fscore. The amount of performance improvement is significant when the training data is relatively small. However, when the size of training data is relatively large, the performance becomes relatively stable and less sensitive to the size of training data—when the amount of the training data is larger than 40% of all data, the absolute improvement in terms of both Micro-Fscore and Macro-Fscore caused by increasing the size of training data is less than 0.005 for all classifiers. For example, when we double the size of the training data from 5% to 10%, the performance of SPH+SVM changes from 0.341 to 0.369 (which represents a 8.2% improvement); however when we double the training data from 40% to 80%, the performance of SPH+SVM increases only by 1%.
2) In general the SVM classifiers, including the flat SVM and SPH+SVM, achieve the best performance, followed by ME classifiers, and NB classifiers in turn, on training data of various sizes. However, when the training data is large, the difference among the different classifiers in terms of Micro-Fscore is very small; when the training data is relatively small (1% of all data), the ME classifiers perform better than others in terms of Micro-Fscore.
Figure 7 shows the efficiency of the different classifiers with various sizes of training data. As expected, the training time increases with the increase of the size of the training data for all methods. We also observe that the runtime of NB and SPH+NB increases mildly with the size of training data, while the runtime of methods based on ME and SVM increases more dramatically
4.5 Evaluating the Usefulness of Different Question Components
Table 5: The effectiveness of different question components
Classifier Components Flat Hierarchical(SPH) Micro-Fscore Macro-Fscore Micro-Fscore Macro-Fscore
NB subject 0.359 0.068 0.358 0.098
content 0.344 0.062 0.338 0.079
asker 0.098 0.004 0.105 0.009
bestAnswer 0.246 0.068 0.234 0.084
ME subject 0.375 0.171 0.372 0.188
content 0.329 0.151 0.310 0.120
asker 0.058 0.016 0.059 0.017
bestAnswer - - 0.267 0.107
SVM subject 0.391 0.183 0.382 0.201
content 0.346 0.120 0.326 0.120
asker 0.108 0.017 0.108 0.017
bestAnswer 0.299 0.105 0.248 0.072
4.5.1 Sole Component
This experiment is to study the usefulness of the different components in question topic classification when they are used alone. Specifically, we use features extracted from a single component, i.e., subject, content, asker or
bestAnswer, to build classifiers. We use each asker as a feature and use bag-of-word features for other components. At classification time, features extracted fromsubject,content, andaskerare available, but not fromanswercomponent. However, we find that using content features nearly cannot improve the effectiveness of classifiers, while it will take longer time. Hence, we only use features extracted fromsubjectandaskerat classification time.
Table 5 shows the effectiveness of different components. We can see that classifiers using thesubjectcomponent have better performance than others. All the differences are statistically significant using t-test, p-value≪ 0.01. It is expected thatsubject component is effective since it usually contains the core information of the questions. In contrast, the componentcontentis not always given by the asker; the componentbestAnswer might contain both the useful information for classification and some noise; the features extracted fromaskercomponent are very sparse and the performance of classifiers using asker component is poor as expected.
4.5.2 Ablation Experiment
Table 6: The effectiveness of different components for NB classifier Components Flat NB Hierarchial SPH+NB
Micro-Fscore Macro-Fscore Micro-Fscore Macro-Fscore All components 0.398 0.078 0.384 0.099 No subject 0.358 0.072 0.346 0.088 No bestAnswer 0.387 0.070 0.382 0.089 No Content 0.376 0.073 0.366 0.094
No Asker 0.393 0.086 0.376 0.100
This experiment is to explore which component plays a more important role in question topic classification. We remove a component from the four components each time to explore the effect of the removal on the effectiveness
of NB and SPH+NB, which run much faster than SVM and ME. Table 6 reports the result. Without the subject
component, both the Macro-Fscore and Micro-Fscore drop most severely. In contrast, theaskercomponent appears to have less effect. These results are in accord with the experimental results reported in the last experiment (sole component)—they show that thesubjectcomponent is the most important one.
4.6 Summary and Discussion
The main findings in our experiments are summarized as follows:
1. The features extracted from subjects are more useful in classification than features extracted from other com-ponents, while the combined features are the most effective.
2. N-Gram features nearly do not help in question classification.
3. SVM outperforms NB and ME in terms of effectiveness while NB takes the shortest training time and SVM is the most efficient at classification time. The performance of NB is close to SVM and ME in terms of Micro-Fscore when the training data is very large while NB is still worse than SVM and ME in terms of Macro-Micro-Fscore. 4. SPH is more efficient than the other two hierarchial classification methods and achieves better or similar
per-formance in terms of effectiveness.
5. SPH cannot improve the standard flat classification models in terms of effectiveness, while it improves efficiency greatly.
6. When we double the size of the training data, the performance gain for Macro-Fscore is linear. In terms of Micro-Fscore, the performance of classifiers has a linear increase when we use less than 0.6M (20%) training data; however the improvement becomes smaller (sublinear) as the data size increases.
These findings are new for CQA data (or short texts) (See Introduction for the comparison with the findings in previous work on text classification). There findings can provide detailed practical guidelines for choosing algorithm and the size of training data for question classification.
Although there are publications on evaluating the methods of document classification, previous evaluation work has not been conducted on QA data or other short texts. It is an open problem of the performance of the text classifica-tion methods on quesclassifica-tion classificaclassifica-tion. Even if we consider the work for the tradiclassifica-tional text classificaclassifica-tion, our work still differs significantly from the existing work in that no work evaluates the state-of-the-art hierarchal classification methods and their combinations with different classification models (NB, SVM, and ME) as we do.
5
Related Work
5.1 Question Classification in TREC QA
No published work exists for classifying Question into the category hierarchies of Community Question Answering (CQA), where each category represents a topic.
Most existing proposals, e.g., (Zhang & Lee, 2003; Moschitti, Quarteroni, Basili, & Manandhar, 2007; Blunsom, Kocik, & Curran, 2006; Suzuki, Taira, Sasaki, & Maeda, 2003), are on classifying questions based on the expected answer types (also called targets, e.g., location, time, human, numerical value, etc.) as in TREC QA track. These proposals usually use thousands of human annotated questions as training data and classify questions into tens of
categories (e.g., 56 categories in (Li & Roth, 2002)). Such kind of question classification can be utilized to find answers from document corpus but is very different from the question topic classification that classify questions into category hierarchies (that represent the topics of questions, e.g., “Travel.China”) as studied in this work.
In the TREC QA track, the existing proposals usually exploit some natural language features, such as the POS tags of words and syntactic structure of questions, and some words and their locations (e.g., questions beginning with “who” are likely to belong to “human” category.) In contrast, the categories that we use are the topics of questions, rather than the targets (or types) of questions. Our classification taxonomy is like those studies in text classification and web page classification, where bag-of-words are used as features dominantly.
The POS tag and syntactic structure features used in question classification of TREC QA would not work for question topic classification of CQA since one category (topic) of CQA taxonomy may contain all types of questions in TREC QA. A specific example is that “who” questions often indicate “person” type of TREC question classification, and “Which country” indicates “location” type of TREC questions. Such features could be captured by POS tags and syntactic structure features. However, “who” questions can belong to any topic in the question topic classification task, and so do “Which country” questions. Additionally, unlike TREC questions, the questions in CQA are often informal and it is more challenging for parsers to parse their syntactic structures (Wang, Ming, & Chua, 2009). Hence the POS tag and syntactic structure features used in TREC QA will not be distinguishable in topic classification of CQA. We also notice a recent work (Harper, Weinberg, Logie, & Konstan, 2010) that classifies questions in CQA into the types of TREC QA.
5.2 Text Classification
Standard flat classification algorithms (R.-L. Liu, 2010), such as Support Vector Machines, Na¨ıve Bayes, k-Nearest Neighbor(kNN), etc., are evaluated for document classification (Sebastiani, 2002);
Sun et al. (Sun & Lim, 2001) divide the existing work on hierarchical text classification into two categories, the big-bang approach and the top-down approach. In the big-bang approach, a single classifier is trained, and used to assign one or more, internal or leaf categories of the category tree to a test document. The big-bang approach has been developed using Rocchio-like classifier (Labrou & Finin, 1999), association rules-based classifier (Wang & Zhou, 2001), and SVM (Cai & Hofmann, 2004). In our problem where all questions belong to the leaf level, there is almost no difference between the big-bang approach and the traditional flat classifier.
In the top-down approach, one or more flat classifiers are constructed at each level of the category tree in the training phase while in the classification phase each test document is classified from the higher levels to lower ones until it reaches a final category (Sun & Lim, 2001). The top-down level-based approach can be implemented by different strategies (Silla & Freitas, 2011), namely, single path strategy, multi-path strategy, and two stage strategy. Koller and Sahami (Koller & Sahami, 1997) implement the top-down approach with a single path strategy based on multiple Bayesian classifiers. Dumais and Chen (Dumais & Chen, 2000) propose a multi-path method based on SVM.
Liu et al. (T.-Y. Liu et al., 2005) evaluate the performance of flat SVM and multi-path SVM method on a web page set from Yahoo! Directory. As reported in their work, the hierarchical classifier is more effective than the flat one.
Xue et al. (Xue et al., 2008) propose a two stage approach for hierarchical text classification in which the first search stage is to prune the large scale hierarchy to a set of category candidates for each document; the second stage is to train a classification model based on this pruned category tree. Very recently, Bennett and Nguyen (Bennett & Nguyen, 2009) propose another two stage approach as discussed in Section 3.3.
We evaluate the performance of three flat classification methods, and three hierarchical classification methods including the recent approach (Bennett & Nguyen, 2009). As discussed in Introduction, compared with the previ-ous work, we use a much larger dataset as shown in Table 3 and questions in our problem are shorter than normal documents or webpages.
5.3 Query Classification
The 2005 KDD Cup has motivated interests on the topical classification of web queries. The KDD Cup dataset contains only 111 training queries and 800 test queries, and the task is to classify queries into 67 categories. Due to the lack of substantial training data and the sparseness of query features, research efforts focus on enlarging the training data and enriching the feature representation of queries, and different approaches have been proposed. In contrast, we use 3.9M questions for question topic classification and classify questions to more than 1,000 categories. Many proposals on the topical classification of queries aim to enrich the feature representation of queries. The winning solution of 2005 KDD cup (Shen et al., 2006) expands each query by its search engine results to derive fea-tures and builds document classifiers based on a document taxonomy, e.g., Open Directory Project (www.dmoz.org); then classifications in the document taxonomy are mapped to those in the target taxonomy of queries. This solution addresses the feature sparseness problem of short queries by enriching query with features extracted from search engine results; it addresses the problem of lack of training data by building document classifier using other existing taxonomies containing more training data. Beitzel et al. (Beitzel, Jensen, Chowdhury, & Frieder, 2007) employ a larger training data and test data, containing 6,666 and 10,000 queries, respectively, and classify queries into 18 cat-egories. They find that a simple method of using the snippets of the retrieval documents of 6,666 queries to build classifiers performs 40% better than the strategy of bridging the classification results of an external taxonomy to the target taxonomy for the query classification. Broder et al. (Broder et al., 2007) transform the problem of query clas-sification into that of document clasclas-sification. They also enrich the queries with their search engine results without using an external taxonomy for bridging.
Several studies have employed semi-supervised method to enlarge training data. Li et al. (Li, Wang, Shen, & Acero, 2010) propose to exploit user click-through data to increase the amount of training data. Beitzel et al. (Beitzel et al., 2005) propose an approach to mine the vast amount of unlabeled data in web query logs to improve automatic topical web query classification. Human-machine interaction (Schumaker & Chen, 2010) is another approach to address the feature sparseness of short queries. Liu and Lin (R.-L. Liu & Lin, 2003) construct and maintain a profile for each information category, and propose an effective method of interacting with the users in order to map users’ information need expressed by a short query to suitable categories.
5.3.1 Discussion
The existing techniques for query classification are developed for a very different setting from our work. Those techniques would not be practical/useful for the question classification task at a large scale.
Most of research on query classification is motivated by the 2005 KDD Cup. The main challenge there is that queries do not come with labels and need to be manually labeled to create training/test data. The size of the available training data is very small (only 111 training queries). The techniques developed are to address such issues.
The winning solution of 2005 KDD cup and some subsequent research use external document taxonomy con-taining larger number of training data to build classifiers, and then classifications in the external document taxonomy are mapped to those in the target taxonomy of queries. However, lack of training data is not a problem for CQA classification—each QA has a label in CQA services and the size of training data is huge (Yahoo! Answers had 98M
questions as of Aug 2010). We use 3.9M QA data in our experiments. It is reported by Beitzel et al. (Beitzel et al., 2007) that with a larger training data and test data of queries, containing 6,666 and 10,000 queries, respectively, mapping to an external taxonomy does not help.
Furthermore, some studies expand each query with the snippets of the retrieval documents of the query by posing each query to a search engine. This will not be applicable to our problem due to two reasons: 1) questions are much longer than queries and search engine usually cannot return relevant results for questions (It is known that search engines cannot handle long queries well (Bendersky & Croft, 2008)). We tested 10 questions, but most of the top-10 returned snippets appear to be noise, rather than being relevant to questions. For example, for a real Yahoo! answer question “Wat is the best way to talk my mom into letting me get a snake???” Only the webpage from Yahoo! Answer is related (as of Oct 11, 2011). 2) It is too time consuming to process 3M questions using such a method. Moreover, it takes time to pose a user’s question to search engine and then extract the top snippets to suggest the category of a question for the user in CQA services. Such a strategy is impractical for a CQA service. In fact, questions are normally much longer than the Web queries, and thus feature expansion for question would be less necessary.
Additionally, none of existing work on query classification has conducted a systematic evaluation of different classification models on a large amount of training data for query classification.
Finally, we note that other work on CQA includes question search, e.g., (Y. Cao, Duan, Lin, & Yu, 2011; Wang et al., 2009; X. Cao et al., 2009; X. Cao, Cong, Cui, & Jensen, 2010), surveys on CQA services(e.g., (Agichtein, Castillo, Donato, Gionis, & Mishne, 2008; Gazan, 2011)), and CQA integration (Wei, Cong, Li, Ng, & Li, 2011).
6
Conclusion
Question topic classification is a real problem for the CQA services. It is an open problem to study the performance of the state-of-the-art classification methods for question classification (and short text classification). This paper is the first work on question topic classification. We apply a variety of flat classifiers, NB, ME and SVM and combine them with state-of-the-art hierarchical models for question classification. We also study the usefulness of several components of questions in classification and different feature representations. Experiments are conducted on a very large dataset from Yahoo! Answers to evaluate the performance of different classifiers, the usefulness of different features, and the effect of training data size. We have reported some new findings from our experimental study, and they are summarized in Section 4.6. The results reported in this paper could have immediate and practical impact on CQA services and probably other short text classification, such as classifying tweets, which is attracting the attention of research community.
References
Agichtein, E., Castillo, C., Donato, D., Gionis, A., & Mishne, G. (2008). Finding high-quality content in social media. InProceedings of the international conference on web search and web data mining (WSDM) (pp. 183–194). Palo Alto, California, USA: ACM.
Banko, M., & Brill, E. (2001). Scaling to very very large corpora for natural language disambiguation. InProceedings of the 39th annual meeting on association for computational linguistics (ACL)(pp. 26–33). Toulouse, France: Association for Computational Linguistics.
Beitzel, S. M., Jensen, E. C., Chowdhury, A., & Frieder, O. (2007). Varying approaches to topical web query classi-fication. InProceedings of the 30th annual international ACM SIGIR conference on research and development in information retrieval(pp. 783–784). Amsterdam, The Netherlands: ACM.
Beitzel, S. M., Jensen, E. C., Frieder, O., Lewis, D. D., Chowdhury, A., & Kolcz, A. (2005). Improving automatic query classification via semi-supervised learning. InProceedings of the fifth IEEE international conference on data mining (ICDM)(pp. 42–49). Houston, Texas, USA: IEEE Computer Society.
Bendersky, M., & Croft, W. B. (2008). Discovering key concepts in verbose queries. InProceedings of the 31st annual international acm sigir conference on research and development in information retrieval(pp. 491–498). New York, NY, USA: ACM.
Bennett, P. N., & Nguyen, N. (2009). Refined experts: improving classification in large taxonomies. InProceedings of the 32nd international ACM SIGIR conference on research and development in information retrieval (pp. 11–18). Boston, MA, USA: ACM.
Blunsom, P., Kocik, K., & Curran, J. R. (2006). Question classification with log-linear models. InProceedings of the 29th annual international ACM SIGIR conference on research and development in information retrieval (pp. 615–616). Seattle, Washington, USA: ACM.
Broder, A. Z., Fontoura, M., Gabrilovich, E., Joshi, A., Josifovski, V., & Zhang, T. (2007). Robust classification of rare queries using web knowledge. InProceedings of the 30th annual international ACM SIGIR conference on research and development in information retrieval(pp. 231–238). Amsterdam, The Netherlands: ACM. Cai, L., & Hofmann, T. (2004). Hierarchical document categorization with support vector machines. InProceedings
of the thirteenth acm international conference on information and knowledge management (CIKM)(pp. 78–87). Washington, D.C., USA: ACM.
Cao, X., Cong, G., Cui, B., & Jensen, C. S. (2010). A generalized framework of exploring category information for question retrieval in community question answer archives. InProceedings of the 19th international conference on world wide web (WWW)(pp. 201–210). ACM.
Cao, X., Cong, G., Cui, B., Jensen, C. S., & Zhang, C. (2009). The use of categorization information in language mod-els for question retrieval. InProceeding of the 18th acm conference on information and knowledge management (CIKM)(pp. 265–274). Hong Kong, China: ACM.
Cao, Y., Duan, H., Lin, C.-Y., & Yu, Y. (2011, June). Re-ranking question search results by clustering questions.
Journal of the American Society for Information Science and Technology (JASIST),62, 1177–1187.
Cavnar, W. B., & Trenkle, J. M. (1994). N-gram-based text categorization. InProceedings of 3rd annual symposium on document analysis and information retrieval(pp. 161–175). Las Vegas, NV.
Cesa-Bianchi, N., Gentile, C., & Zaniboni, L. (2006). Hierarchical classification: combining bayes with svm. In
Proceedings of the 23rd international conference on machine learning (ICML) (pp. 177–184). Pittsburgh, Pennsylvania: ACM.
Dumais, S., & Chen, H. (2000). Hierarchical classification of web content. In Proceedings of the 23rd annual international ACM SIGIR conference on research and development in information retrieval (pp. 256–263). Athens, Greece: ACM.
Gazan, R. (2011). Social Q&A. Journal of the American Society for Information Science and Technology (JASIST),
62(12), 2301–2312.
Hall, M., Frank, E., Holmes, G., Pfahringer, B., Reutemann, P., & Witten, I. H. (2009). The weka data mining software: an update. SIGKDD Explorations,11(1), 10–18.
Harper, F. M., Weinberg, J., Logie, J., & Konstan, J. A. (2010). Question types in social q&a sites. First Monday,
15(7).
Huang, C., Fu, T., & Chen, H. (2010, May). Text-based video content classification for online video-sharing sites.
Journal of the American Society for Information Science and Technology (JASIST),61, 891–906.
Keerthi, S. S., Sundararajan, S., Chang, K.-W., Hsieh, C.-J., & Lin, C.-J. (2008). A sequential dual method for large scale multi-class linear svms. InProceeding of the 14th ACM SIGKDD international conference on knowledge discovery and data mining(pp. 408–416). Las Vegas, Nevada, USA: ACM.
Koller, D., & Sahami, M. (1997). Hierarchically classifying documents using very few words. InProceedings of the fourteenth international conference on machine learning (ICML)(pp. 170–178). Nashville, Tennessee, USA: Morgan Kaufmann Publishers Inc.
Proceedings of the eighth international conference on information and knowledge management (CIKM) (pp. 180–187). Kansas City, Missouri, United States: ACM.
Li, X., & Roth, D. (2002). Learning question classifiers. InProceedings of the 19th international conference on computational linguistics (COLING) - volume 1 (pp. 1–7). Taipei, Taiwan: Association for Computational Linguistics.
Li, X., Wang, Y.-Y., Shen, D., & Acero, A. (2010, July). Learning with click graph for query intent classification.
ACM Transactions on Information Systems,28, 12:1–12:20.
Lin, J., & Katz, B. (2006, May). Building a reusable test collection for question answering.Journal of the American Society for Information Science and Technology (JASIST),57, 851–861.
Liu, R.-L. (2010). Context-based term frequency assessment for text classification. Journal of the American Society for Information Science and Technology (JASIST),61(2), 300-309.
Liu, R.-L., & Lin, W.-J. (2003, October). Mining for interactive identification of users’ information needs. Informa-tion Systems,28, 815–833.
Liu, T.-Y., Yang, Y., Wan, H., Zeng, H.-J., Chen, Z., & Ma, W.-Y. (2005). Support vector machines classification with a very large-scale taxonomy. SIGKDD Explorations,7(1), 36-43.
Manning, C., & Klein, D. (2003). Optimization, maxent models, and conditional estimation without magic. In Pro-ceedings of the 2003 conference of the north american chapter of the association for computational linguistics on human language technology (NAACL): Tutorials - volume 5(pp. 8–8). Edmonton, Canada: Association for Computational Linguistics.
Mccallum, A., & Nigam, K. (1998). A comparison of event models for naive bayes text classification. InAAAI-98 workshop on learning for text categorization(p. 41-48). Madison, Wisconsin.
Moschitti, A., Quarteroni, S., Basili, R., & Manandhar, S. (2007). Exploiting syntactic and shallow semantic kernels for question answer classification. InProceedings of the 45th annual meeting of the association for computa-tional linguistics (ACL). Prague, Czech Republic: Association for Computational Linguistics.
Schumaker, R. P., & Chen, H. (2010). Interaction analysis of the alice chatterbot: A two-study investigation of dialog and domain questioning. IEEE Transactions on Systems, Man, and Cybernetics, Part A,40(1), 40-51.
Sebastiani, F. (2002). Machine learning in automated text categorization.ACM Computing Survey,34(1), 1-47. Shen, D., Pan, R., Sun, J.-T., Pan, J. J., Wu, K., Yin, J., et al. (2006, July). Query enrichment for web-query
classification. ACM Transactions on Information Systems,24, 320–352.
Silla, C. N., & Freitas, A. A. (2011). A survey of hierarchical classification across different application domains.
Data Mining and Knowledge Discovery,22(1–2), 31–72.
Sun, A., & Lim, E.-P. (2001). Hierarchical text classification and evaluation. In Proceedings of the 2001 ieee international conference on data mining (ICDM)(pp. 521–528). San Jose, California, USA: IEEE Computer Society.
Suzuki, J., Taira, H., Sasaki, Y., & Maeda, E. (2003). Question classification using hdag kernel. InProceedings of the ACL 2003 workshop on multilingual summarization and question answering (MultiSumQA) - volume 12 (pp. 61–68). Sapporo, Japan: Association for Computational Linguistics.
Wang, K., Ming, Z., & Chua, T.-S. (2009). A syntactic tree matching approach to finding similar questions in community-based qa services. InProceedings of the 32nd international ACM SIGIR conference on research and development in information retrieval(pp. 187–194). Boston, MA, USA: ACM.
Wang, K., & Zhou, S. (2001). Hierarchical classification of real life documents. InProceedings of the 1st SIAM international confernence on data mining (SDM). Chicago, IL, USA.
Wei, W., Cong, G., Li, X., Ng, S.-K., & Li, G. (2011). Integrating community question and answer archives. In
Proceedings of the twenty-fifth aaai conference on artificial intelligence (AAAI)(pp. 1255–1260).
Xue, G.-R., Xing, D., Yang, Q., & Yu, Y. (2008). Deep classification in large-scale text hierarchies. InProceedings of the 31st annual international ACM SIGIR conference on research and development in information retrieval
(pp. 619–626). Singapore, Singapore: ACM.
Yang, Y., & Liu, X. (1999). A re-examination of text categorization methods. InProceedings of the 22nd annual inter-national ACM SIGIR conference on research and development in information retrieval(pp. 42–49). Berkeley, California, United States: ACM.
Zhang, D., & Lee, W. S. (2003). Question classification using support vector machines. InProceedings of the 26th annual international ACM SIGIR conference on research and development in informaion retrieval(pp. 26–32). Toronto, Canada: ACM.