1 Variability in seed cone production and functional response of seed predators to 1
seed cone availability: support for the predator satiation hypothesis 2
3
Running head: Predator satiation hypothesis 4
5
Yan B. Linhart1*, Xoaquín Moreira2,3, Marc A. Snyder4 and Kailen A. Mooney2 6
7
1
Department of Ecology and Evolutionary Biology, University of Colorado, Boulder,
8
CO 80309, USA
9
2
Department of Ecology and Evolutionary Biology, University of California, 92697
10
Irvine, California , USA.
11
3
Misión Biológica de Galicia (MBG-CSIC), Apdo. 28, 36080 Pontevedra, Galicia,
12
Spain.
13
4
Department of Biology, Colorado College, Colorado Springs, CO 80903, USA
14 15 16 17 18 19 *
Correspondence author. E-mail: [email protected] 20 21 22 23 24 25 26 27 28 29 30 31 32 33 34 35
2 Summary
36
1. Mast seeding is a reproductive strategy in some perennial plants defined as 37
synchronous production of large seed crops at irregular intervals. One widely accepted 38
theory to explain this behaviour is the predator satiation hypothesis, which states that 39
the synchronous and variable production of seeds within a population will maximize the 40
probability of seed survival through satiation of seed predators. 41
2. Although some short-term studies have documented the influence of variable and 42
synchronized production of seeds on herbivore attack rate during one or few mast years, 43
long-term data including multiple mast seeding years and patterns of cone production 44
and herbivore attack on individual trees are needed to assess (i) how cone production, 45
variability and synchrony affect individual plant fitness and (ii) the functional responses 46
of seed predators to mast seeding events. 47
3. We tested these objectives, collecting long-term (29 years) data on female seed cone 48
production and rates of seed predator attack from 217 individual contiguous trees within 49
a Pinus ponderosa population. 50
4. Our results support the predator satiation hypothesis. Firstly, we found high 51
interannual synchrony and variability in seed cone production and a type II functional 52
response of seed predators to available cones. Secondly, years with high cone 53
production (mast years) had markedly lower rates of seed predator attack than years of 54
low production (i.e. a population-level satiation effect). Thirdly, within mast years, 55
individuals with high cone production had markedly lower rates of attack than 56
individuals with low cone production (i.e. an individual-level satiation effect). Finally, 57
individual trees with greater synchrony and more variable cone production suffered 58
lower rates of attack. 59
3 5. Synthesis: Our long-term data on individual trees lends strong support to the
60
hypothesis that mast seeding in Pinus ponderosahas evolved in response to natural 61
selection from insect seed predators. 62
63
Key-words: insect seed predators, mast seeding, Pinus ponderosa, plant–herbivore 64
interactions, predator satiation,seed cone production, synchrony 65
66
Introduction 67
Mast seeding (also called ‘masting’) is a common reproductive strategy exhibited by 68
some species of perennial plants, and can be defined as the synchronous production of 69
large seed crops at irregular intervals by a population of plants (Janzen 1976; 70
Silvertown 1980; Sork, Bramble & Sexton 1993; Herrera et al. 1998; Koenig & Knops 71
2005; Crone, McIntire & Brodie 2011). The following patterns characterize mast 72
seeding events: high temporal variability and high synchrony in seed production among 73
individuals of a population (Herrera et al. 1998; Koenig & Knops 1998; Ostfeld & 74
Keesing 2000; Koenig et al. 2003; Liebhold, Koenig & Bjørnstad 2004; LaMontagne & 75
Boutin 2007; Koenig & Knops 2013). 76
One of the most widely accepted explanations for the evolution of masting is the 77
predator satiation hypothesis, which postulates that the synchronous and variable 78
production of seeds among conspecifics within a population will increase the likelihood 79
of seed escaping local seed predators through their overabundance (Janzen 1976; 80
Silvertown 1980). Masting may satiate seed predators (and increase seed survival) 81
through at least two complementary mechanisms. First, large fluctuations in seed 82
production may prevent the buildup of seed predator populations between mast seeding 83
events. Second, mast seeding events may increase the resource pool available to 84
4 predators sufficiently to exceed their ability to consume those resources. Some short-85
term studies have documented the role of variable and synchronized production of seeds 86
on herbivore attack rate during one or few mast years (e.g. Archibald et al. 2012). 87
However in order to better understand how masting evolves, we need to (i) assess how 88
total cone production, variability, and synchrony affect individual plant fitness, (ii) 89
examine patterns of cone production over long-term spans that include several mast- 90
and non-mast years, and then (iii) determine how those patterns influence attacks by 91
seed predators. 92
Determining a seed predator’s functional responses, and how these are related to 93
mast seeding, is crucial to testing the predictions of the predator satiation hypothesis, 94
and understanding its evolution (Koenig et al. 2003; Fletcher et al. 2010). Predator 95
satiation requires negative density dependence across some portion of the range of 96
naturally occurring resource densities (Holling 1965). The functional response of a seed 97
predator depends on the size, mobility, and diet breadth of the predators (Koenig et al.
98
2003; Klinger & Rejmánek 2009). For example, an individual tree would have a higher 99
probability of escaping mobile generalist seed predators (e.g. squirrels, mice, birds) in a 100
mast event if its cones mature synchronously with those of other trees within these 101
predators’ typically large territories. Therefore, mobile predators should select for 102
increased among-population variation and synchrony (Koenig et al. 2003). In contrast, 103
less mobile specialist seed predators (e.g. insects) may be satiated by individuals or 104
smaller groups of trees, and might select for increased variation in individual 105
reproduction without selecting for large scale synchrony (Koenig et al. 2003). 106
Consequently, characteristics of the seed predator community are likely to play a central 107
role in determining whether masting is advantageous, and at which spatial scales. 108
5 A central assumption of the predator satiation hypothesis is that superabundant 109
seed production in mast years reduces proportional seed consumption by predators 110
(satiation effect), thus increasing the proportion of seeds surviving (Koenig et al. 2003; 111
Fletcher et al. 2010). However, the proportion of seeds consumed by predators may also 112
be reduced at low seed densities if, for example, seed predators turn to more abundant 113
food sources (prey-switching behaviour, e.g. Ims 1990). These opposing dynamics 114
highlight the importance of determining the form of the functional response of predators 115
to seed availability, so as to fully test the predictions of the predator satiation hypothesis 116
(Ruscoe et al. 2005; Fletcher et al. 2010). Despite the potential to provide mechanistic 117
explanations of predator satiation, the functional responses of seed predators to mast 118
seeding events have been poorly examined (but see Ruscoe et al. 2005; Fletcher et al.
119
2010). 120
The aims of the present study were threefold. Firstly, we evaluated the variation 121
and synchrony in seed cone production within a ponderosa pine (Pinus ponderosa var. 122
scopulorum) population in relation to the proportion of insect-damaged cones.
123
Secondly, we examined the functional response of specialist insect seed predators to 124
mast and non-mast seeding events in the same pine population. Thirdly, we assessed 125
these dynamics both at the population level, and in terms of individual trees, thus 126
allowing inferences about possible evolutionary responses. To test these objectives we 127
collected long-term (29 years) data on seed cone production, classified as healthy and 128
insect-damaged cones, and calculated synchrony and variability in 217 trees. Taken 129
together, these objectives provide a more complete understanding of masting behaviour 130
in pines and its fitness consequences with respect to interactions with seed predators. 131
132
Materials and methods 133
6 PINE SPECIES, STUDY AREA AND DATA COLLECTION
134
Ponderosa pine is a native conifer in western North America where it is one of the most 135
widely distributed pine species, especially at higher elevations (Richardson 1998). 136
Ponderosa pine is monoecious, i.e. male and female cones occur on the same tree, which 137
reproduces via seeds. The female cones usually require two growing seasons to mature 138
after pollination and reach their full size by mid-summer. The cones usually open to 139
release the seeds several months later in the fall. The seeds are small and winged, 140
anemophilous (wind-dispersed) and rich in nutrients, which serve as food source for 141
many animals. As in other pines, episodic mast seeding events are common in 142
ponderosa pine populations (e.g. Linhart & Mitton 1985; Mooney, Linhart & Snyder 143
2011). 144
We carried out a long-term field study (from 1979 to 2008, except in 2004) 145
monitoring a population of 217 ponderosa pine individuals distributed over a 2 ha area 146
on the south-facing slope of Boulder Canyon at an elevation of 1740 m in the Front 147
Range of the Rocky Mountains (near the town of Boulder, Colorado, 40° 00' 48"N, 105° 148
18' 12"W). The stand was open and park-like, typical of ponderosa pine forests in this 149
xeric, continental setting. Ages of studied trees ranged from about 40 to over 280 years, 150
and were estimated from cores taken at 30-50 cm above-ground. There was no evidence 151
of logging or other disturbance at this site. 152
We recorded total cone production each year (between July and October) by 153
counting total individual seed cones throughout the crowns of all trees. Seed cones were 154
recorded separately as cones with no signs of predator activity (healthy cones, hereafter) 155
and cones with external evidence of insect damage (attacked or aborted cones, 156
hereafter). In this population, the cone-feeding insects include the cone weevil 157
Conotrachelus neomexicanus Fall (Coleoptera: Curculionidae), the cone moths
7
Dioryctria spp. (Lepidoptera: Pyralidae) and Eucosma spp. (Lepidoptera: Tortricidae) 159
(Bodenham & Stevens 1981; Keefover-Ring & Linhart 2010). Adults of these species 160
oviposit on green second-year cones in spring and early summer, and their larvae mine 161
the interior, indiscriminately devouring scales and seeds (Furniss & Carolin 1980; 162
Hedlin et al. 1981; Cibrian-Tovar et al. 1986). This feeding destroys all of the seeds in a 163
cone, and the damaged cones never open (Plate 1; Linhart personal observation; 164
Bodenham et al. 1976; Schmid et al. 1986; Pasek & Dix 1988; Blake et al. 1989). Such 165
infested cones quickly die, turn reddish to dark brown, and appear stunted or deformed 166
(Plate 1). To identify the insects responsible for this damage, we dissected cones and 167
identified insects in situ. This was done repeatedly over the years. During one three-year 168
sampling (1988, 1989, 1998), we dissected 715 cones at this site, and another 766 at 169
nearby sites to familiarize ourselves with sources of cone damage (Keefover-Ring & 170
Linhart 2010). Prior to those years and periodically afterwards, we sampled 20-30 cones 171
haphazardly throughout the population to see if other insects might be responsible, and 172
to verify that shrunken cones contained no viable seeds. Given that the damaged cones 173
produced no viable seeds we also refer to these attacked cones as aborted cones. When 174
counting cones we were able to classify them as either viable or aborted 175
unambiguously. Early in the summer, viable cones were green, while aborted cones 176
were brown, smaller, and often distorted and covered with resin. Later in summer and 177
early fall, healthy cones opened to release the seeds, while aborted cones stayed closed 178
(Plate 1). In this population, trees are short enough and the stand density is open enough 179
that accurate counts of cones were easy to obtain. In order to ensure the continuity and 180
consistency of data collection, one or more of the authors was present for all counts. 181
182
DATA ANALYSIS 183
8
Descriptive statistics
184
Mast seeding years are qualitatively defined as being those years when a heavy seed 185
crop is produced (e.g. Silvertown 1980; Norton & Kelly 1988; Kelly 1994). As in past 186
studies, we defined mast seeding as those years when seed production exceeds the mean 187
by a designated amount, measured in standard deviations (LaMontagne & Boutin 2007; 188
LaMontagne & Boutin 2009). Specifically, we calculated the population deviation from 189
the long-term mean in standard deviations for each year as SDi = (Xi – Xp) / (SDp), 190
where the SDi and Xi are the standard deviation and mean for year i, and Xp and SDp are 191
the standard deviation and mean for the population across all 29 years. ‘Mast years’ 192
were then defined to be those where SDi ≥ 0.93, while ‘non-mast years’ were defined as 193
those where SD i < 0.93. This classification resulted in 6 mast years, 19 non-mast years, 194
and 4 intermediate years (Figure S1). A threshold of 0.93 was selected in favor of 1.0 195
(used by LaMontagne & Boutin 2007) as this resulted in the inclusion of 2005 as a mast 196
year, a year that was much closer in rates of cone production to the five other mast years 197
than to the non-mast years (Figure S1). However, all of our findings are qualitatively 198
identical if a threshold of 1.0 is used (results not shown). 199
To assess synchrony and variability in reproduction and the proportion of attacked 200
cones, we calculated the following population-level metrics: (i) annual variation in total 201
seed cone production by the population (CVp), calculated as the coefficient of variation 202
for total population cone production over 29 years (LaMontagne & Boutin 2007; 203
Mooney, Linhart & Snyder 2011); (ii) total cone production for each year Tp, calculated 204
as the total number of cones produced each year across all trees (n = 29); (iii) the 205
proportion of seed cones attacked in the population each year (Pp), calculated as the 206
mean proportion of attacked cones across all trees for each year (n = 29). We in turn 207
calculated a set of parallel statistics for each individual tree (n = 217): (i) total cone 208
9 production for each tree Ti, calculated as the total number of cones produced across all 209
years; (ii) individual variability CVi,calculated as the coefficient of variation across 29 210
years for each individual tree (Herrera 1998); (iii) individual synchrony ri, calculated as 211
the Pearson’s correlation coefficients for seed cone production between each tree and 212
total cone production for all other trees across years (Crone, McIntire & Brodie 2011; 213
Mooney, Linhart & Snyder 2011); and finally (iv) individual proportion of seed cones 214
attacked over 29 years Pi, calculated as total attacked cones divided by total cone 215
production over 29 years. 216
217
Functional response: Population- and individual-level tests
218
Holling (1959) reported three general forms of predator functional responses to prey 219
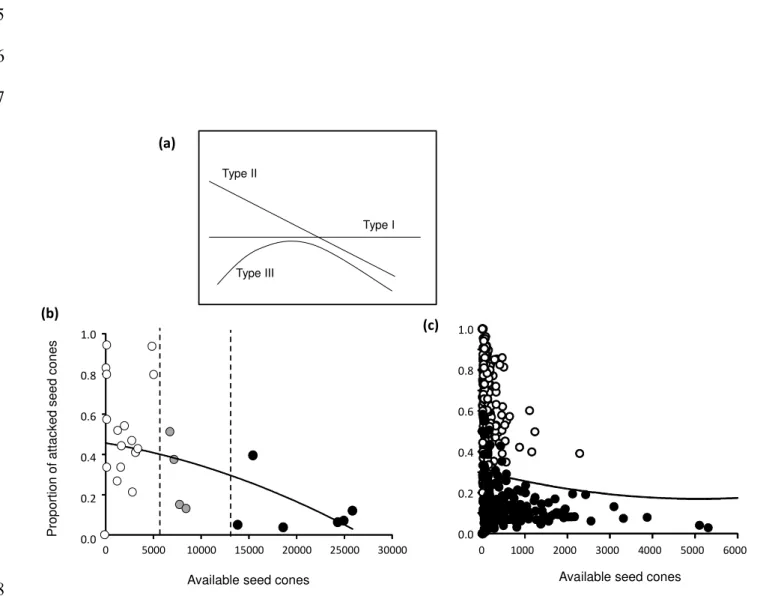
density which we can translate to seed consumption by predators (Figure 1a): (i) Type I 220
responses, where the proportion of consumed seeds remains constant, independently of 221
the level of seed availability; this does not support the predator satiation hypothesis; (ii) 222
Type II responses, where the proportion of seed consumed by predators is highest at low 223
levels of seed availability; and (iii) Type III responses, where the proportion of seed 224
consumed by predators is highest at some intermediate level of seed availability and 225
then declines towards zero. Type II and III functional responses both support the 226
predator satiation hypothesis because the proportion of seed consumed by predators 227
decreases with increasing seed availability across at least some range of seed density. 228
Distinctions among type I, II and III functional responses are best tested with a 229
statistical model in which the proportion of resource consumed is modeled as dependent 230
upon the linear and quadratic effects of resource availability using the logistic 231
regression (Trexler, McCulloch & Travis 1988; Juliano 2001; Fletcher et al. 2010). 232
Because the distribution of seed cone production among trees was extremely skewed, 233
10 we used the log10 (x+1)-transformed number of seed cones as the independent variable. 234
Type I functional responses were identified based on non-significant linear and 235
quadratic coefficients of available cones; type II responses were identified by a negative 236
linear coefficient of available cones, and type III responses were identified by positive 237
linear and negative quadratic coefficients of available cones (Trexler, McCulloch & 238
Travis 1988; Juliano 2001; Fletcher et al. 2010). 239
First, we calculated the functional response at the population-level, regressing the 240
proportion of attacked seed cones for the population each year (Pp, dependent variable) 241
onto total cone production for each year (Tp, independent variable). Second, we 242
determined the form of the functional response at the individual level across both mast- 243
and non-mast years. Here we regressed the proportion of attacked seed cones for each 244
tree (Pi, dependent variable) onto total cone production for that tree (Ti, independent 245
variable), where each tree was represented twice with values of Pi and Ti taken 246
separately from mast (Pi-mast, Ti-mast) and non-mast years (Pi-non-mast, Ti-non-mast), and 247
including individual tree as a fixed effect. This approach thus tests for the individual 248
level benefit of masting across the full range of cone production (Fletcher et al. 2010). 249
Finally, we tested whether variation in cone production among trees influences cone 250
attack within mast years (n = 6), regressing individual proportion of seed cones attacked 251
over all mast years (Pi-mast,dependent variable) onto total cone production for each tree 252
over all mast years (Ti-mast, independent variable). A parallel analysis within non-mast 253
years (based upon Pi-non-mast and Ti-non-mast) was not possible because the range of cone 254
production among trees was too low to accurately assess seed predator functional 255
response. 256
257
Associations among individual-level descriptors
11 To test the predictions of the predator satiation hypothesis, i.e. that high variability and 259
synchrony maximize the probability of seed escape, we used multiple logistic 260
regressions to test the effects of (a) individual synchrony in seed production (ri), (b) the 261
variation at the individual-level in seed cone production (CVi), and (c) the total cone 262
production for each tree (Ti) upon the individual proportion of attacked seed cones (Pi). 263
264
Relative effects of individual vs. site-wide cone production
265
If large seed crops reduce rates of seed predator attack on individual trees, such effects 266
are likely driven by both seed cone abundance within the individual’s canopy, as well as 267
seed cone abundance within the canopies of all other trees. To assess the relative 268
contributions of these two factors, we used multiple logistic regression. In this analysis, 269
the proportion of cones attacked on a single tree within a single year was regressed onto 270
both the total cone production for that tree within that year, as well as the mean number 271
of cones produced by all other trees within the population for that year, with individual 272
tree included as a fixed effect. With this approach, the partial regression coefficients 273
quantify the relative influences of variation in individual vs. population-wide cone 274
production for the rate of seed predator attack. 275
276
Results 277
Contributions to total seed cone production
278
A total of 183,015 cones were produced at the site over the 29 years of study for a site-279
wide average of 6,100 ± 1,464 cones per year (mean ± SE). Cone production varied 280
extensively among the 217 trees, ranging from 29 year totals of 0 to 25,842 total cones 281
produced. Across all 29 years, the 27 most productive trees (12% of trees) produced 282
50% of all cones, while the 29 least productive trees (13% of trees) only contributed 283
12 0.16% of all cones. Site-wide cone production varied extensively among the 29 years, 284
ranging from 0 in non-mast years to 26,040 seed cones in one mast year (Figure 2). The 285
contribution of individual years to this 29-year site-wide total was highly skewed 286
because 76% of cones were produced during six mast years (Figure 2) while the 10 least 287
productive years accounted for less than 5% of total cone production. A total of 39,339 288
cones were aborted and produced no viable seeds because of attacks by weevils and 289
moths over 29 years, with the site-wide proportion of aborted cones per year ranging 290
from 0.038 to 0.953 (Figure 2). In accordance with the predator satiation hypothesis, the 291
proportion of attacked cones at the site was significantly lower in mast years (mean = 292
0.123 ± 0.116) than in non-mast years (mean = 0.444 ± 0.063) (F1,24 = 5.90; P = 0.023). 293
294
Variability and synchrony in seed cone production
295
Seed cone production was variable among years at both the population and individual 296
level, and reproduction among trees was highly correlated. The coefficient of variation 297
at the individual level (CVi) ranged from 1.13 to 5.48 (mean = 2.01 ± 0.05) while the 298
coefficient of variation at the population level (CVp) was 1.26. The synchrony in seed 299
cone production at the individual level, (i.e., ri ) involved all pairwise Pearson’s 300
correlation coefficients for seed cone production between each tree and total cone 301
production for all other trees across years, and ranged from -0.09 to 0.96 (mean = 0.73 ± 302
0.01). 303
304
Determining the form of functional response of seed predators
305
The functional response of seed predators at the population level (n = 29 years) was a 306
type II response, as demonstrated by the negative and significant linear coefficient of 307
untransformed and log10-transformed available cones (Table 1a). The proportion of 308
13 attacked seed cones strongly decreased as available seed cones increased, that is, the 309
maximum proportions of aborted cones occurred at low levels of available cones (Fig. 310
1b). The functional response of seed predators at the individual level (n = 217 individual 311
trees) across both mast- and non-mast years was also a type II response, as 312
demonstrated by the negative and significant linear coefficient of untransformed and 313
log10-transformed available cones (Table 1b). The functional response of seed predators 314
at the individual level (n = 217 individual trees) in mast years was also a type II, based 315
on the negative and significant linear coefficient of untransformed and log10-316
transformed available cones (Table 1c). Again, the proportion of attacked seed cones 317
strongly decreased as available seed cones increased (solid dots in Fig. 1c). These 318
results indicate that individual trees benefit from masting across the full range of cone 319
production (Fletcher et al. 2010). 320
321
Associations among individual-level descriptors
322
Based upon the type II functional response of seed predators, we used a logistic multiple 323
regression to assess how the proportion of attacked seed cones for individual trees (Pi) 324
was influenced by individual variation in total cone production (Ti), interannual 325
variability in seed cone production (CVi) and synchrony with other trees in the 326
population (ri) (Table 2). Pi was negatively associated with CVi, ri, and Ti (Table 2). So, 327
in accordance with the predictions of the predator satiation hypothesis, trees that 328
produced more cones (Ti), were more synchronized with neighbors (ri), were more 329
variable (CVi), and suffered lower levels cone attack. 330
331
Relative effects of individual vs. site-wide cone production
14 Both seed cone abundance within an individual canopy and seed cone abundance within 333
the canopies of neighboring trees significantly reduced seed predator attack to 334
individual trees (Table 3). Based on a comparison of these parameter estimates, a tree 335
increasing cone production by one cone reduced its own seed predator attack by an 336
order of magnitude more than the reduction in attack that occurred when all other trees 337
in the population each increased cone production by one cone. 338
339
Discussion 340
Three noteworthy results from our field 29-year-study provide strong support for the 341
hypothesis that predator satiation can influence the evolution of masting. Firstly, we 342
found high interannual variability and synchrony in seed cone production at individual 343
and population levels, and a type II functional response of seed predators to available 344
cones; these patterns are all predicted by the postulates of masting behaviour and 345
predator satiation. Secondly, we found that years with high cone production (defined as 346
mast years) have markedly lower proportions of seed cones aborted due to insect 347
predators than years of low production (satiation effect). Thirdly, we found that the 348
proportion of attacked seed cones decreased as total cone production, variability, and 349
synchrony in seed cone production at the individual level increased, thus providing the 350
opportunity for natural selection to shape patterns of reproduction. 351
The defining feature of masting patterns is the intermittent and synchronous 352
production of large seed crops (Silvertown 1980; Koenig & Knops 2000; Kelly & Sork 353
2002; Koenig et al. 2003). We found just such a pattern, which includes high 354
interannual variability in seed cone production at both the population (CVp = 1.26) and 355
individual level (mean CVi = 2.01). Plant species exhibiting mast seeding behaviour 356
have been commonly identified as those in which the coefficient of variation of year-to-357
15 year seed cone production is greater than 1.0 (Silvertown 1980; LaMontagne & Boutin 358
2009), but for plant species that exhibit “true” masting could even exceed 2.0 (sensu 359
Kelly 1994). We also found high interannual synchrony in seed cone production within 360
our ponderosa pine population, with a mean correlation of 0.73. These levels of within-361
population synchrony are even higher than values observed in previous studies with 362
ponderosa pine and other tree species, which typically range from 0.35 (Mooney, 363
Linhart & Snyder 2011) to 0.5, (Liebhold et al. 2004) and 0.6 (LaMontagne & Boutin 364
2007). Both results clearly indicate that masting and synchrony were at work in this 365
population. 366
Plant species exhibiting masting behaviour have several fitness advantages. Those 367
for which there is strongest evidence include increased pollination success (Smith, 368
Hamrick & Kramer 1990), increased probability of seed dispersal (Norton & Kelly 369
1988) and reduced seed predation (Kelly & Sullivan 1997; Kon et al. 2005; Fletcher et
370
al. 2010). However, disadvantages have also been associated with masting, including 371
depletion of stored nutrients (Sala et al. 2012). Here we provide two strong forms of 372
evidence that, in this ponderosa pine population, predator escape is an important factor 373
favoring the evolution of masting behaviour. Firstly, we found that predator satiation is 374
at work: seed predation was dramatically reduced in the most productive years (25,842 375
produced cones and 12% attacked in 1984; 24,936 produced cones and 7% attacked in 376
2001; 24,291 produced cones and 6% attacked in 2006) as compared to non-masting 377
years, when seed predation ranged from 50 to 90 % in 9 of the years recorded (Fig. 2). 378
Secondly, these mast-seeding years usually followed several inter-mast years of very 379
low or no seed cone production (up to 12 years between 1984-1997; Fig. 2), with the 380
exception of two consecutive mast years in 2005 and 2006 (Fig. 2). 381
16 Predictions of the predator satiation hypothesis assume that synchronous and 382
variable seed production will satiate seed predators and therefore increase the 383
probability of seed escape, but the size, mobility, and degree of specialization of 384
predators may influence these predictions to a great extent (Koenig et al. 2003). In this 385
study, we tested the predictions of the predator satiation hypothesis by relating the 386
variability and synchrony in seed cone production at the individual level against the 387
proportion of seed cones attacked by insect predators. Our results showed that high 388
variability and synchrony at the individual level drastically reduced the probability of 389
predation, as would be expected given the relatively localized movement/foraging of the 390
insect seed predators in this population (Bodenham & Stevens 1981), and for satiation 391
within individual trees. If seed predators were not movement-limited, variation in cones 392
among individuals within mast years would not affect rates of attack (i.e. a cone would 393
be a cone, whether it was on one tree or another). The idea of satiation at small scale 394
(e.g. within individual trees) provides further support for the relatively localized scale of 395
synchrony among populations observed in our previous study of seven ponderosa pine 396
populations in Boulder County (Colorado), including the one studied here (Mooney, 397
Linhart & Snyder 2011). All these populations are attacked by the same suite of insects 398
(Conotrachelus neomexicanus, Conophthorus ponderosae, Dioryctria spp. and 399
Eucosma spp.) which are known to restrict their movements to one or a few adjacent
400
trees (Bodenham & Stevens 1981; Keefover-Ring & Linhart 2010). If the spatial scale 401
of seed predator movement was larger than the spatial scale of reproductive synchrony, 402
then seed predators might recruit to locally abundant seeds, reducing or eliminating the 403
benefit of masting behaviour as a reproductive strategy for predator satiation (Curran & 404
Leighton 2000; Ostfeld & Keesing 2000). Supporting our results, some previous authors 405
also found that individual trees are able to satiate relatively immobile specialist 406
17 predators (i.e. weevils and small moths), and in these cases selection acts to increase 407
individual variability in seed production. For example, Janzen (1978) observed this for 408
Cassia grandis and its insect seed predators and Nilsson & Wästljung (1987) for Fagus
409
sylvatica and the beech moth (Cydia fagiglandana, Tortricidae). Despite the possible 410
benefits of satiation within individual trees, the benefits of synchrony and satiation at 411
larger spatial scale can be seen in the fact that predator attack during non-mast years 412
was higher even when controlling for total cones produced by the individual (Fig. 1c). 413
The proportion of seed cones aborted because of insect predators decreased 414
strongly with increasing seed cone availability in our population (Fig. 1). The functional 415
response of seed predators to different densities of seeds (consumed vs. available seeds) 416
has been widely studied during the last 60 years (Solomon 1949; Holling 1959, 1965; 417
Fletcher et al. 2010), but empirical studies determining the form of the functional 418
responses of seed predators across low and high levels of seed cone production in 419
natural plant populations are still rare (but see Ruscoe et al. 2005; Fletcher et al. 2010). 420
Evaluating the form of the functional response is crucial to examine the predictions of 421
the predator satiation hypothesis. Here we found a type II functional response of insect 422
seed predators to available seed cones. Type II responses are satiating functional 423
responses because the proportion of predated seeds decreases at high levels of available 424
seeds and this behavioural response is typical of relatively immobile specialist predators 425
(e.g. insects) that specialize on one or a few resources (Holling 1959, 1965). In a 426
previous study with a natural population of white spruce, Fletcher et al. (2010) also 427
detected a satiating type II functional response of red squirrels to available seed cones 428
across the entire study years (one mast and three non-mast seeding years). However, 429
these authors detected a satiating type III functional response when analyses were 430
restricted to the three non-mast seeding years (Fletcher et al. 2010). Type III functional 431
18 responses are commonly typical of mobile generalist predators (e.g. squirrels, mice, 432
birds) which readily switch from one resource to another (Holling 1959, 1965). 433
The evolutionary dynamics of mast seeding in trees are difficult to detect, given 434
the long life spans of the plants involved. However, we provide evidence that the type II 435
functional response of predators we observe might select for masting behaviour in our 436
pine population. Specifically, we found high individual variation in synchrony and 437
variability, and this variation was in turn associated with the proportion of cones 438
damaged, and therefore individual fitness. In addition, we showed in a previous study of 439
this population that the 50 most fertile trees (highest total cone production) are 440
significantly different genetically at 3 electrophoretic loci from the 50 least fertile trees 441
(Linhart & Mitton 1985). Fertility is in turn positively correlated with both variability 442
and synchrony in cone production (Table 2), suggesting a genetic basis to these traits 443
and thus the possibility for selection. These differences are between members of two 444
groups that grow intermixed on a site of uniform slope, exposure, and soils within a 445
small area (2 ha), so the genetic differences detected among those trees are not due to 446
differences in physical conditions of their habitat such as soils, exposure or competition. 447
Other studies also provide convincing evidence that individual trees benefit in various 448
ways from being highly synchronous with their neighbors, and in these studies, it is 449
either known or inferred that trees which are the most fertile also differ genetically from 450
other members of the population (e.g. Wolgast 1978; Koenig et al. 1994; Visser et al.
451
2011; Archibald et al. 2012). This combination of results indicates that differential 452
reproduction has a significant heritable basis and is therefore amenable to natural 453
selection in forest trees. 454
In summary, we provide strong support for the predictions of the predator satiation 455
hypothesis in a long-term field study. In keeping with past studies, we show how the 456
19 proportion of seed cones that escaped insect seed predators was much greater in mast 457
years. We in turn provide mechanistic detail to the dynamics underlying this pattern; we 458
show how insect seed predator attack follows a type II functional response, and that 459
variation among individual trees in year-to-year fertility, variability and synchrony of 460
seed cone production is associated with increased fitness. These results provide strong 461
evidence that the evolution of mast seeding and predator satiation strategies of 462
ponderosa pine have been influenced, at least in part, by insect predator activity. 463
. 464
Acknowledgements 465
We gratefully acknowledge the more than 60 individuals who have participated in 466
collecting data in the field. This research was supported by National Foundation Science 467
grants BMS 75-14050, DEB 78-16798, BSR 8918478, and BSR 912065. XM received 468
financial support from Postdoctoral Fulbright/Ministry of Education grant program. 469
470
References 471
Archibald, D.W., McAdam, A.G., Boutin, S., Fletcher, Q.E. & Humphries, M.M. 472
(2012) Within-season synchrony of a masting conifer enhances seed escape. The
473
American Naturalist, 179, 536-544.
474
Blake, E.A., Wagner, M.R. & Koerber, T.W. (1989) Relative effect of seed and cone 475
insects on ponderosa pine in northern Arizona. Journal of Economic
476
Entomology, 82, 1691–1694.
477
Bodenham, J., Stevens, R.E. & Tatcher, T.O. (1976) A cone weevil, Conotrachelus
478
neomexicanus, on ponderosa pine in Colorado: life history, habitats, and 479
ecological relationships (Coleoptera: Curculionidade). Canadian Entomologist,
480
108, 693-699. 481
20 Bodenham, J. & Stevens, R.E. (1981) Insects associated with second-year ponderosa 482
pine cones, Larimer and Boulder Counties, Colorado. Southwestern Naturalist,
483
26, 375-378. 484
Cibrian-Tovar, D.B., Hebel, B.H. Yates, H.O. & Mendez-Montiel (1986) Leptoglossus
485
occidentalis Heidemann. Cone and seed insects of the Mexican conifers (eds 486
D.B. Cibrian-Tovar, B.H. Hebel, H.O. Yates & J.T. Mendez-Montiel), pp. 55– 487
58. USDA Forest Science, Southeastern Forest Experiment Station, Ashville. 488
Crone, E.E., McIntire, E.J.B. & Brodie, J. (2011) What defines mast seeding? Spatio-489
temporal patterns of cone production by whitebark pine. Journal of Ecology, 99, 490
438-444. 491
Curran, L.M. & Leighton, M. (2000) Vertebrate responses to spatiotemporal variation in 492
seed production of mast-fruiting Dipterocarpaceae. Ecological Monographs, 70, 493
101-128. 494
Fletcher, Q.E., Boutin, S., Lane, J.E., LaMontagne, J.M., McAdam, A.G., Krebs, C.J. & 495
Humphries, M.M. (2010) The functional response of a hoarding seed predator to 496
mast seeding. Ecology, 91, 2673-2683. 497
Furniss, R.L. & Carolin, V.M. (1980) Western fore st insects. U.S. Department of
498
Agriculture Forest Service Miscellaneous Publication 1339, 654 pp.
499
Hedlin, A.F., Yates III, H.O., Cibrián-Tovar, D., Ebel, B.H., Koerber, T.W. & Merkel, 500
E.P. (1981) Cone and seed insects of North American conifers. Canadian 501
Forestry Service, U.S. Forest Service, Secretaria de Agricultura y Recursos 502
Hidraulicos, Mexico. 122 p. 503
Herrera, C.M. (1998) Population -level estimates of interannual variability in seed 504
production: what do they actually tell us? Oikos, 82, 612-616. 505
21 Herrera, C.M., Jordano, P., Guitián, J. & Traveset, A. (1998) Annual variability in seed 506
production by woody plants and the masting concept: reassessment of principles 507
and relationship to pollination and seed dispersal. The American Naturalist, 152, 508
576-594. 509
Holling, C.S. (1959) The components of predation as revealed by a study of small 510
mammal predation of the European pine sawfly. Canadian Entomologist, 91, 511
293-320. 512
Holling, C.S. (1965) The functional response of predators to prey density and its role in 513
mimicry and population regulation. Memoirs of the Entomological Society of
514
Canada, 48, 3-86. 515
Ims, R.A. (1990) On the adaptive value of reproductive synchrony as a predator-516
swamping strategy. The American Naturalist, 136, 485-498. 517
Janzen, D.H. (1976) Why bamboos wait so long to flower. Annual Review of Ecology
518
and Systematics, 7, 347-391. 519
Janzen, D.H. (1978) Seeding patterns in tropical trees. Tropical trees as living systems
520
(eds P.B. Tomlinson & M.H. Zimmermann), pp. 83-128.Cambridge University 521
Press. 522
Juliano, S.A. (2001) Non-linear curve fitting: predation and functional response curves. 523
Design and analysis of ecological experiments (eds S.M. Scheiner & J. 524
Gurevitch), pp. 178-196.Oxford University Press, New York. 525
Keefover-Ring, K. & Linhart, Y.B. (2010) Variable chemistry and herbivory of 526
ponderosa pine cones. International Journal of Plant Sciences, 171, 293-302. 527
Kelly, D. (1994) The evolutionary ecology of mast seeding. Trends in Ecology and
528
Evolution, 9, 465-470. 529
22 Kelly, D. & Sork, V.L. (2002) Mast seeding in perennial plants: why, how, where? . 530
Annual Review of Ecology and Systematics, 33, 427-447.
531
Kelly, D. & Sullivan, J.J. (1997) Quantifying the benefits of mast seeding on predator 532
satiation and wind pollination in Chionochloa pallens (Poaceae). Oikos, 78, 143-533
150. 534
Klinger, R. & Rejmánek, M. (2009) The numerical and functional responses of a 535
granivorous rodent and the fate of Neotropical tree seeds. Ecology, 90, 1549-536
1563. 537
Koenig, W.D., Kelly, D., Sork, V.L., Duncan, R.P., Elkinton, J.S., Peltonen, M.S. & 538
Westfall, R.D. (2003) Dissecting components of population-level variation in 539
seed production and the evolution of masting behavior. Oikos, 102, 581-591. 540
Koenig, W.D. & Knops, J.M.H. (1998) Scale of mast-seeding and tree-ring growth. 541
Nature, 396, 225-226. 542
Koenig, W.D. & Knops, J.M.H. (2000) Patterns of annual seed production by Northern 543
Hemisphere trees: a global perspective. The American Naturalist, 155, 59-69. 544
Koenig, W.D. & Knops, J.M.H. (2005) The mystery of masting in trees. American
545
Scientist, 93, 340-347. 546
Koenig, W.D. & Knops, J.M.H. (2013) Large scale spatial synchrony and cross-547
synchrony in acorn production by two California oaks. Ecology, 94, 83-93. 548
Koenig, W.D., Mumme, R.L., Carmen, W.J. & Stanback, M.T. (1994) Acorn 549
production by oaks in central coastal California: variation within and among 550
years. Ecology, 75. 551
Kon, H., Noda, T., Terazawa, K., Koyama, H. & Yasaka, M. (2005) Evolutionary 552
advantages of mast seeding in Fagus crenata. Journal of Ecology, 93, 1148-553
1155. 554
23 LaMontagne, J.M. & Boutin, S. (2007) Local-scale synchrony and variability in mast 555
seed production patterns of Picea glauca. Journal of Ecology, 95, 991-1000. 556
LaMontagne, J.M. & Boutin, S. (2009) Quantitative methods for defining mast-seeding 557
years across species and studies. Journal of Vegetation Science, 20, 745-753. 558
Liebhold, A., Koenig, W.D. & Bjørnstad, O.N. (2004) Spatial synchrony in population 559
dynamics. Annual Review of Ecology, Evolution, and Systematics, 35, 467-490. 560
Liebhold, A.M., Sork, V., Peltonen, M., Koenig, W., Bjørnstad, O.N., Westfall, R., 561
Elkinton, J. & Knops, J.M.H. (2004) Within-population spatial synchrony in 562
mast seeding of North American oaks. Oikos, 104, 156-164. 563
Linhart, Y.B. & Mitton, J.B. (1985) Relationships among reproduction, growth rates, 564
and protein heterozygosity in ponderosa pine. American Journal of Botany, 72, 565
181-184. 566
Mooney, K.A., Linhart, Y.B. & Snyder, M.A. (2011) Masting in ponderosa pine: 567
comparisons of pollen and seed over space and time. Oecologia, 165, 651-661. 568
Nilsson, S.G. & Wästljung, U. (1987) Seed predation and cross-pollination in mast-569
seeding beech (Fagus sylvatica) patches. Ecology, 68, 260-265. 570
Norton, D.A. & Kelly, D. (1988) Mast seeding over 33 years by Dacrydium
571
cupressinum Lamb. (rimu) (Podocarpaceae) in New Zealand: the importance of
572
economies of scale. Functional Ecology, 2, 399-408. 573
Ostfeld, R.S. & Keesing, F. (2000) Pulsed resources and community dynamics of 574
consumers in terrestrial ecosystems. Trends in Ecology and Evolution, 15, 232-575
237. 576
Pasek, J.E. & Dix, M.E. (1988) Insect damage to conelets. second-year cones, and seeds 577
of ponderosa pine in Southeastern Nebraska. Journal of Economic Entomology, 578
81, 1681-1690. 579
24 Richardson, D.M. (1998) Ecology and biogeography of Pinus. Cambridge University 580
Press, Cambridge. 581
Ruscoe, W.A., Elkinton, J.S., Choquenot, D. & Allen, R.B. (2005) Predation of beech 582
seed by mice: effects of numerical and functional responses. Journal of Animal
583
Ecology, 74, 1005-1019.
584
Sala, A., Hopping, K., McIntire, E.J.B., Delzon, S. & Crone, E.E. (2012) Masting in 585
whitebark pine (Pinus albicaulis) depletes stored nutrients. New Phytologist,
586
196, 189-199. 587
Silvertown, J.W. (1980) The evolutionary ecology of mast-seeding in trees. Biological
588
Journal of the Linnean Society, 14, 235-250. 589
Schmid, J.M., Mitchell, J.C. & Mata, S.A. (1986) Ponderosa pine conelet and cone 590
mortality in central Arizona. Great Basin Naturalist, 46, 445–448. 591
Smith, C.C., Hamrick, J.L. & Kramer, C.L. (1990) The advantage of mast years for 592
wind pollination. The American Naturalist 136, 154-166. 593
Solomon, M.E. (1949) The natural control of animal populations. Journal of Animal
594
Ecology, 18, 1-35. 595
Sork, V.L., Bramble, J. & Sexton, O. (1993) Ecology of mast-fruiting in three species of 596
North American deciduous oaks. Ecology, 74, 528-541. 597
Trexler, J.C., McCulloch, C.E. & Travis, J. (1988) How can the functional response best 598
be determined? Oecologia, 76, 206-214. 599
Visser, M.D., Jongejans, E., van Breugel, M., Zuidema, P.A., Chen, Y.-Y., Kassim, 600
A.R. & de Kroon, H. (2011) Strict mast fruiting for a tropical dipterocarp tree: a 601
demographic cost–benefit analysis of delayed reproduction and seed predation. 602
Journal of Ecology, 99, 1033–1044.
25 Wolgast, L.J. (1978) Effects of site quality and genetics on bear oak mast production. 604
American Journal of Botany, 65, 487-489.
605 606 607 608 609 610 611 612 613 614 615 616 617 618 619 620 621 622 623 624 625 626 627
26 Table 1. Form of the functional response of insect seed predators to available seed 628
cones at a) population level (n=29 years), b) individual level (n=217 trees) in both mast 629
and non-mast years and c) individual level (n=217 trees) in mast years. Logistic 630
regressions were used to examine the linear and quadratic effects of log10-transformed 631
available cones on the proportion of attacked cones. Significant P-values are shown in 632 bold. 633 634 635 Effects df Parameter SE χ2 P a) Population level Available cones 1, 23 -20.34 5.85 12.08 <0.001 Available cones2 1, 23 9.29 2.82 10.85 0.001
b) Individual level (across both mast and non-mast years)1
Available cones 1, 211 -17.25 0.99 301.11 <0.001 Available cones2 1, 211 8.27 0.49 280.12 <0.001 c) Individual level (mast years)
Available cones 1, 211 -19.05 2.97 41.22 <0.001 Available cones2 1, 211 9.36 1.48 40.05 <0.001 636
1
Each tree was included during both mast and non-mast years and tree identity was 637
included in the analysis as a fixed effect. 638 639 640 641 642 643 644 645
27 Table 2. Multiple logistic regressions testing the effects of individual synchrony in seed 646
production (ri), the variation at individual level in seed cone production (CVi), the total 647
cone production for each tree (Ti) upon the individual proportion of attacked seed cones 648 (Pi). 649 650 651 652 Effects df Parameter SE χ2 P Total cones 1, 211 -0.000 0.000 1680.03 <0.001 Variability 1,211 -0.517 0.024 479.36 <0.001 Synchrony 1, 211 -0.376 0.071 28.46 <0.001 653 654 655 656 657 658 659 660 661 662 663 664 665 666 667
28 Table 3. Multiple logistic regressions testing the effects of total cone production for a 668
tree within a year and the mean number of cones produced by all other trees within the 669
population for that year upon the proportion of cones attacked on a single tree within a 670
single year. With this approach, the partial regression coefficients compare the 671
influences of variation in individual vs. population-wide cone production for the rate of 672
seed predator attack. Individual tree was included as a fixed effect in the statistical 673 model. 674 675 676 Effects df Parameter SE χ2 P Individual cones 1, 2996 -0.0026 0.000 4092.94 <0.001 Population-wide cones 1, 2996 -0.0001 0.000 12775.90 <0.001 Individual tree 1, 2996 -0.0004 0.001 17.41 <0.001 677 678 679 680 681 682 683 684 685 686 687 688 689
29 FIGURE LEGENDS
690 691
Fig 1. (a) Types of functional responses of predators to available cones. See Materials 692
and methods section for specific details about the forms of the functional responses. (b) 693
Relationship between the number of available seed cones and the proportion of attacked 694
seed cones by insect seed predators at population level (white dots for non-mast years, 695
grey dots for intermediate years and black dots for mast years, r = -0.44, P = 0.017). 696
Each point represents a year (N = 29). (c) Relationship between the number of available 697
seed cones and the proportion of attacked seed cones by insect seed predators at 698
individual level in non-mast years (white dots, r = -0.11, P = 0.117) and mast years 699
(black dots, r = -0.20, P = 0.003). Each point represents an individual ponderosa pine 700
tree (N = 217). The single line shows the functional response across all trees in both 701
mast and non-mast years. 702
703
Fig 2. Annual estimates (from 1979 to 2008, except 2004) of the total number of seed 704
cones per tree (white dots, dashed line and left axis) and proportion of attacked seed 705
cones by specialist insect seed predators per tree (black dots, solid line and right axis). 706
Each point represents the average of 217 ponderosa pine trees. Error bars are omitted 707 for clarity. 708 709 710 711 712 713 714
30 715 716 717 718 719 720 721
Fig 1. Linhart et al.
722 723 724 725 726 727 728 729 P ro p o rt io n o f a tt a c k e d s e e d c o n e s
Available seed cones Type II
Type I
Type III
Available seed cones (a) (b) (c) 0 5000 10000 15000 20000 25000 30000 0.0 0.2 0.4 0.6 0.8 1.0 0 1000 2000 3000 4000 5000 6000 0.0 0.2 0.4 0.6 0.8 1.0
3 1 7 3 0 7 3 1 7 3 2 7 3 3 7 3 4 7 3 5 7 3 6 F ig 2 . L in h ar t et a l. 7 3 7 7 3 8 7 3 9 7 4 0 7 4 1 7 4 2 7 4 3 7 4 4 7 4 5
Proportion of attacked seed cones * tree-1 Seed cones * tree-1
1979 1981 1983 1985 1987 1989 1991 1993 1995 1997 1999 1980 1982 1984 1986 1988 1990 1992 1994 1996 1998 0 .0 0.1 0.2 0.3 0.4 .50 0.6 0.7 0.8 0.9 1.0 0 5 0 0 0 1 0 0 0 0 1 5 0 0 0 2 0 0 0 0 2 5 0 0 0 3 0 0 0 0 2000 2001 2002 2003 2005 2006 2007 2008
746 747 748 749 750 751 752
Plate 1. Example of healthy 753
Later in summer and early f 754
cones stay closed. Credits: K 755 756 757 758 759 760
althy and aborted seed cones in our Pinus pondero
early fall, healthy cones open to release the seeds, dits: Ken Keefover-Ring.
32
derosa population. seeds, while aborted