Int. J. Environ. Res., 5(2):555-560, Spring 2011 ISSN: 1735-6865
Received 4 June 2010; Revised 3 Sep. 2010; Accepted 9 Sep. 2010
*Corresponding author E-mail: [email protected]
Asbestos Concentrations and Lung Restrictive Patterns
Sekhavatjou, M. S.* and Zangeneh, A.Department of Environmental Engineering, Khuzestan Science and Research branch, Islamic Azad University, Ahvaz, Iran
ABSTRACT: Asbestos applications were limited during past two decades in developed nations due to its debilitating health problems, while in developing countries it’s various usages continues. The main goals of present study were evaluation of asbestos concentrations in ambient outdoor and indoor air and occupational exposure, as well as exposure effects on pulmonary function. Sampling procedure was carried out during May and June 2010 at four outdoor and seven indoor air sampling stations. Ten persons were selected based on their exposure limits including high, moderate and low exposure. Also to assess pulmonary function of workers, 42 spirometry cases were tested. Samples were analyzed by SEM with EDXA. Obtained results revealed that average concentrations of asbestos fibers were 1.885×10⁻⁵ f/mL and 0.065 f/mL in outdoor and indoor air,
respectively. Occupational exposure contents were between 1.5 ×10⁻⁵ – 0.2 f/mL (based on exposure limits).
Spirometry tests showed that 28% of workers had impaired lung functions. Lung restrictive pattern in workers were 2% severe, 12% moderate and 14%. Results showed pattern of fibrous particles as actinolite> termolite> chrysotile in indoor air. Generally, it is clear that there is positive meaningful relationship between more than ten occupational ages and malfunction of lungs in studied workers due to asbestos effects. Key words: Environnent, Exposure, Indoor, Ambient, Fibre, Asbestos, SEM
INTRODUCTION
Asbestos fibrous forms have been used for many years as raw materials for the production of a large variety of materials (Pastuszka, 2009). Asbestos, naturally occurring hydrated mineral silicates (Hardy & Aust, 1995) are mainly comprised of two groups: serpentine and amphibole (Jaurand et al., 1984). Serpentine is represented only by chrysotile while amphiboles include amosite, actinolite, anthophyllite, crocidolite and tremolite (ATSDR, 2001; Lippmann, 2000; Meeker et al., 2001; Christiansen et al., 2003; Paustenbach et al., 2004). A variety of mineral fiber types, especially asbestos, have been used as commercial products for thermal or acoustic insulation (Baron, 2001). Serpentines are used in industries more common while amphiboles are more dangerous and more attributable to asbestos related-diseases (Hodgson & Darnton, 2000; Mossman et al., 1990). Issues related to asbestos induced disorders caught more attention worldwide in last couple of decades (Lange, 2005). Asbestos is regarded as exceedingly dangerous because the inhalation of asbestos fibers can lead to the development of debilitating health problems. All asbestos-related diseases appear to be caused from chronic exposure; acute exposure does
not seem to result in serious illness. Fiber toxicity appears to be primarily a function of fiber concentration, dimensions and durability in the lungs (Baron, 2001; Lange, 2005). It has been scientifically proven that the inhalation of asbestos fibers can cause serious lung diseases, like mesothelioma (Gualtieri et al., 2009). The effects of asbestos on the human body include the asbestiform varieties of serpentine, riebeckite, grunerite, anthophyllite, tremolite and actinolite (Pastuszka, 2009; Kakooei et al., 2007). Also they induce fibrosis, lung cancer (by the inhalation of asbestos fibers), mesothelioma, and probably other kinds of intestinal cancer (Mossman et al., 1996; Anastasiadou & Gidarakos, 2007). While the use of asbestos has been prohibited or restricted in much of the developed world consumption is growing in Asia, Latin America and the Commonwealth of Independent States (Kazan-Allen, 2005).
MATERIALS & METHODS
This research was carried out in a cement-asbestos pipe and plate manufacturing plant that is located in southwest of Iran near Ahvaz city. Asbestos particles were collected in ambient outdoor (4 stations), indoor
air (7 stations) and workers breathing zone for occupational exposure during May-June 2010. Personnel samples were selected based on their exposure limits including four personnel samples with directly high exposure, three samples with moderate exposure and three samples with low exposure. Also blank samples were determined to prevent any interference (NIOSH, 1994). Air sampling was performed according to the standard method for asbestos sampling the NIOSH Method 7400. All air samples were collected on open-face, 25-mm diameter, 0.45-µm pore size mixed cellulose (MCE) attached to filter cassette holder connected to a SKC personnel sampling pump
at flow rate 4 l/min. The duration of personnel sampling for airborne asbestos ranged from 30 to 120 min (NIOSH, 1994). Sampling pumps were placed 1 m above ground level away from obstructions that may influence air flow (NIOSH, 1994; USEPA, 1994). Samples were placed on cassette holder exactly at the end of sampling activities and they were transported to a fixed place. Samples were analyzed by scanning electron microscopy (model XL30) with energy dispersive (SEM – EDXA) (VDI, 1991). SEM measures the surface of particles on a substrate and allows for good visualization of fiber morphology (fibers >0.2 ìm in diameter). A fiber was defined as any particle longer than 5 ìm and with a length-to-diameter ratio of 3:1(NIOSH, 1994; Kakooei et al., 2009). For quality assurance 10% of the field samples were recounted (Baron, 2001). The airborne asbestos concentration is given by the formula:
CSEM = 1000 N.π. r2 / V. n
2 .a fibers per millilitre (f/mL) equation (1)
Where: N is the number of fibers counted; n2 is the number of screen areas examined; r (mm) is the radius of the exposed filter area; a (mm2) is the calibrated screen area; V (liters) is the volume of air sampled.
Also, asbestos fiber concentrations that were found in the contaminated filters and the corresponding values of the upper and lower confidence limits, for a Poisoning distribution, to 95% probabilities, were estimated. Spirometric examination is themost widely
used tests for pulmonary function. In order to assess the possible effects of asbestos on lung function, 42 spirometry tests were done. Analyses of spirometry tests were based on American Thoracic Society (ATS) standard (American Thoracic Society, 1991).
RESULTS & DISCUSSION
All the collected asbestos samples were analyzed by SEM and the asbestos concentrations were calculated using equation (1). The results of airborne asbestos concentrations in ambient outdoor and
indoor air are provided in Table (1). Table (2) shows the results of asbestos fiber concentrations in personnel samples.
The permissible exposure limits (PEL) for asbestos is 0.2 f/cm3 of air as a time-weighted average concentration (TWA, 8-h work shift with an action level) and 0.1 f/cm3 as an hour TWA (OSHA, 1998; USEPA, 1987). The National Institute for Occupational Safety and Health (NIOSH) Recommended Exposure Limit (REL) is 0.1 f/mL as a TWA concentration for up to an 8-h work shift (OSHA, 1998).
As Table (1) shows maximum concentration of asbestos fiber is 3.1×10⁻⁵ (f/mL) in ambient outdoor air, that is lower than permissible exposure level (PEL). Also indoor asbestos in the air in almost all samples are lower than PEL, as the geometric mean asbestos concentrations is 0.065 (f/mL) but in some stations the asbestos concentrations are higher than PEL. Although, asbestos concentrations in indoor air are higher than ambient outdoor air. Table (2) reveals that all the workers in places with direct and high exposure of asbestos have more exposure of asbestos concentrations than PEL, such as material mixing and productions, finishing, pipeline manufacturing unit and plate production unit. But workers in other categories of asbestos expose (moderate and low) have lower exposure of asbestos concentrations.
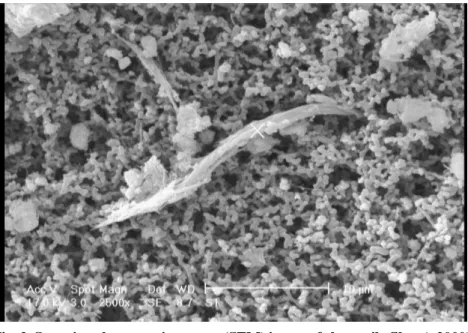
The SEM photographs in Figs. 1, 2 and 3 were obtained by a conventional SEM instrument with a metal evaporation coating and show airborne chrysotile and actinolite fibers in the ambient air. The chemical composition of the fibers was analyzed by energy-dispersive x-ray analysis. Relative elemental concentrations can be estimated from the peak areas in the EDXA analysis of the airborne asbestos. The SEM image and EDXA spectrum of chrysotile, actinolite and tremolite is show the elemental percentage of magnesium, silicon and iron are 29.32, 58.93 and 7.04%, respectively in chrysotile fiber. For actinolite elemental percentage consist silicon (62.25), iron (28.37) and calcium (6.38) and this elemental structure for tremolite are as Mg: 21.37%, Si: 46.67% and Fe: 5.51%. Also different types and compounds of asbestos fibers collected in outdoor and indoor air and occupational exposure are tabulated in Table (3). Table (3) indicates that fibers concentrations in indoor air decreases as actinolite (66%)>tremolite (22%)> chrysotile (12%). Also, actinolite has the highest concentration in ambient outdoor air and personnel samples.
Results of 42 spirometry tests in studied workers with different asbestos exposure that there are different lung restrictive functions as normal, mild, moderate and severe. According to these tests, FVC, FEV1 and FEV1/FVC were determined for all 42 workers. It should
Int. J. Environ. Res., 5(2):555-560, Spring 2011 Asbestos concent ration (f/ml) Fibers coun ted Number of samples Area 6.7×10⁻⁶ 2 Min 3.1×10⁻⁵ 7 Max 1.885×10-5 4 8 Mea n Ambient outdoor sampling 1.31×10⁻⁵ 4 Min 0.13 17 Max 0.065 8 14 Mea n Ambient indoor sampling
Table 1. Results of asbestos fiber concentrations in ambient and indoor air per fiber
Table 2. results of asbestos fiber concentrations in personnel samples Asbestos con centr at ion (f/ml) Fib ers counte d personn el samp le Area 0.18 24 H1 0.2 18 H2 0.14 12 H3 0.15 16 H4 0.17 Me an concentration 1.6-1.8 LCL-UCL Direct a nd high Expose 3.3×10⁻⁵ 4 M1 4.5×10⁻⁵ 6 M2 5.2×10⁻⁵ 7 M3 4.3×10⁻⁵ Me an concentration (-0.099) -0.1003 LCL-UCL Moderate Expose 1.5×10⁻⁵ 3 L1 1.5×10⁻⁵ 3 L2 3.3×10⁻⁵ 4 L3 2.1×10⁻⁵ Me an concentration (-0.099) -0.1001 LCL-UCL Low Expose pe rsonnel Sa mpling
Fig. 2. Scanning electron microscope (SEM) image of chrysotile fiber (×2000)
Fig. 3. Scanning electron microscope (SEM) image of actinolite fiber (×5000) Table 3. Different types and components of asbestos fibers collected in outdoor and indoor
air and ccupational exposure
Area Fiber types Percen tage
Environmental Sampling
(out door ) actinolite 100
chrysotile 12 trem olite 22 Environmental
Sampling
(in door) actinolite 66
trem olite 10 chrysotile 20 High a nd Direct
Expose
actinolite 40
M edium Expose trem olite 20
Pe rsonnel Sampling
Int. J. Environ. Res., 5(2):555-560, Spring 2011
Table 4. Literature data on the outdoor monitoring of asbestos
Are a type an d L oc at ion Concent ration (f/ml) Refere nce
Home environme nt in Uppe r Silesia, Poland 0.3×10⁻³–1.8×10⁻³ P astuszka, 2009 Outdoor living area s ne arby industrial sites, Germa ny 0.1×10⁻³–18×10-3 S ebastien et a l., 1986 Outdoor living area s ne arby a dismissed plant, Sa lonit
Anhovo (S lovenia )
lower than 0.5 ×10⁻³
B iz ja k et al., 1996 Outdoor living area s ne arby a dismissed plant, Sz czucin
( Pola nd)
6.2 ×10⁻³ P astuszka et a l., 2000 Outdoor living area s ne arby a dismissed plant, Ce rdanyola
( Spain)
<1 ×10⁻³ B ologna et al., 2005 Outdoor living area s ne arby a plant for the produc tion of
thermo-electrical e ne rgy, Ca strovillari (Italy)
0.000–1.767×10⁻³ C orte se et al., 2006 Outdoor living area s, Biancavilla (Italy) 0.10×10⁻³–0.56×10⁻³ Da mia ni et al., 2006 Outdoor living spots ne arby the asbestos ex-m ining areas
of Alessandr ia, Torino, and Cuneo, P ie dmont (I taly)
0.1×10⁻³–0.2×10⁻³ Giacome lli et al., 2006 Unorga nize d asbestos mills of Rajasthan located at
B eawer, India
2.00–5.09 Ansari et al., 2007 R ailways rolling stock insulation re moval plant in Catona,
R eggio Ca labria
0.1×10⁻³-2.8 ×10⁻³ F alcone et al., 2005 R outine Brake Lining M anufacture, Iran 0.36-1.85(mean) Ka kooei et al., 2007 be pointed that 28% of workers in the area of study,
have abnormalities of lung function that might otherwise be overlooked and can exclude the possibility of some respiratory disorders such as chronic obstructive pulmonary disease. Abnormalities of lung function in all studied workers include different restrictive patterns such as severe (2%), moderate (12%) and mild (14%). While abnormalities percentages of lung function increase to 32% (severe4%) in some places of the studied plant with high exposure (such as material mixing and productions, finishing, pipeline manufacturing unit and plate production unit). Also, trends of lung restrictive patterns changes in workers with different asbestos concentrations exposure is presented in Fig. (4). Generally, literatures for environmental asbestos sampling are summarized in Table (4).
0 10 20 30 40 50 60 70 80 90 100
Normal Mild M odera te Sever e
Lung r estrictive pattern
pe rcen ta ge Low expose Moderate expose High expose
Fig. 4. Lung restrictive patterns in exposure to different concentrations of asbestos fibers (based on spirometry tests)
The reported fiber concentrations for the various sites is extremely variable ranging from practically zero in ambient environments up to 50×10-3–100×10-3 f/mL in closed environments. Ansari et al. (2007) reported that air asbestos concentrations were about 2.00–5.09 (f/mL) in unorganized asbestos mills of Rajasthan located at Beawer, India, that is really higher than PEL. Pastuszka (2009) reported similar concentration of air asbestos in Poland and Germany (0.3×10⁻³–1.8×10⁻³ f/ mL), respectively that is more than PEL. But as Kakooei et al. reported air asbestos concentration (0.36-1.85 f/ mL) in a routine brake lining manufacture in Iran is very higher than permissible limit. The present study indicates that air asbestos concentrations in some indoor stations and personnel samples with direct expose are higher than permissible limit.
CONCLUSION
Base on gained results, geometric mean concentration of asbestos in ambient air (1.885×10⁻⁵) is lower than NIOSH PEL (0.1 f/mL). Also indoor air asbestos concentrations are higher than permissible limit in some cases. While the workers who are in places with direct and high exposure of asbestos receive higher exposure of asbestos such as material mixing and productions, finishing, pipeline manufacturing and plate production unit. Accordingly 28% of workers have abnormalities of lung function in the area of study. Also, Abnormalities of lung function in all studied workers include different restrictive patterns such as severe (2%), moderate (12%) and mild (14%). The relationships between work ages and lung malfunction are positive meaningful (p<0.05) as in worker with occupational records more than 10 years, abnormalities of lung function as restrictive pattern are very common. This mentions that process flow and machinery must be improved and adequate engineering controls such as local exhaust ventilation hoods on the process or complete understanding of proper safe work practices could be applied.
REFERENCES
Agency for Toxic Substances and Disease Registry (ATSDR) (2001). Toxicological profile for asbestos update (Final Report), Public Health Service, U.S. Department of Health and Human Services Atlanta, GA: 146pp. NTIS Accessories No. PB/2001/109/01.US Department of Health and Human Services, Public Health Services, Atlanta USA.
American Thoracic Society (1991). Lung function testing: Selection of reference values and interpretative strategies. Am Rev Respire Dis 144, 1202-1218.
Anastasiadou, K. and Gidarakos, G. (2007). Toxicity evaluation for the broad area of the asbestos mine of northern Greece. J. Hazardous Materials A, 139, 9–18.
Ansari, F. A., Ahmad, L,, Ashquin, A., Yunus, M. and Rahman, Q. (2007). Monitoring and identification of airborne asbestos in unorganized sectors, India. Chemosphere, 68, 716–723.
Baron, P. A. (2001). Measurement of Airborne Fibers: A Review. Industrial Health, 39, 39–50.
Christiansen, J., Miller, A., Weis, C., Goldade, M. and Peronard, P. (2003). Libby, Montana. Asbestos Site Evaluation, Communication, and Cleanup. Sept. 23-26. Keystone, Colorado.
Gualtieri, A. F., Mangano, D., Gualtieri, M. L., Ricchi, A., Foresti, E., Lesci, G., Roveri, N., Mariotti, M. and Pecchini, G. (2009). Ambient monitoring of asbestos in selected Italian living areas. J. Environ. Management 90, 3540–3552. Hardy, J. A. and Aust, A. E. (1995). Iron in asbestos chemistry and carcinogenicity. Chem. Rev., 95, 97-118 . Hodgson, J. T. and Darnton, A. (2000). The quantitative risks of mesothelioma and lung cancer in relation to asbestos exposure. Annals of Occupational Hygiene, 44, 565-601.
Jaurand, M. C., Gaudichet, A., Halpern, S. and Bignon, J. (1984) In vitro biodegradation of chrysotile fibres by alveolar macrophages and mesoth-elial cells in culture: comparison with a pH effect. Br. J. Ind. Med., 41, 389-395.
Kakooei, H., Sameti, M. and Kakooei, A. A. (2007). Asbestos exposure during routine Brake Lining Manufacture. Industrial Health, 45, 787–792.
Kakooei, H., Yunesian, M., Marrioyad, H. and Azam, K. (2009). Assessment of airborne asbestos fiber concentrations in urban area of Tehran, Iran. Air Quality and Atmosfere Health, 2, 39–45.
Kazan-Allen, L. (2005). Asbestos and mesothelioma: Worldwide trends. Lung Cancer, 49S1, S3—S8.
Lange, J. H. (2005). Asbestos containing floor tile and mastic abatement: is there enough exposure to cause Mesothelioma, lung cancer or asbestosis. Indoor Built. Environ., 14, 83–88. Lippmann, M. (2000). Asbestos and Other Mineral and Vitreous Fibers. Environmental Toxicants Human Exposures and Their Health Effects. Ed: Morton Lippmann. John Wiley and Sons: New York.
Meeker, G. P., Brownfield, I. K., Clark, R. N., Vance, J. S., Hoefen, T. M., Sutley, S. J., Gent, C. A., Plumlee, G. S., Swayze, G., Hinkley, T. K., Horton, R. and Ziegler, T. (2001). The Chemical Composition and Physical Properties of Amphibole from Libby, Montana: A Progress Report. U.S. Geological Survey Administrative Report for the U.S. Environmental Protection Agency Region VIII.
Mossman, B. T., Bignon, J., Corn, M., Seaton, A. and Gee, J. B. L. (1990). Asbestos: Scientific Developments and Implications for Public Policy. Science, 247, 294-301. Mossman, B. T., Kamp, D. W. and Weitzman, S. A. (1996). Mechanisms of Carcinogenesis and clinical features of asbestos-associated cancers. Cancer Invest, 14, 464–470. National Institute for Occupational Safety and Health (NIOSH; 1994). Asbestos and other fibers by PCM: 7400. NIOSH Manual of Analytical Methods (NMAM). Occupational Safety and Health Administration (OSHA; 1998). Occupational Safety and Health Standards, Toxic and Hazardous Substances. Code of Federal Regulations 29 CFR 1910.1001.
Pastuszka, J. S. (2009). Emission of airborne fibers from mechanically impacted asbestos-cement sheets and concentration of fibrous aerosol in the home environment in Upper Silesia, Poland. J. Hazardous Materials 162, 1171– 1177.
Paustenbach, D. J., Finley, B. L., Lu, E. T., Brorby, G. P. and Sheehan, P. J. (2004). Environmental and occupational health hazards associated with the presence of asbestos in brake lining and pads (1900 to present): a State -of-the-art Review. J. Toxicol. Environ. Health, 7, 25–80.
VDI (1991) Measurement of inorganic fibrous particles in ambient air (part 1) scanning microscopy method. VDI (3492) Hand book Reinhaltung der luft band.